-
-
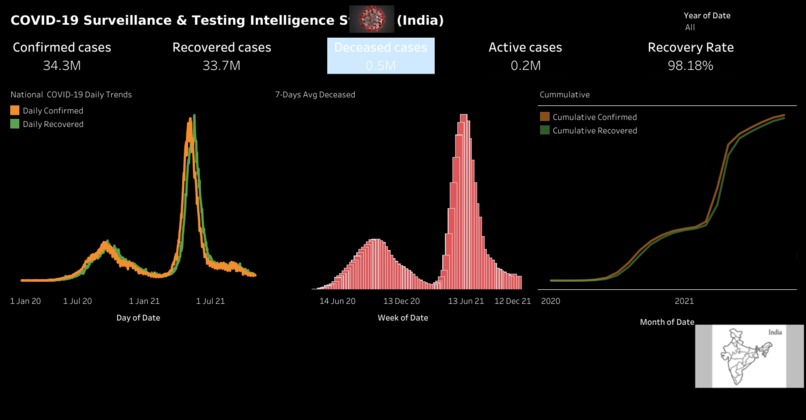
National Level analysis COVID-19
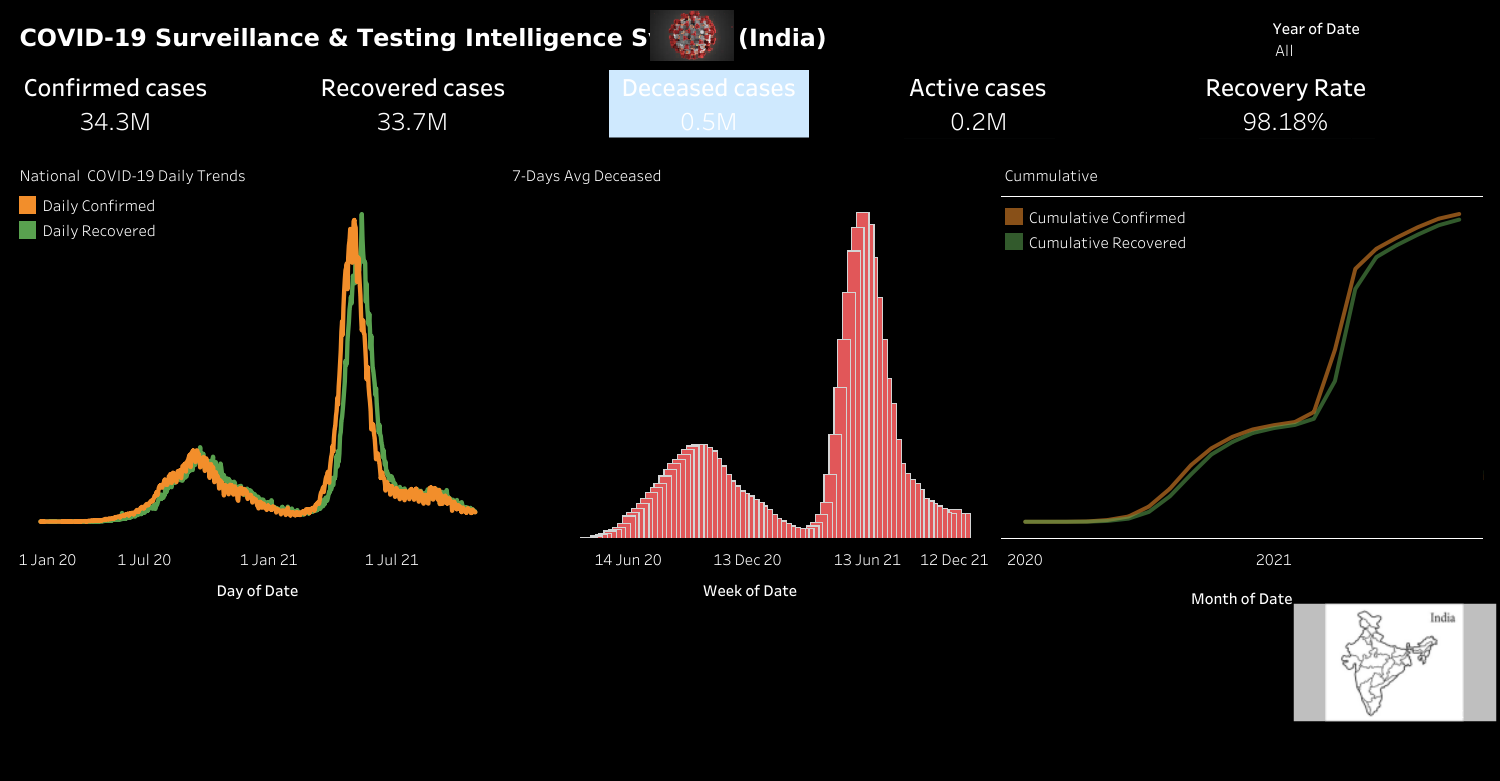
A COVID-19 Dashboard is an interactive data visualization tool used to track, analyze, and present COVID-19 trends in a clear and real-time manner. It helps governments, researchers, and the public understand how the pandemic evolves across regions.
Key Features
Confirmed cases, recoveries, and deaths displayed over time
Daily and cumulative trends using line and bar charts
Geographical analysis with maps (country, state, or district level)
Filtering options by date, region, or case type
Built With
- databases


Log in or sign up for Devpost to join the conversation.