-
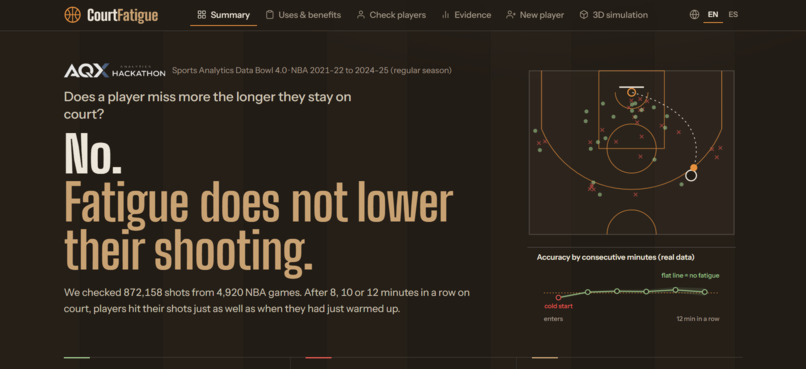
home page
-
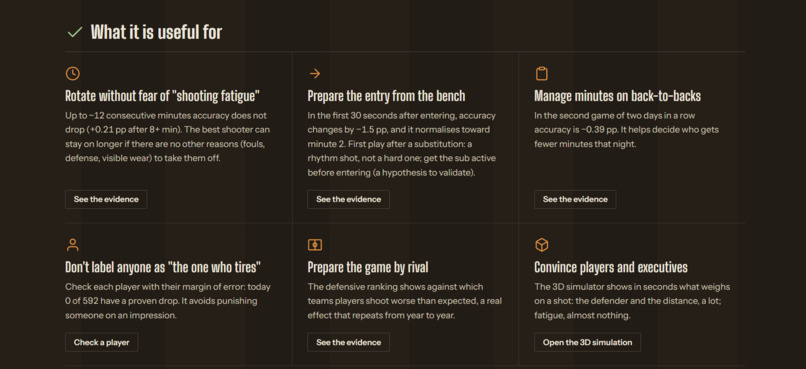
uses and benefits
-
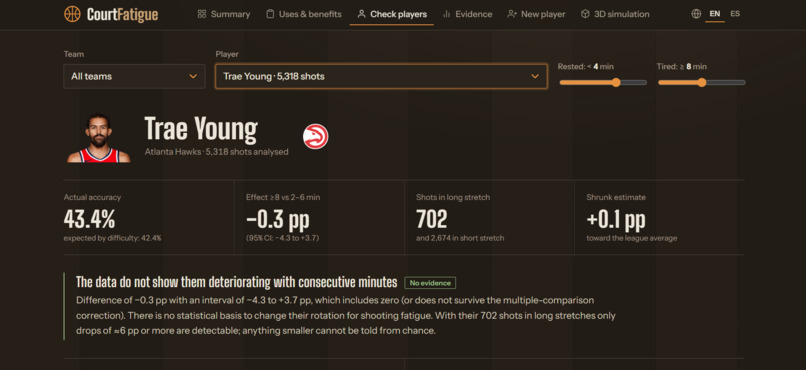
review player data
-
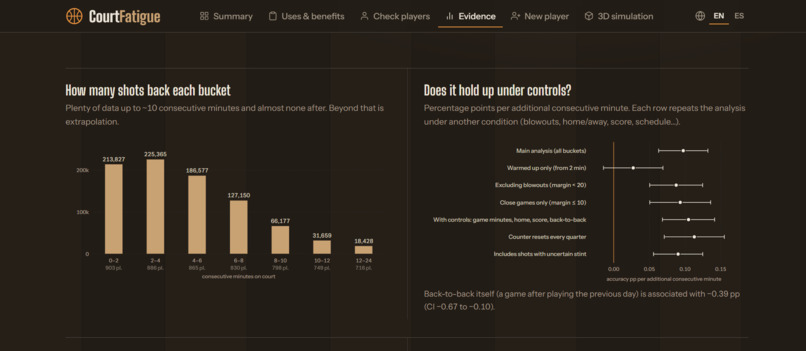
robustness checks
-
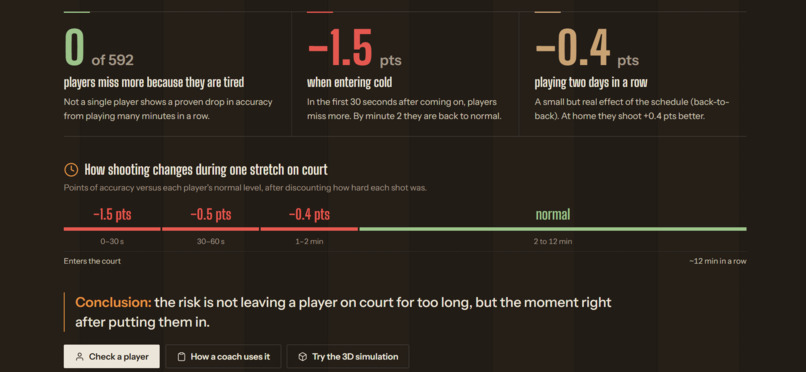
key findings
-
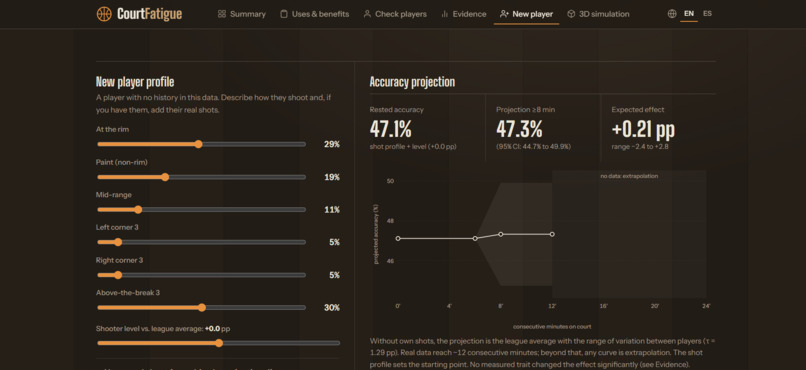
tests with data from an unknown player
-
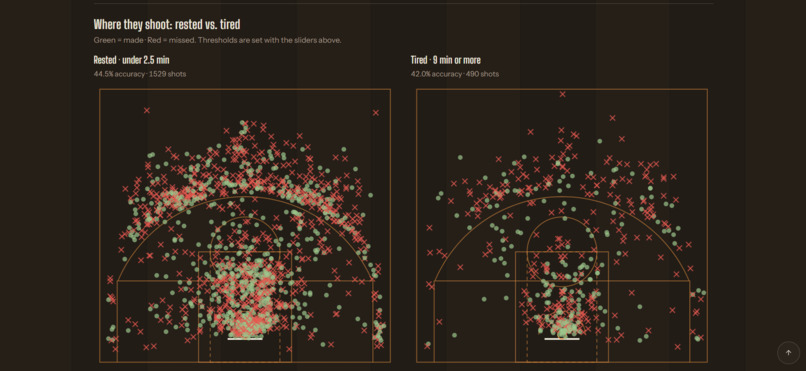
shot maps
-
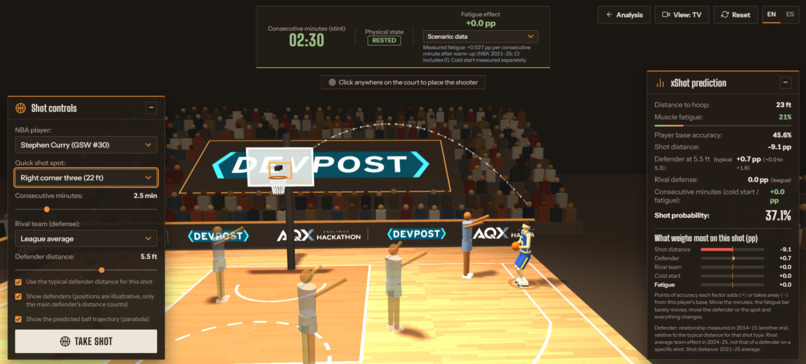
simulator2
-
simulator3
-
simulator1
-
simulator4
-
team defense
Inspiration
Every basketball fan has heard it: a tired player can't shoot. Legs go, the release gets flat, and the ball starts hitting the front of the rim. I believed it too. It is one of those ideas that feels so obvious nobody checks it, yet it shapes real decisions: coaches pull shooters "before they get tired", and fans blame missed shots on too many minutes.
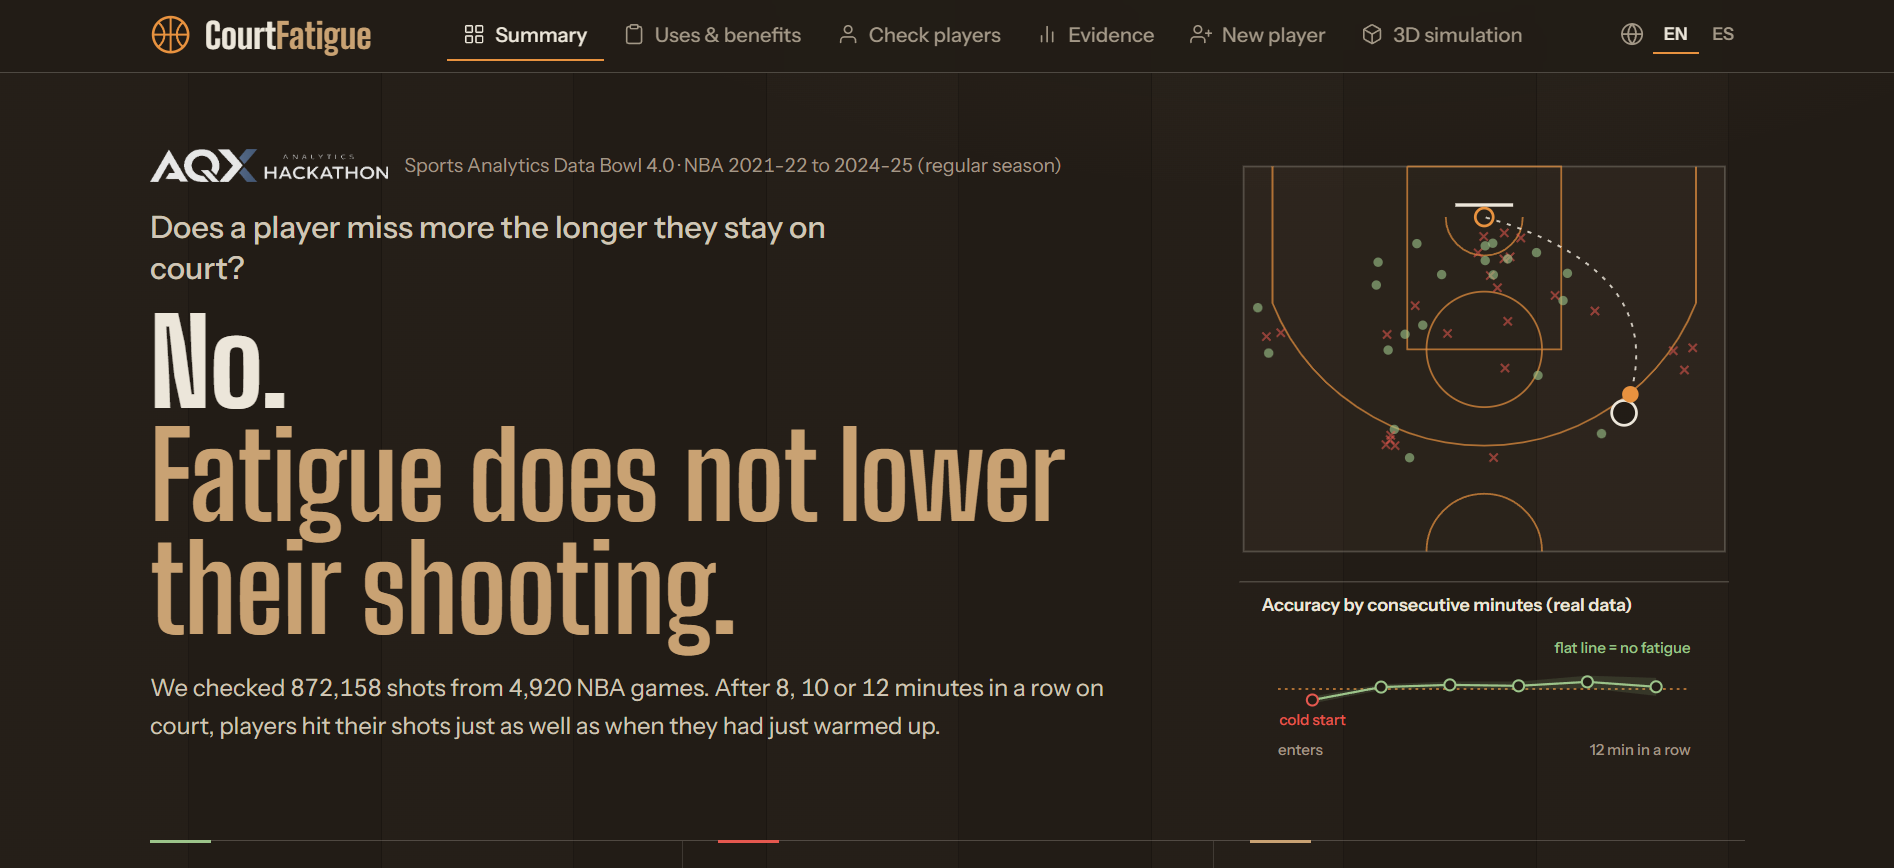
So I decided to test it: does a player's shooting accuracy drop the longer he stays on court without a rest? I expected to confirm the old saying. The data told a different story.
What it does
CourtFatigue measures whether NBA shooting accuracy changes with consecutive minutes on court, after discounting how hard each shot was, and tells you how certain any claim about a specific player can be.
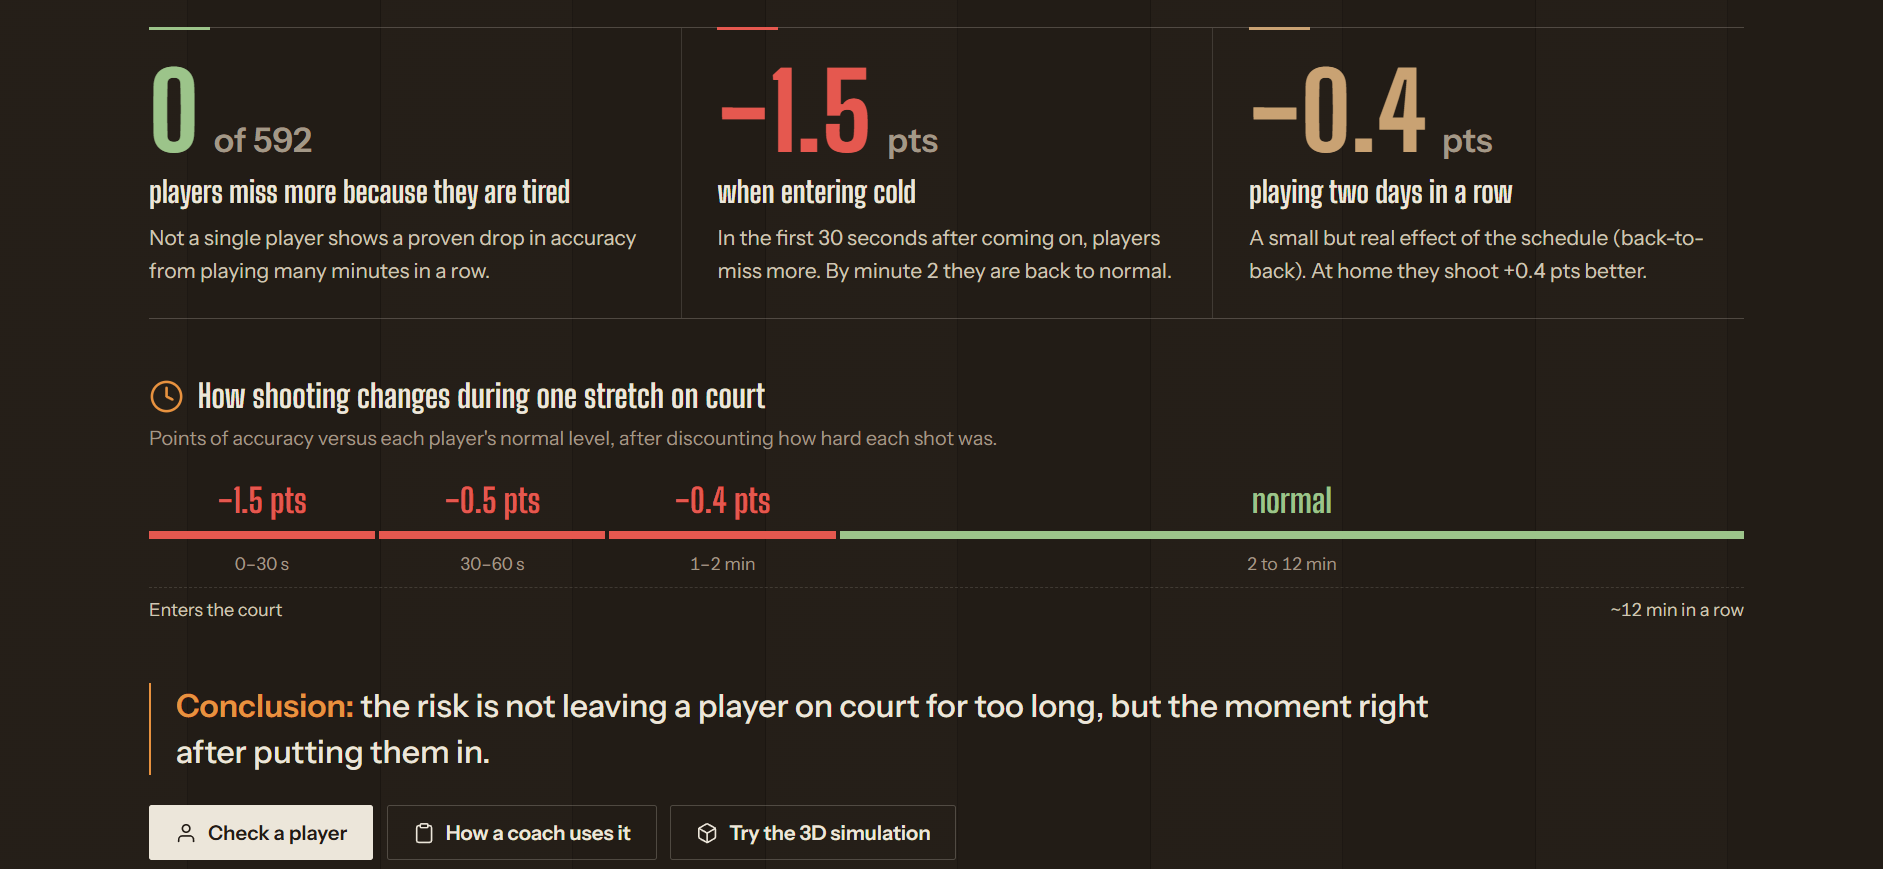
- Summary: the answer in plain language. No shooting fatigue up to ~12 straight minutes; the real dip is the cold start, the first 30 seconds after checking in.
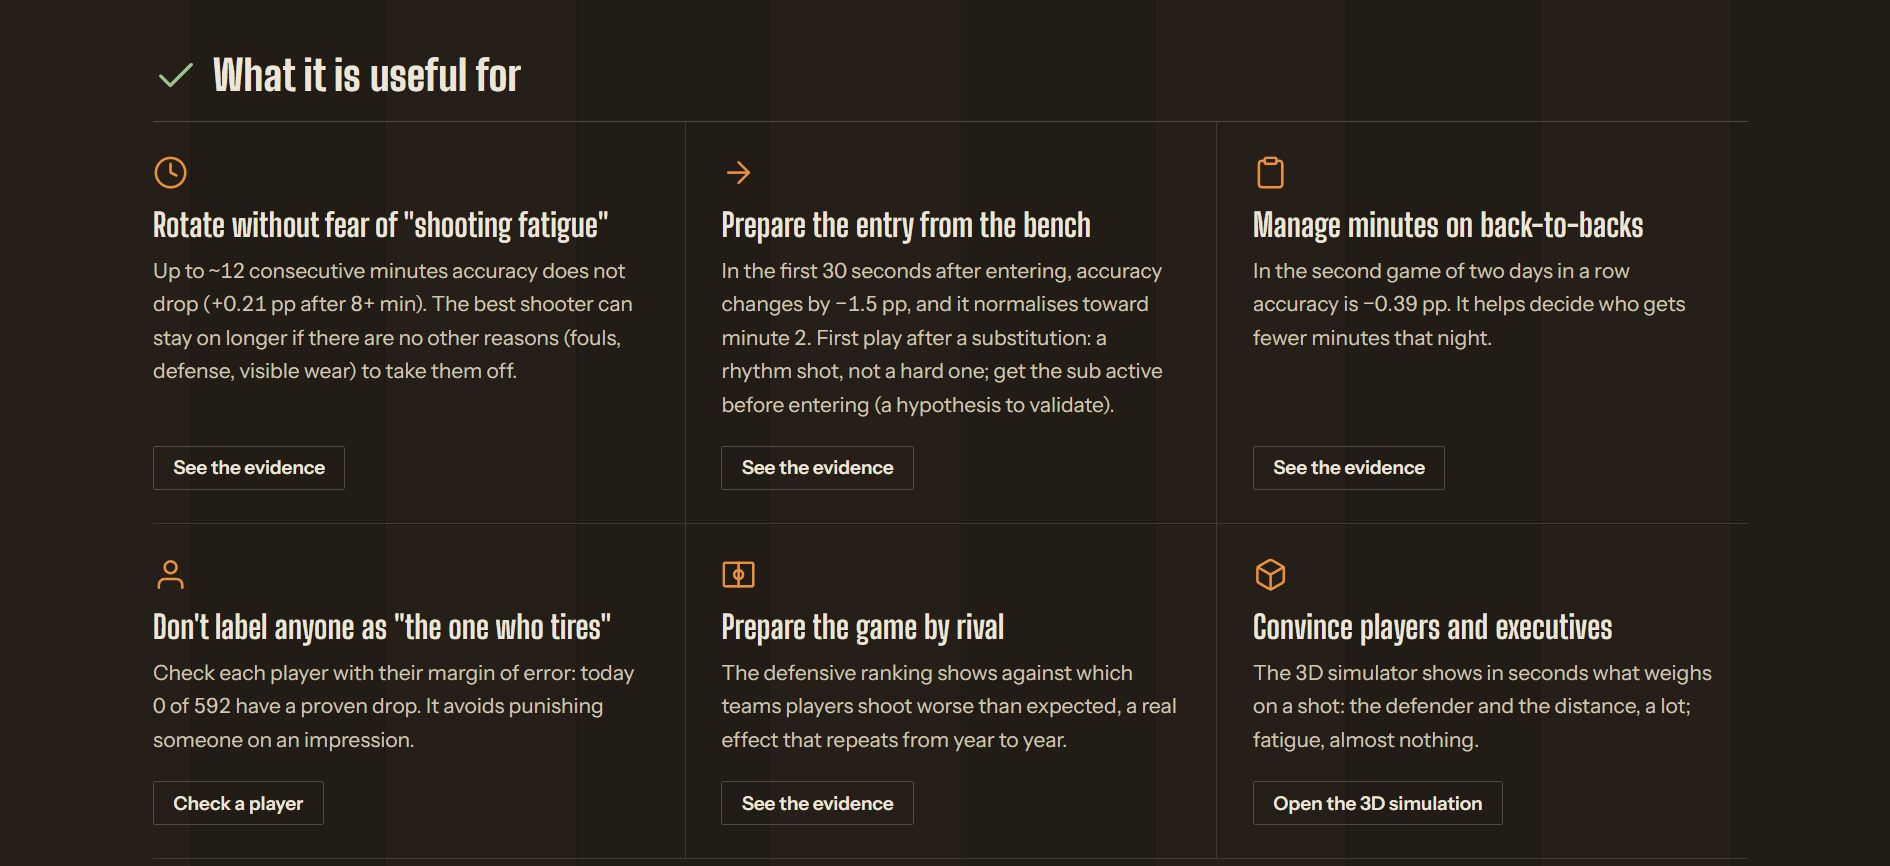
- Uses & benefits: how a coaching staff can use the findings, and what the tool does not do.
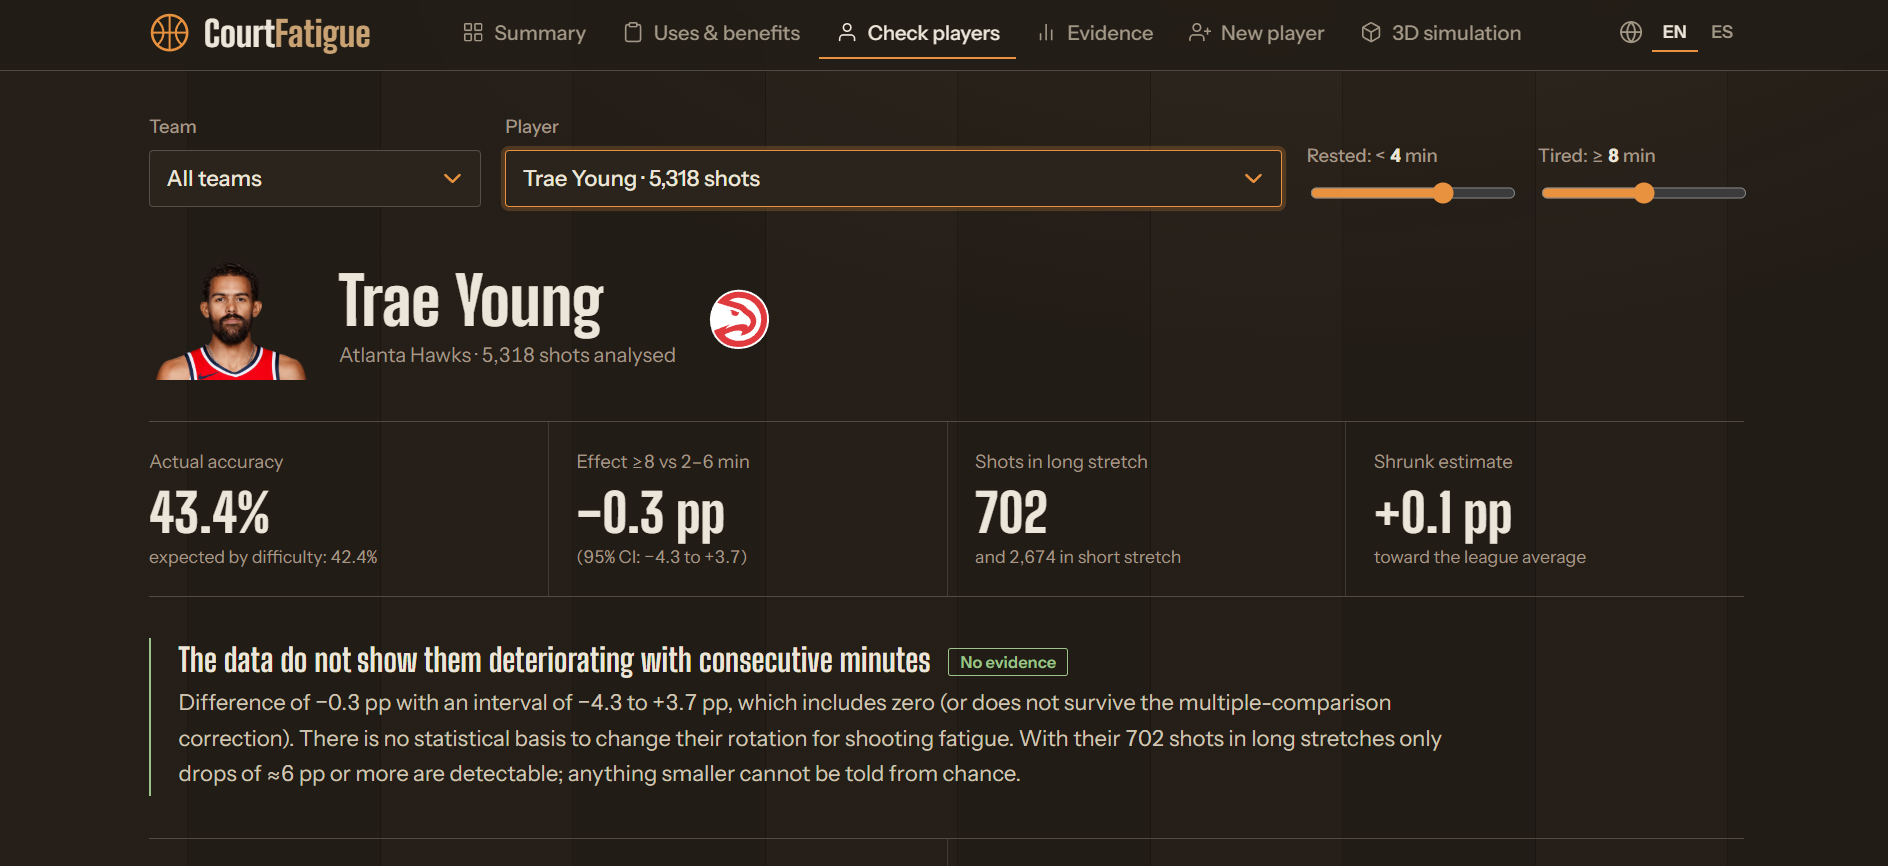
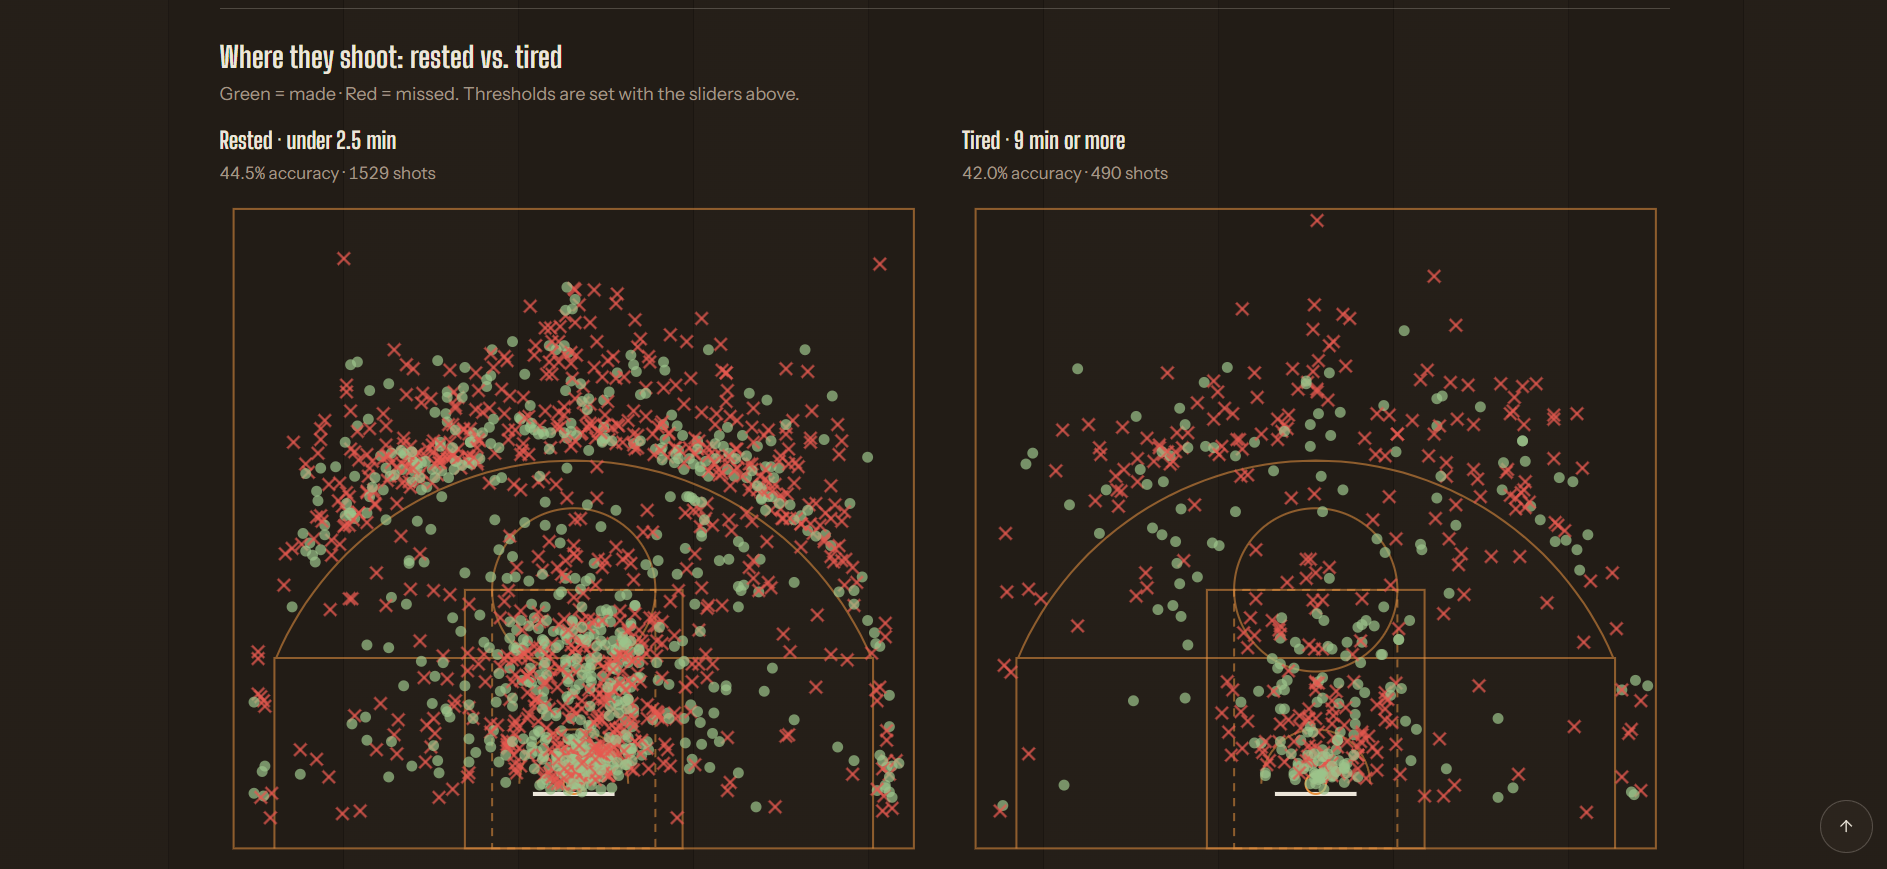
- Check players: any player's curve by minute, his rested vs. tired shot maps, and a verdict with its margin of error.
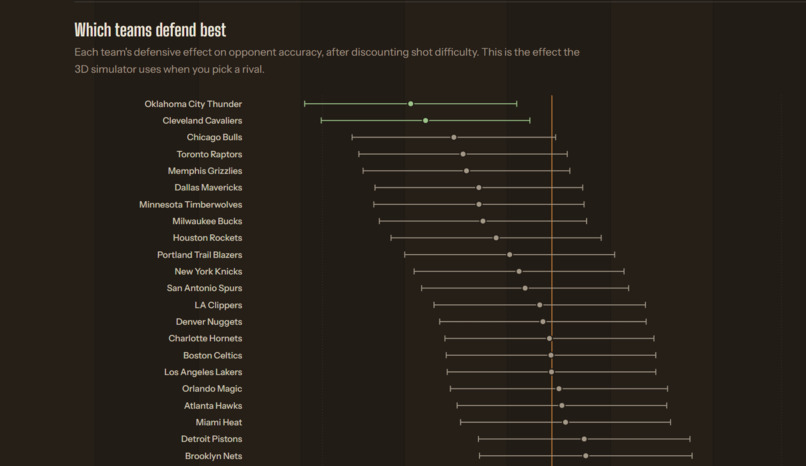
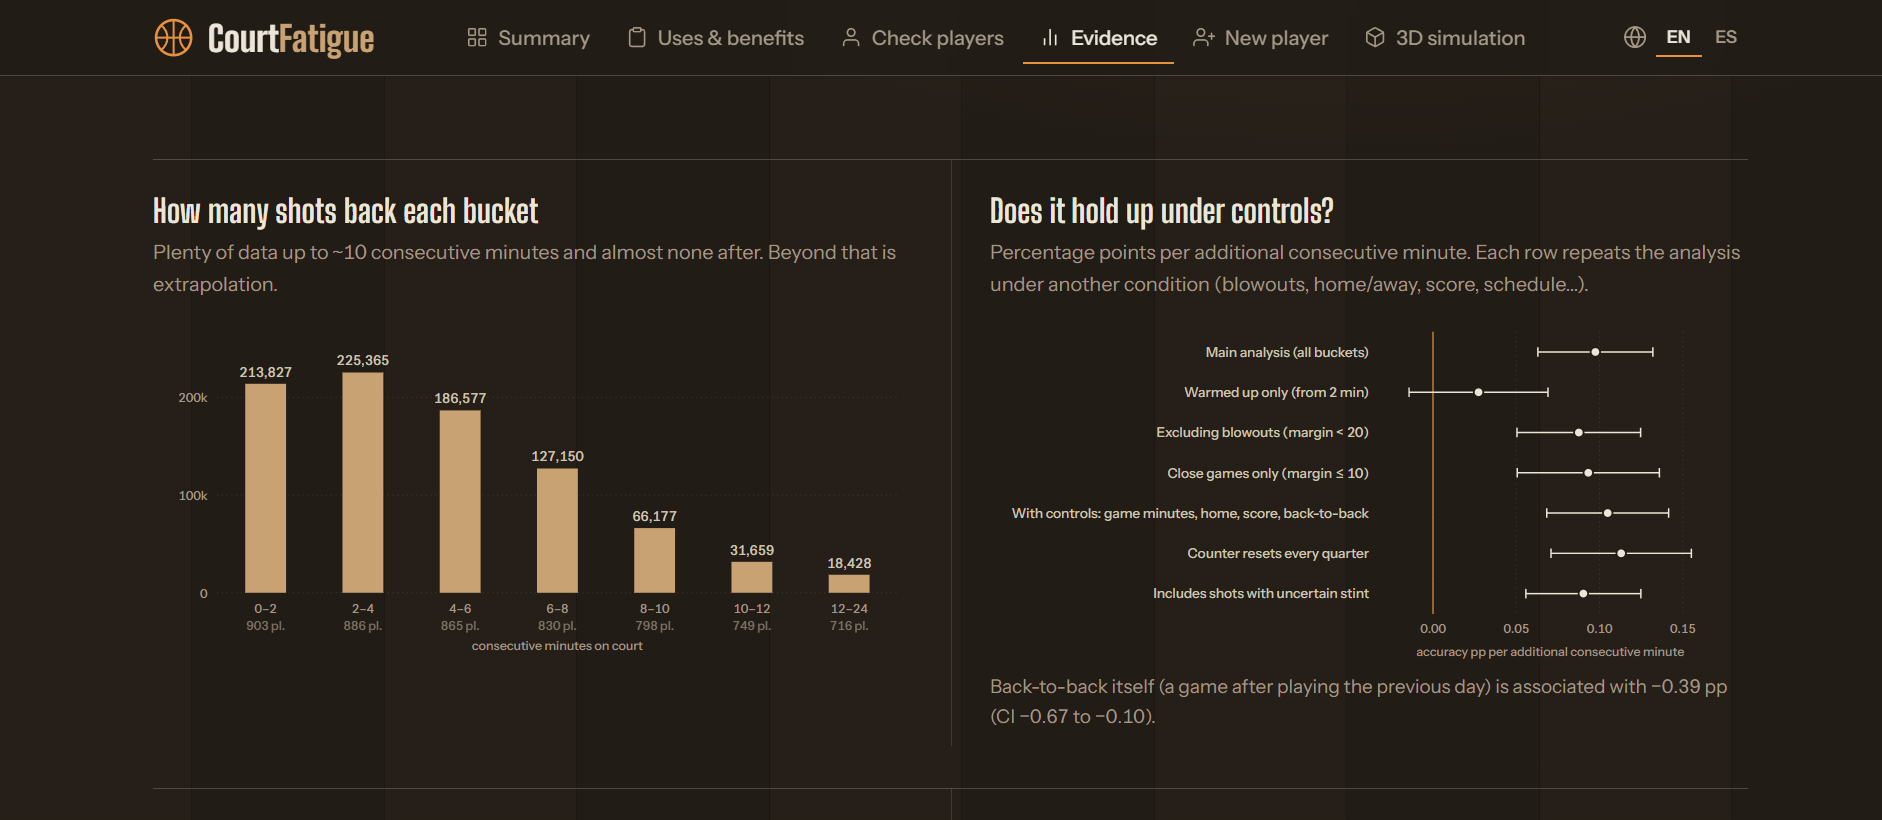
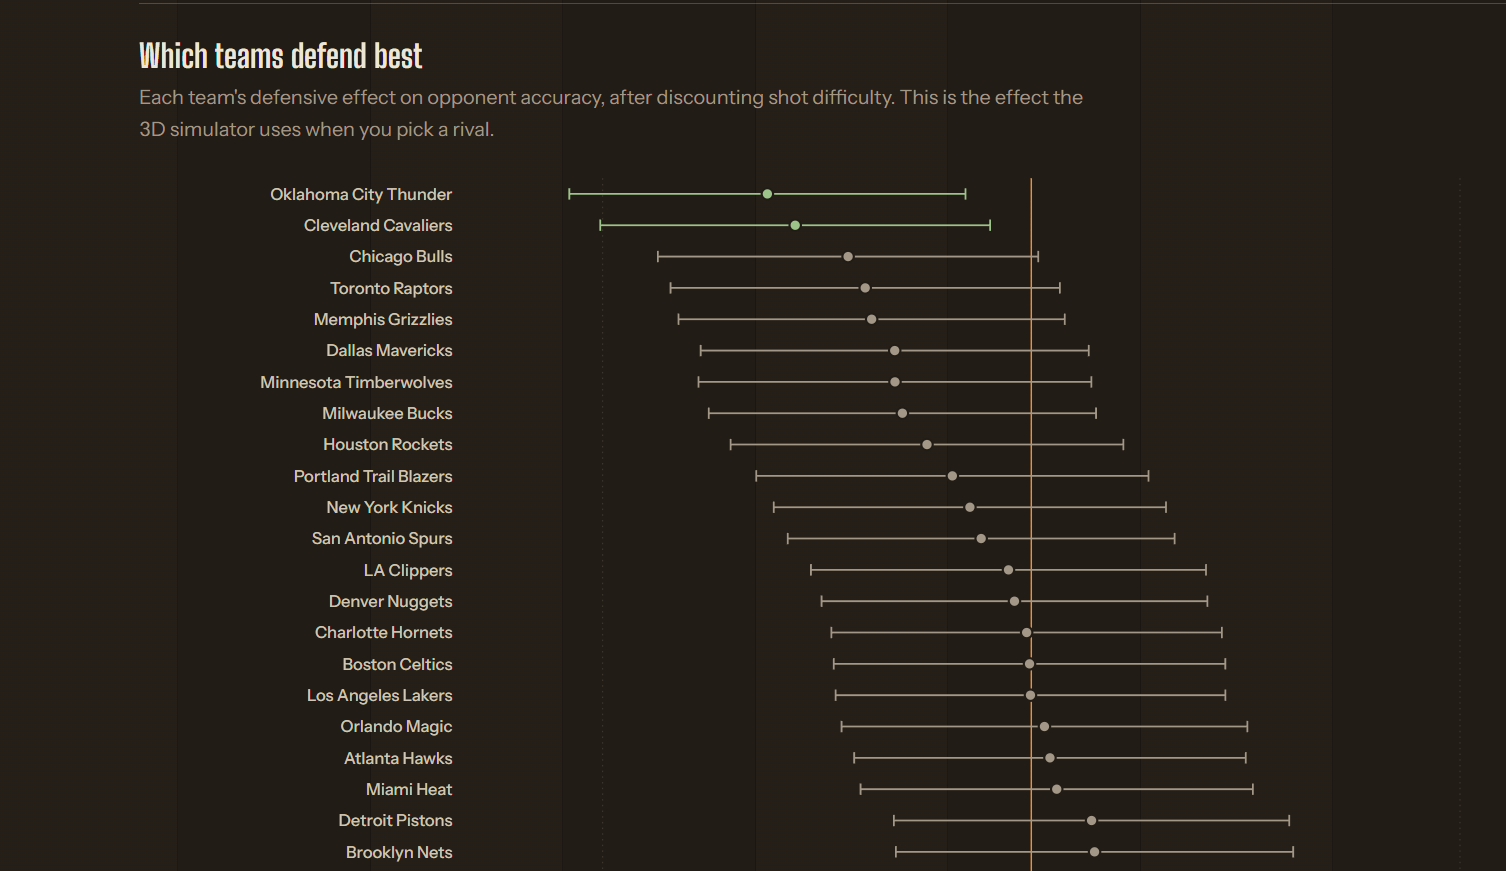
- Evidence: robustness checks, season-by-season replication, cold start, court zones, player traits and team defense.
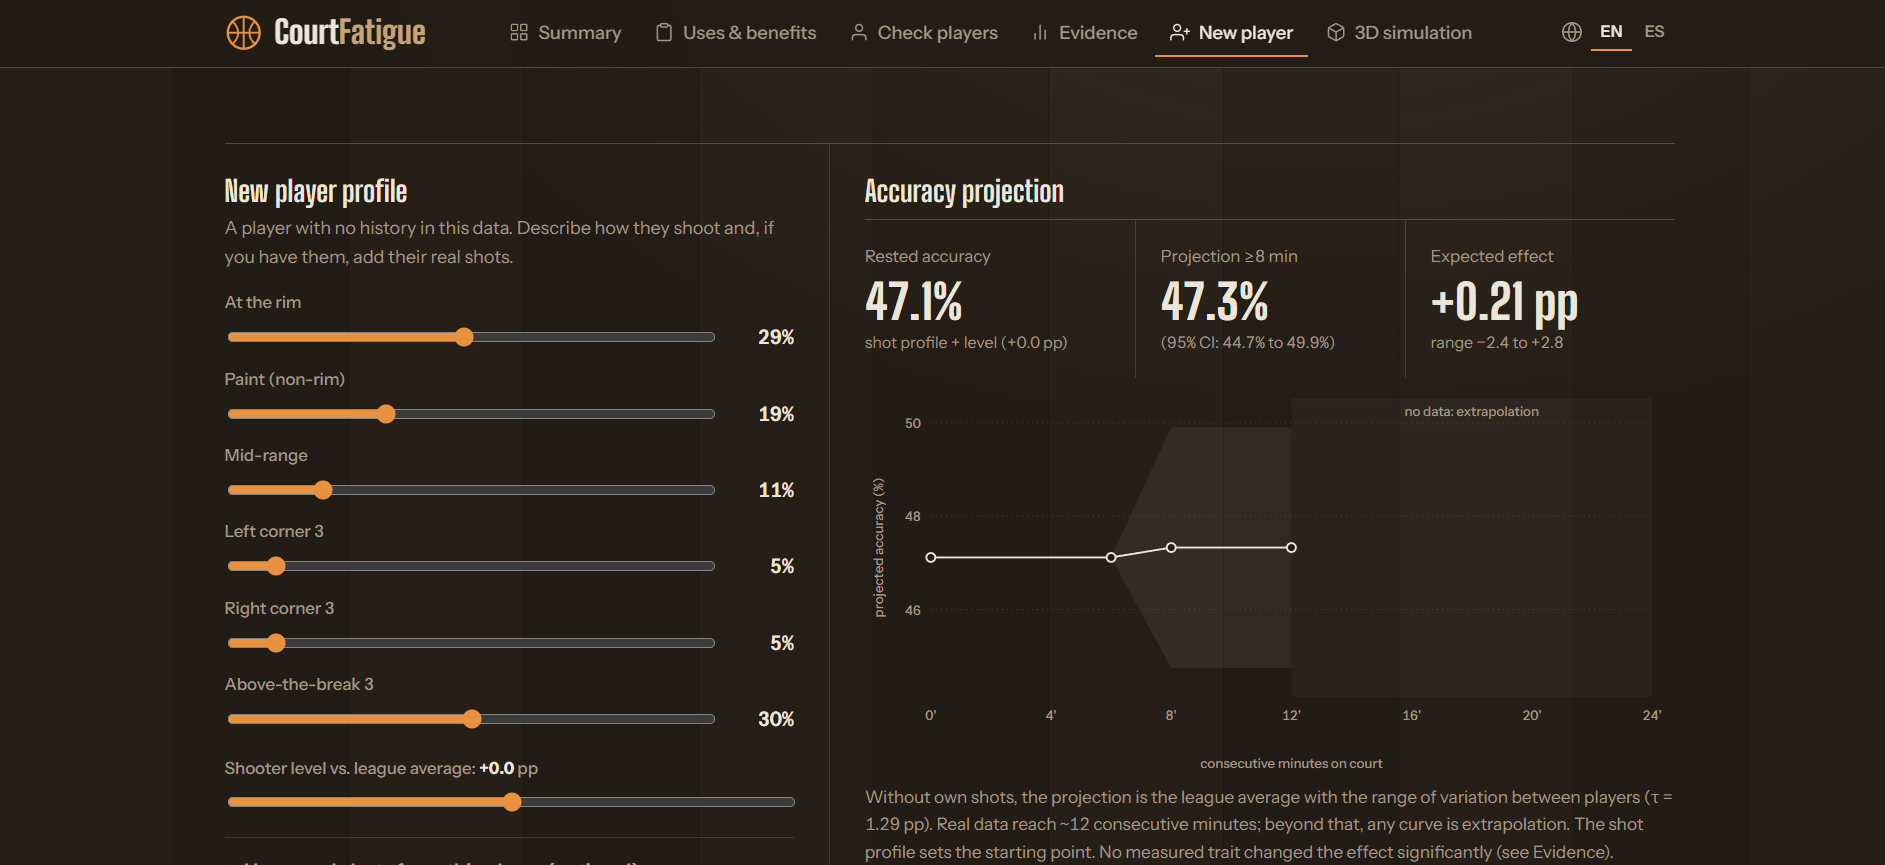
- New player: a projection for a player with no history, with its uncertainty.
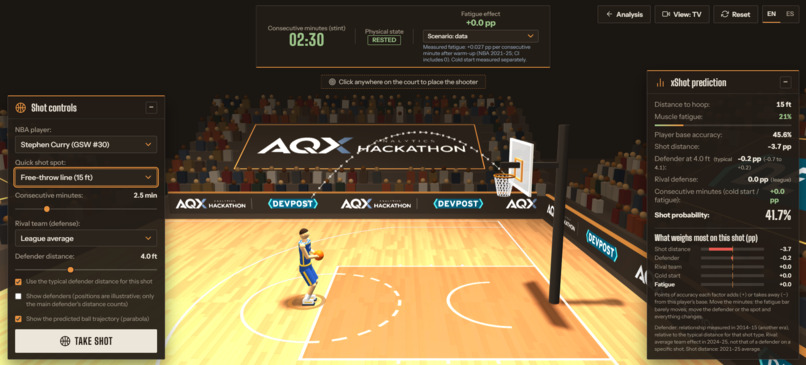
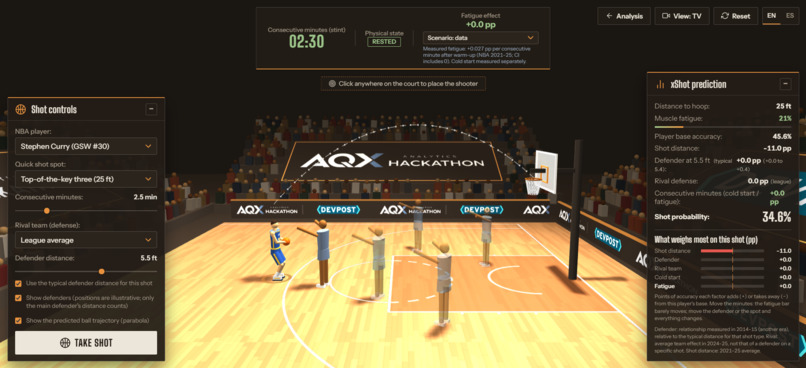
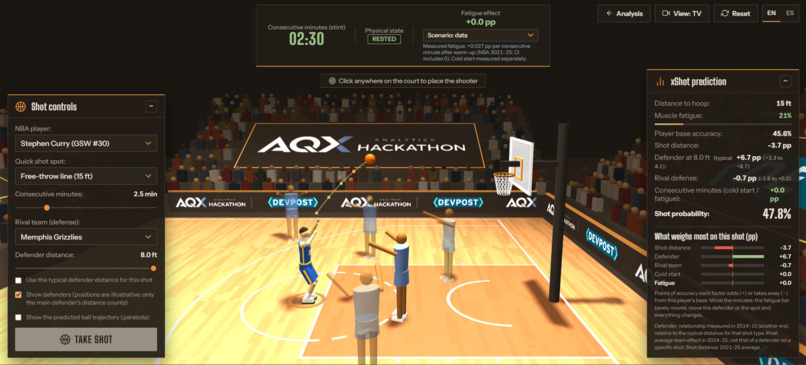
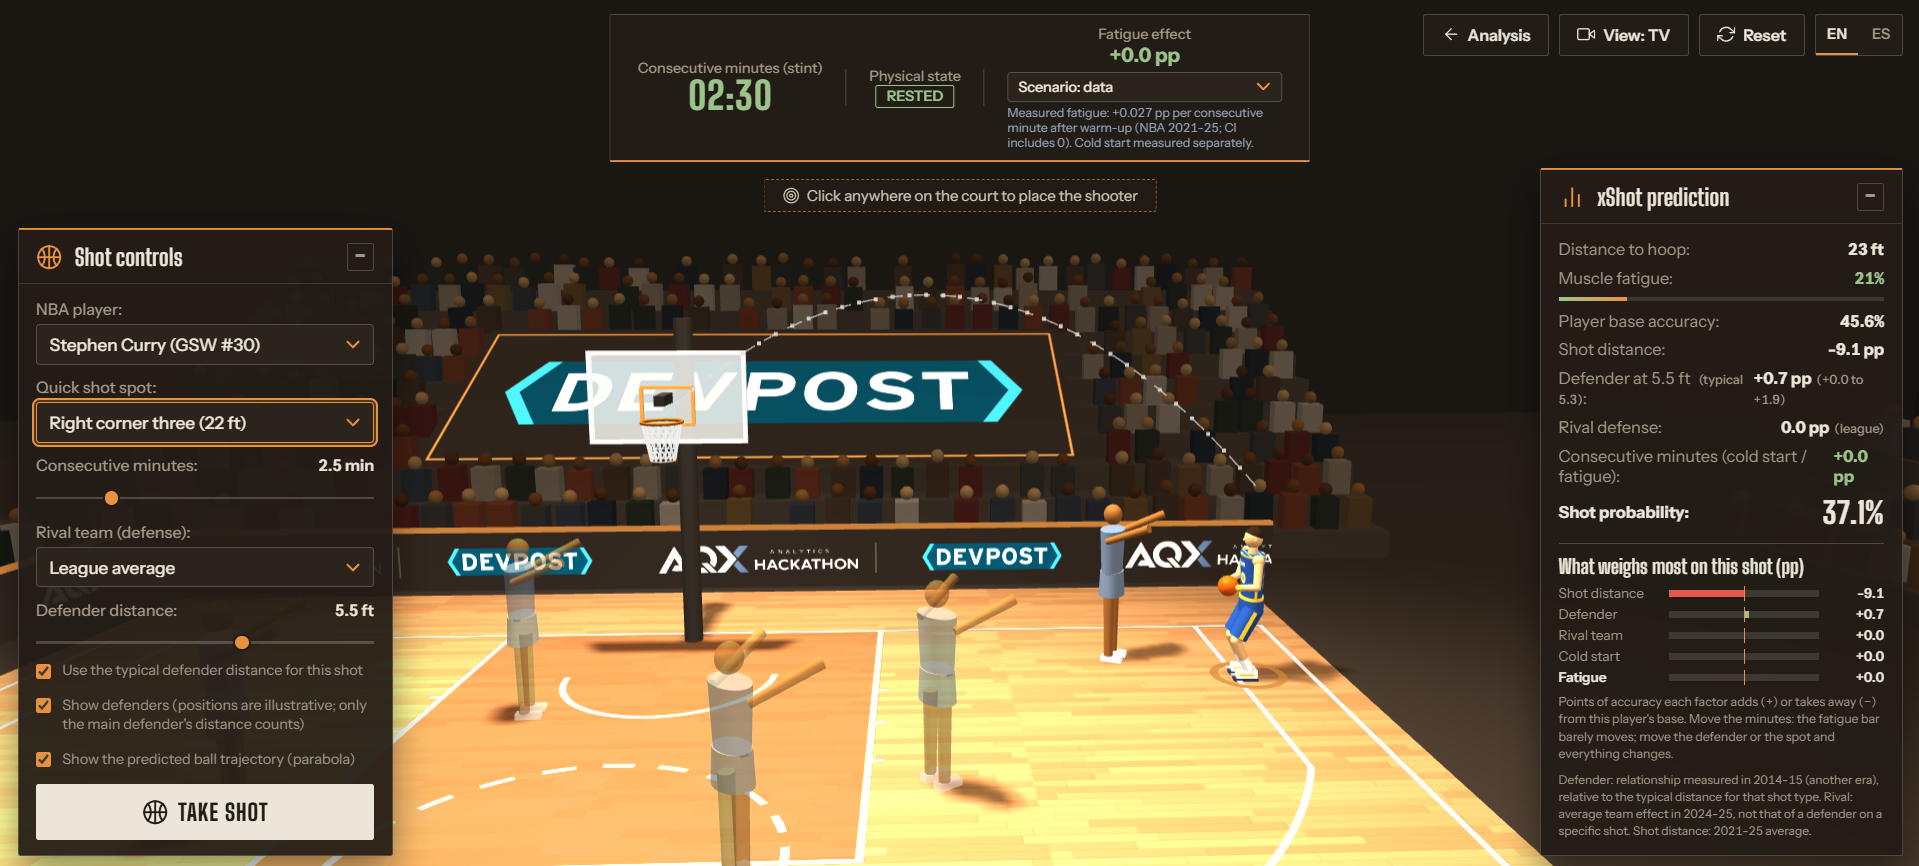
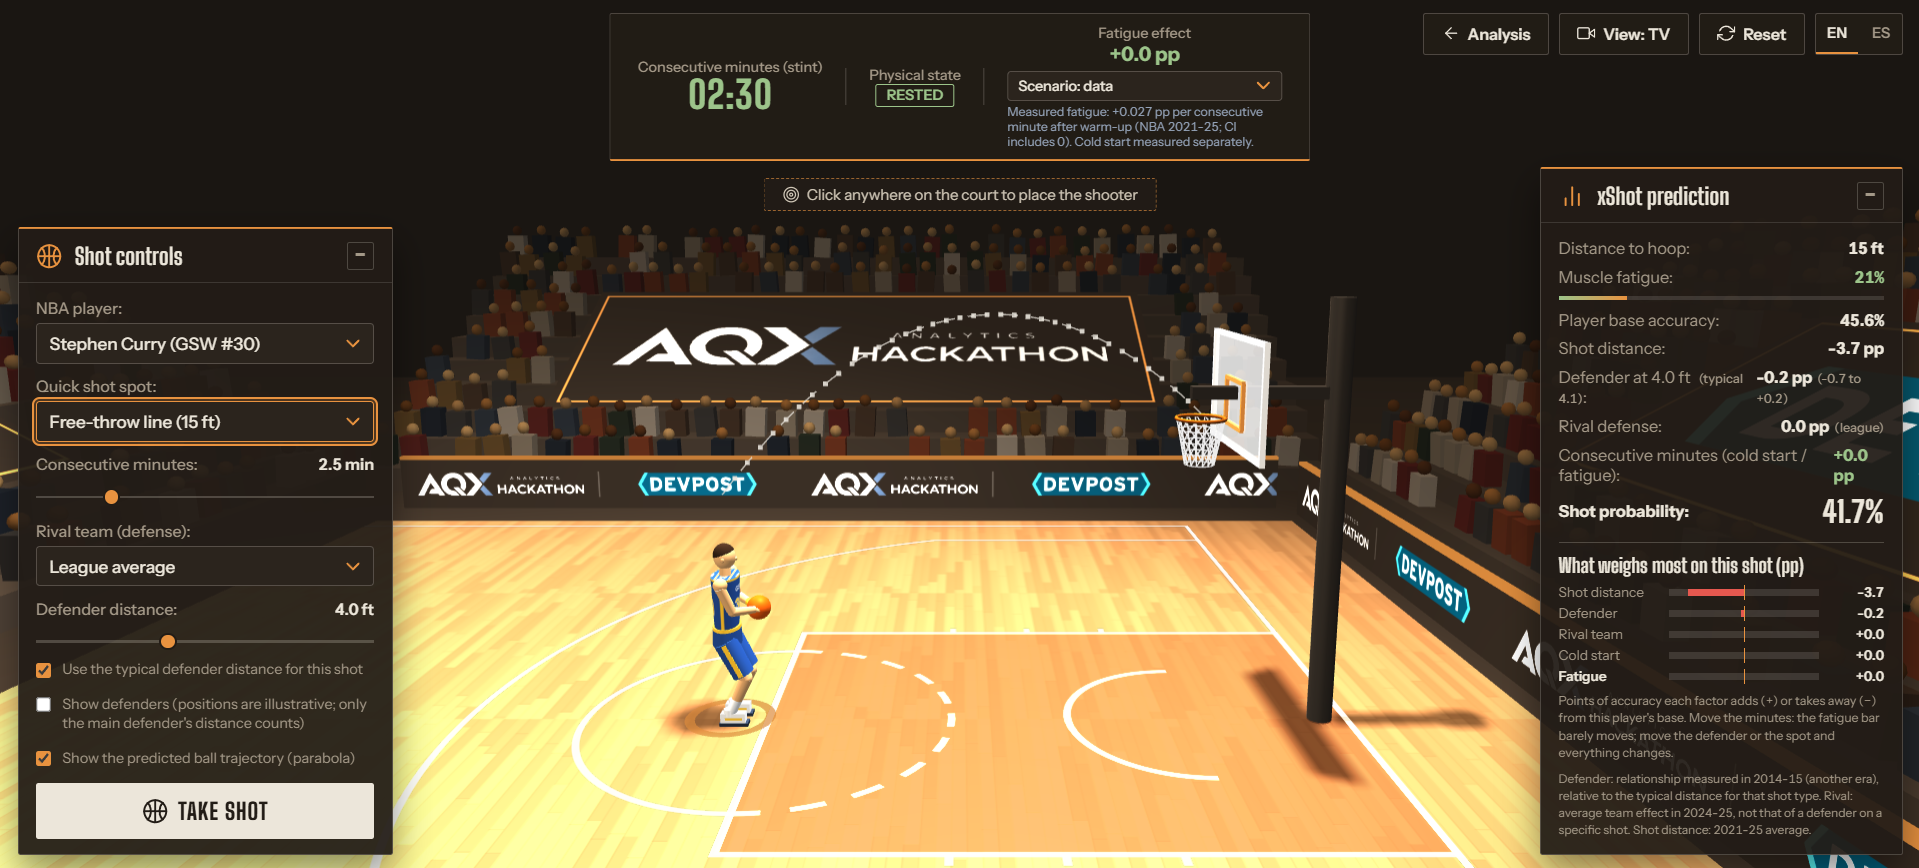
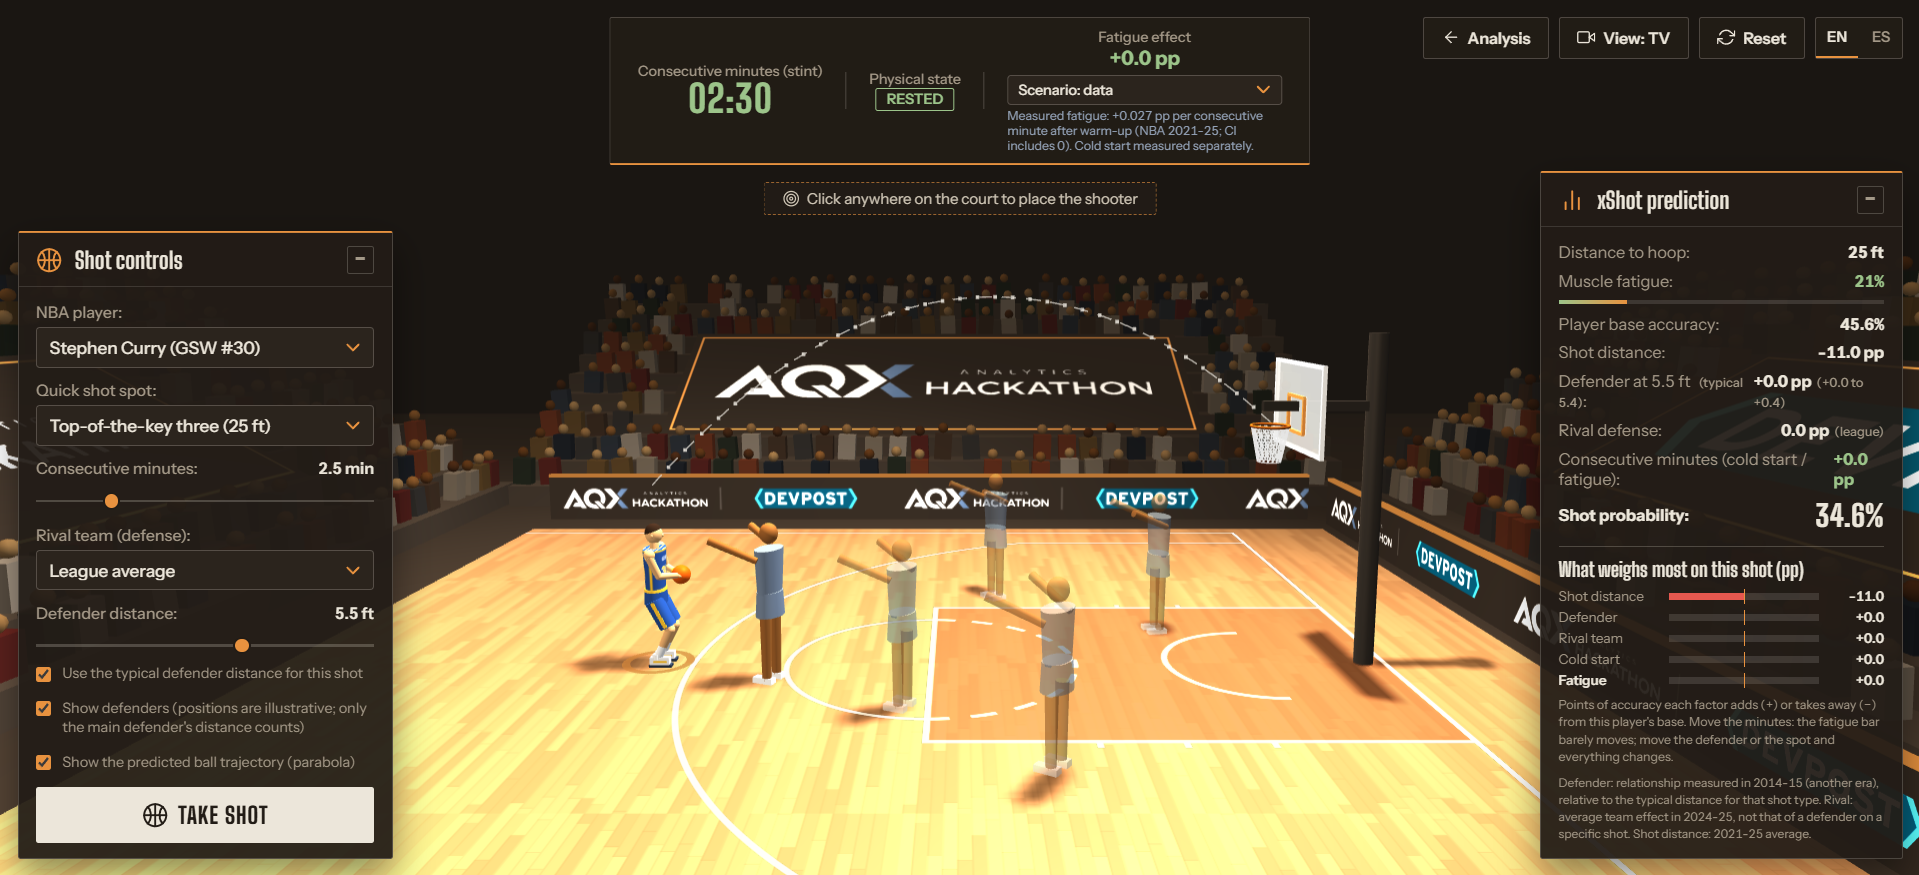
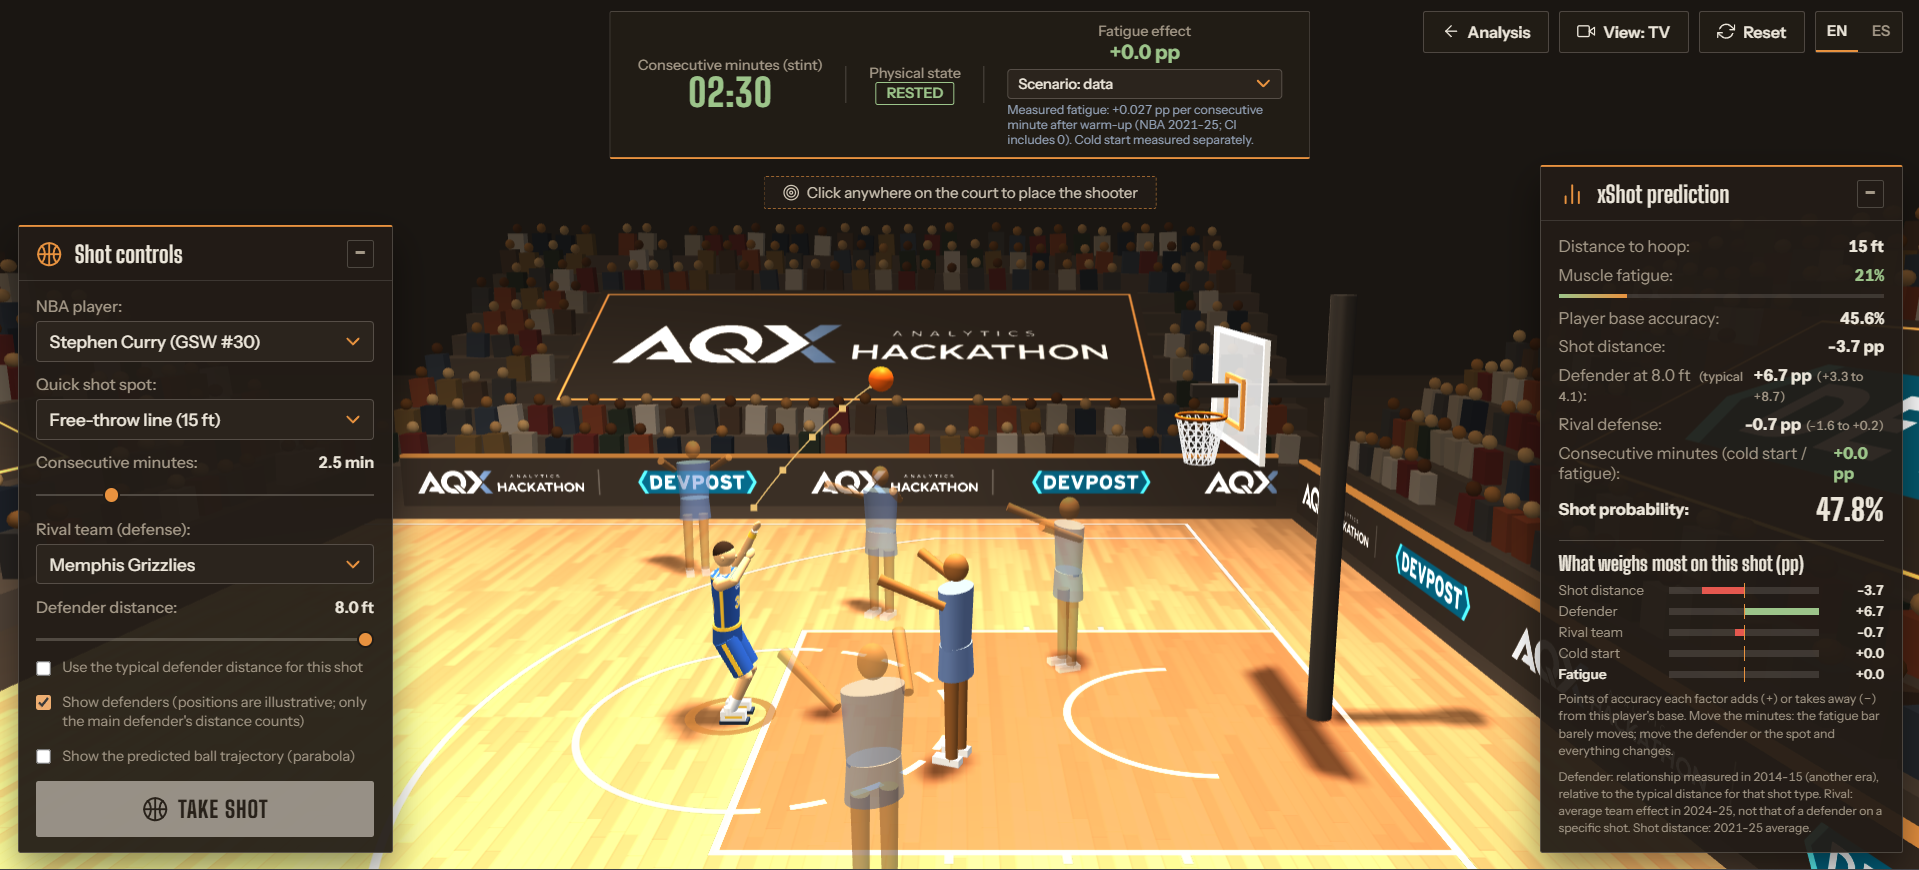
- 3D simulation: take a shot anywhere on the court and change the minutes, the rival team and the defender distance. Every term of the probability comes from measured data, and a panel shows what weighs most on that shot.
How we built it
Data. 4 NBA regular seasons (2021-22 to 2024-25): 4,920 games and 872,158 shots with coordinates, plus the play-by-play with substitutions. For the defender effect I used a separate public 2014-15 dataset (128,065 shots with defender distance, CC0).
1. Rebuilding minutes on court. The play-by-play logs substitutions but not who starts each quarter, so I reconstructed every player's stint: consecutive game-clock minutes on court at the moment of each shot. The counter carries over from Q1 to Q2 and from Q3 to Q4, and resets at halftime. Only ~0.3% of shots had an uncertain stint, and I excluded them.
2. Discounting shot difficulty (xShot). A gradient-boosting model predicts the probability of a make from distance, location, zone, shot type, period and clock, without minutes or player identity. It was validated by game (log-loss 0.640 vs. 0.691 with no model, AUC 0.657, calibration error 0.17 pp) and on an unseen season (AUC 0.654). Each shot gets a residual:
residual = made (1 or 0) − expected probability (xShot)
3. Comparing each player with himself, long stints against warmed-up ones:
Cⱼ = mean residual with ≥ 8 consecutive min − mean residual with 2–6 min
plus a league-wide slope with player fixed effects and player-clustered errors:
residual = player's own level + β × consecutive minutes β = +0.027 pp/min (95% CI −0.014 to +0.069)
4. Not inventing tired players. Individual contrasts are combined in a random-effects model (league mean μ, true spread between players τ, each player's standard error sⱼ), and each player is shrunk toward the league average:
shrunk Cⱼ = w × Cⱼ + (1 − w) × μ, where w = τ² / (τ² + sⱼ²)
A player is flagged only if his 95% CI excludes zero and he survives a Benjamini-Hochberg false-discovery correction. A placebo test, with minutes shuffled within each player, checks that the method stays silent when there is nothing to find.
5. The app. Python (pandas, NumPy, scikit-learn) for the analysis; a bilingual (EN/ES) web app in plain HTML, CSS and JavaScript with hand-made SVG charts; and a Three.js 3D simulator whose probability is
P(make) = player base + distance + defender + rival team + cold start − fatigue
Challenges we ran into
- Fatigue vs. warm-up. My first comparison (8+ min vs. under 4) gave +0.65 pp, as if players got better when tired. It was the cold start hiding inside the baseline. Using warmed-up players (2-6 min) as the reference fixed it.
- Missing substitutions between quarters. The play-by-play does not record who comes in during breaks, so I had to infer who was already on court in each period.
- Too little data per player. A player's typical standard error is ~5 pp, so the minimum detectable drop is about (1.96 + 0.84) × 5 ≈ 14 pp. Instead of hiding this, the tool shows it for every player.
- Selection bias. Coaches decide who stays on court, and observational data cannot remove that. I state it clearly: association, not causation.
- Mixing eras. The defender-distance data comes from 2014-15, so the simulator labels it as an association measured in another era, relative to the typical defender distance for each shot type, so it is not double-counted.
Accomplishments that we're proud of
- Turning a "null" result into a useful one: the effect is pinned down (+0.21 pp after 8+ minutes, 95% CI −0.13 to +0.56), not just "not significant".
- Finding something nobody asked about: a cold start of −1.46 pp in the first 30 seconds, negative in all four seasons.
- Showing that a common coaching rule is noise: "bench him if he drops 3 points" flags 60.5% of players with real data and 59.4% with random minutes. Our method flags 0% and 0.04%.
- 0 of 592 players labelled "the one who gets tired". The tool says what it can and cannot tell instead of inventing a number.
- Full reproducibility: re-running the pipeline from a clean copy of the repo, following the README, gives exactly the same results.
- A 3D simulator built from data, not hand-written formulas.
What we learned
- A result that looks like fatigue is often just noise. Without a placebo test and a multiple-comparison correction, you will always find "tired" players.
- The baseline matters as much as the model. Choosing the wrong reference turned a cold start into a fake "fatigue benefit".
- Honesty is a feature. Saying "we can only detect drops of ~14 pp for this player" is more useful to a coach than a confident number.
- The old saying isn't exactly wrong, it's incomplete: the players coaches keep on the floor don't shoot worse, which suggests current rotations already avoid the problem. The risk is not when a player leaves, but how he comes in.
What's next for CourtFatigue
- Player-tracking data for recent seasons, so defender distance can enter the main model instead of coming from another era.
- Physical load: minutes over previous games, travel and rest days, and biometrics where available.
- Beyond shooting: does fatigue show up in defense, rebounding or turnovers?
- Injuries: cross consecutive minutes and back-to-backs with public injury reports.
- Validating the cold start with video and testing whether a "rhythm first play" after a substitution reduces it.

Log in or sign up for Devpost to join the conversation.