Inspiration
We started with a question about India and China: how do countries develop so differently, and what role might culture play?
The more we discussed it, the harder it became to separate culture from income, demographics, institutions, and historical circumstances. We wanted a way to explore those differences without reducing a country to its GDP or making assumptions about the people who live there.
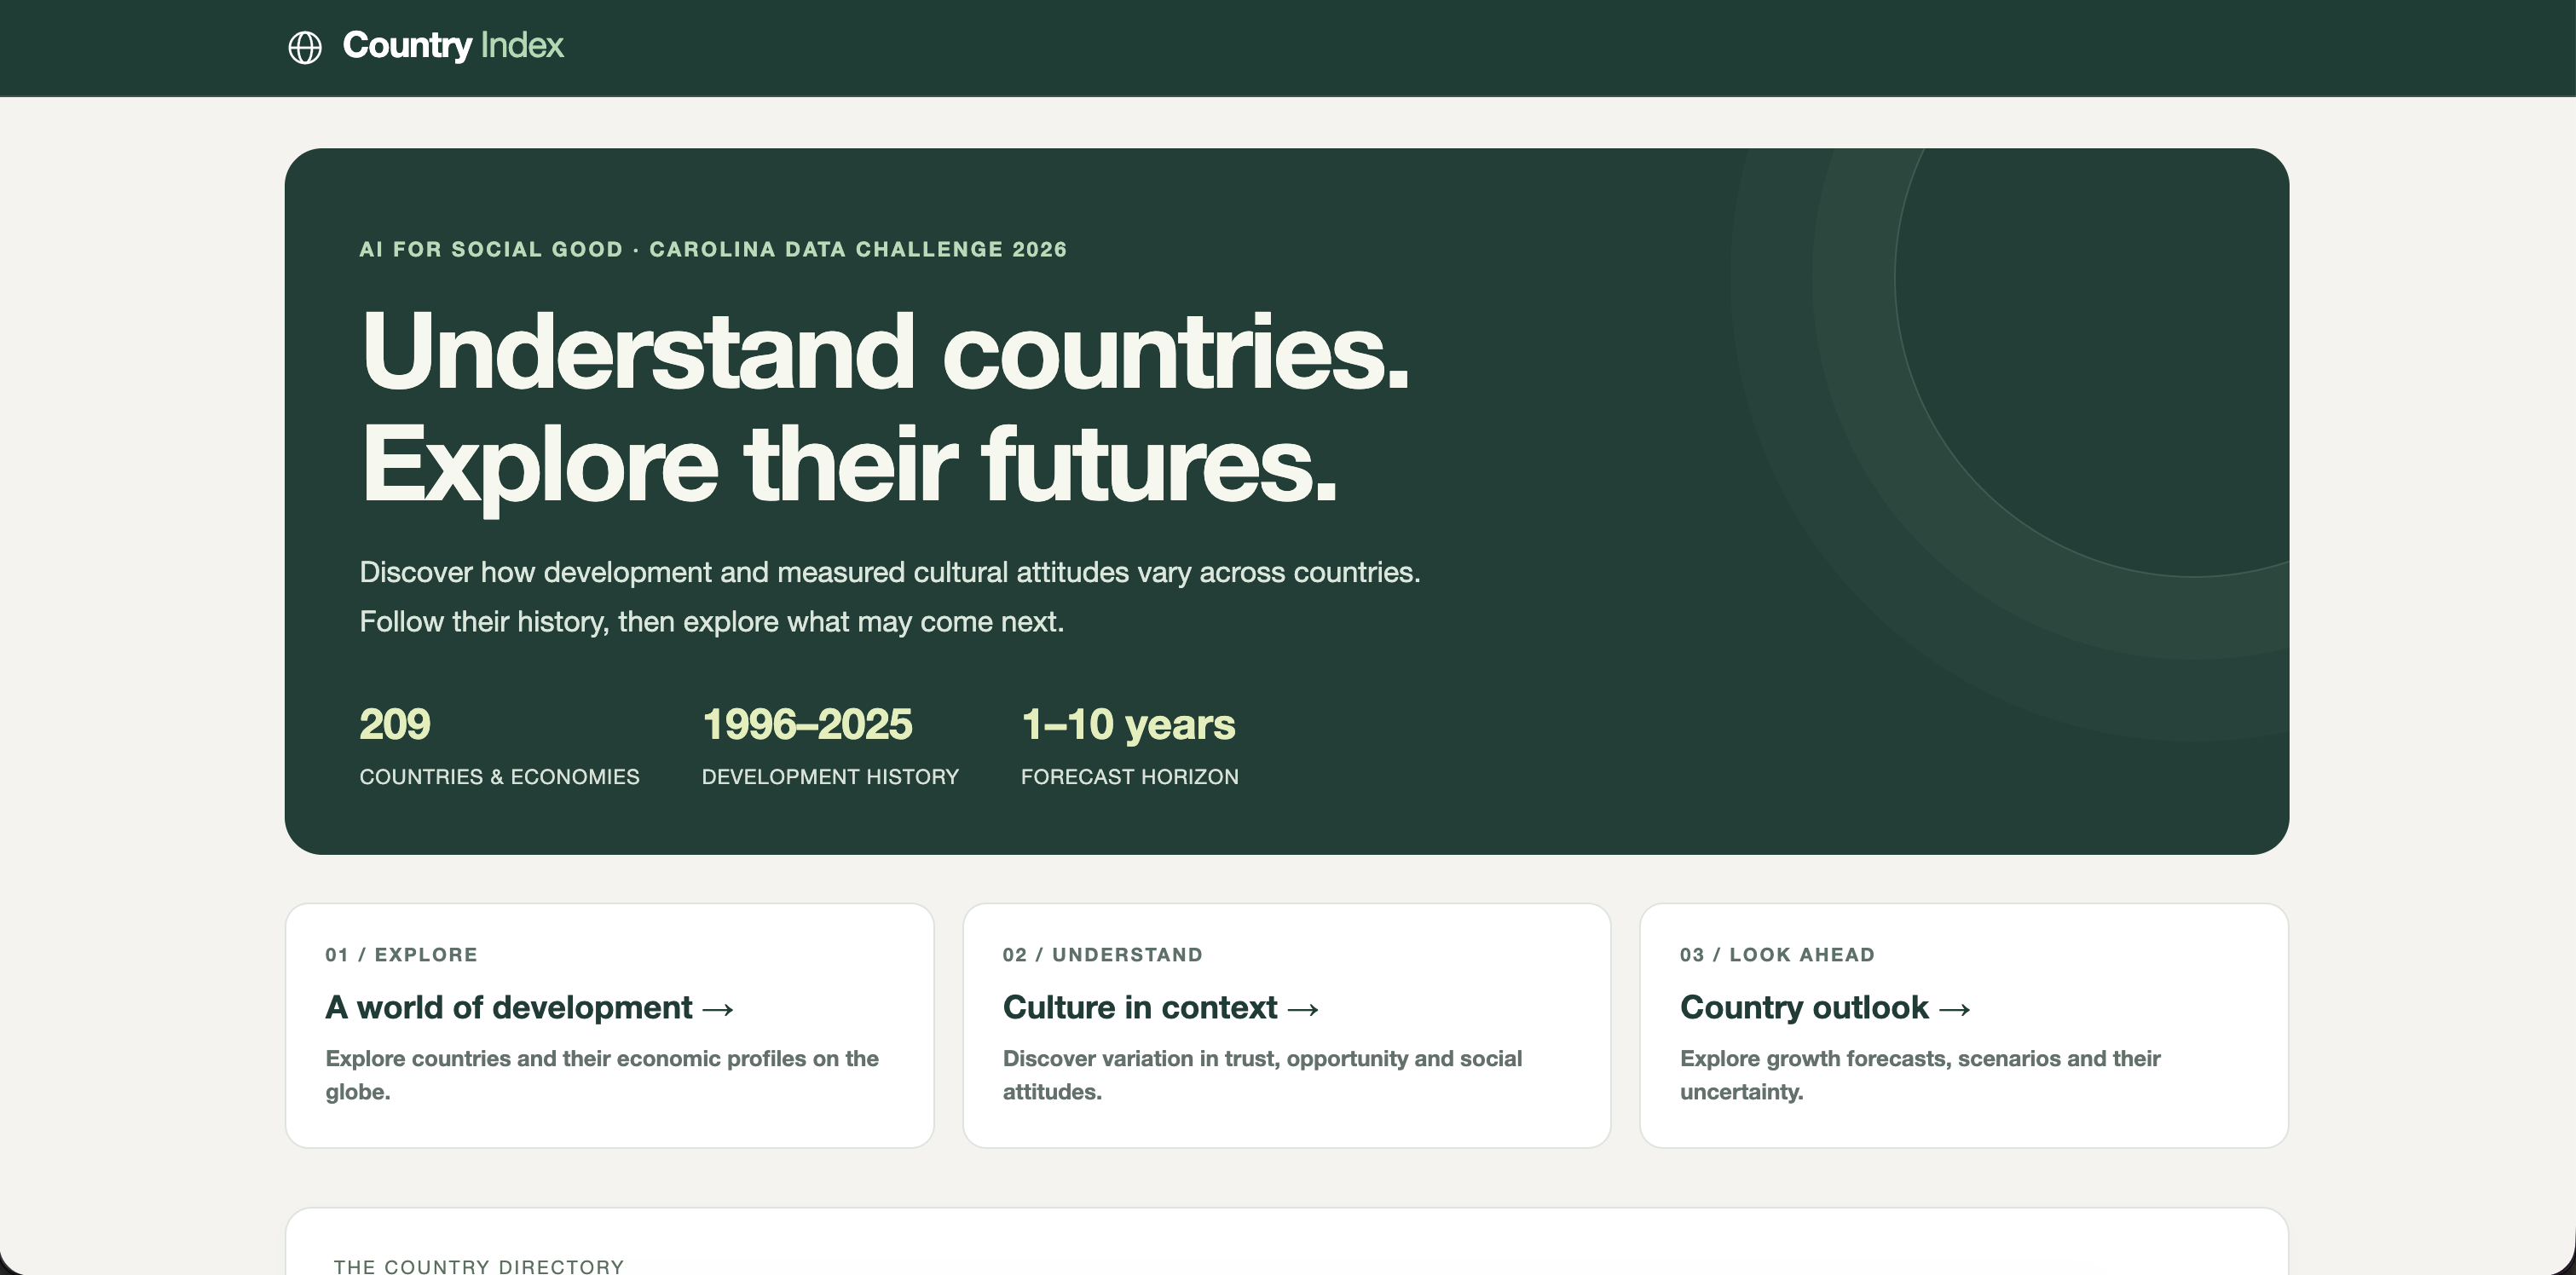
That became Country Index: a website where you can look up a country, explore its development and survey responses, and get an estimate of future economic growth.
What it does
Country Index brings together World Bank development indicators and cultural attitudes measured by the World Values Survey.
Users can:
- Search for a country and explore its economic and demographic profile.
- Browse a globe showing countries with similar development profiles.
- Examine survey responses about trust, gender equality, and qualities people value in children.
- Explore how those attitudes vary within development groups.
- Forecast GDP per person over one to ten years.
- Change assumptions such as fertility or school enrollment and see how the model’s prediction responds.
We show survey dates, historical prediction errors, and missing-data limitations alongside the results. Scenario outputs describe how the model responds to different conditions. They do not establish what passing a particular policy would cause.
How we built it
We retrieved development data programmatically through the World Bank Indicators API, covering 18 indicators across an annual panel from 1996 to 2025. The country directory includes 209 countries and economies.
We supplemented that with the World Values Survey, calculating six survey-weighted attitude measures. Survey coverage is smaller than the World Bank coverage, so we kept those differences visible.
Our clustering analysis groups countries by economic and institutional characteristics. We then examine cultural attitudes within those groups. Keeping the attitude responses outside the clustering lets us investigate their relationship to development profiles.
For forecasting, we built a separate pipeline that uses earlier observations to predict later GDP-per-person growth. We compared Extra Trees regression, Ridge regression, and a baseline that continues recent growth. We also tested versions with cultural survey inputs where historical coverage allowed.
We built the analysis in Python and the interface with HTML, CSS, JavaScript, and Plotly.
What we learned
One of our clearest findings was how much cultural variation remained within development groups. In our default Wave 7 analysis of 64 countries, 55.9–72.4% of the variation in the six attitudes remained within groups. A country’s development group leaves a lot of its survey responses unexplained.
We also learned that adding more data does not automatically improve a forecast. Cultural survey inputs did not improve validation enough to win model selection in our current tests. That does not mean culture is unimportant. It means we did not demonstrate additional predictive value with these measures and their available historical coverage.
In our five-year historical test, 72.4% of 185 country forecasts were within 10% of actual GDP per person, with an average absolute percentage error of 9.4%. Those results describe one historical test period, not confidence in every future prediction.
Challenges we faced
Aligning the data. Economic indicators are annual, while surveys happen in different years across countries. We had to preserve interview dates and distinguish observed values from filled gaps.
Preventing future information from entering forecasts. Data preparation suitable for exploring a historical dataset can accidentally expose a forecasting model to later information. We built a separate forecasting pipeline and separated training and evaluation by time.
Making the analysis understandable. We initially had a collection of graphs. Turning them into a country directory with summaries, related profiles, and an outlook made the project easier to navigate.
Knowing what we could claim. Predicting growth and estimating a policy’s effect are different tasks. We kept that distinction visible rather than presenting scenario estimates as policy recommendations.
What’s next
We want to evaluate forecasts across more historical periods, improve uncertainty estimates, and get feedback from students and development researchers. We also want to expand historical survey coverage so we can better test when cultural measures add useful information.
Sources and AI assistance
- World Bank Indicators API
- World Values Survey time-series v5.0 — Haerpfer et al., 2024
- Scikit-learn for modeling and evaluation
- OpenAI Codex assisted with code, methodological choices, interpretation, interface development, and presentation writing. We document that assistance in the repository’s
AI_USAGE.md.
Built With
- css
- github
- html
- javascript
- numpy
- openai
- pandas
- plotly
- python
- scikit-learn
- scipy
- world-bank-api
- world-values-survey

Log in or sign up for Devpost to join the conversation.