-
-

Project-Infographics
-
Backend
-

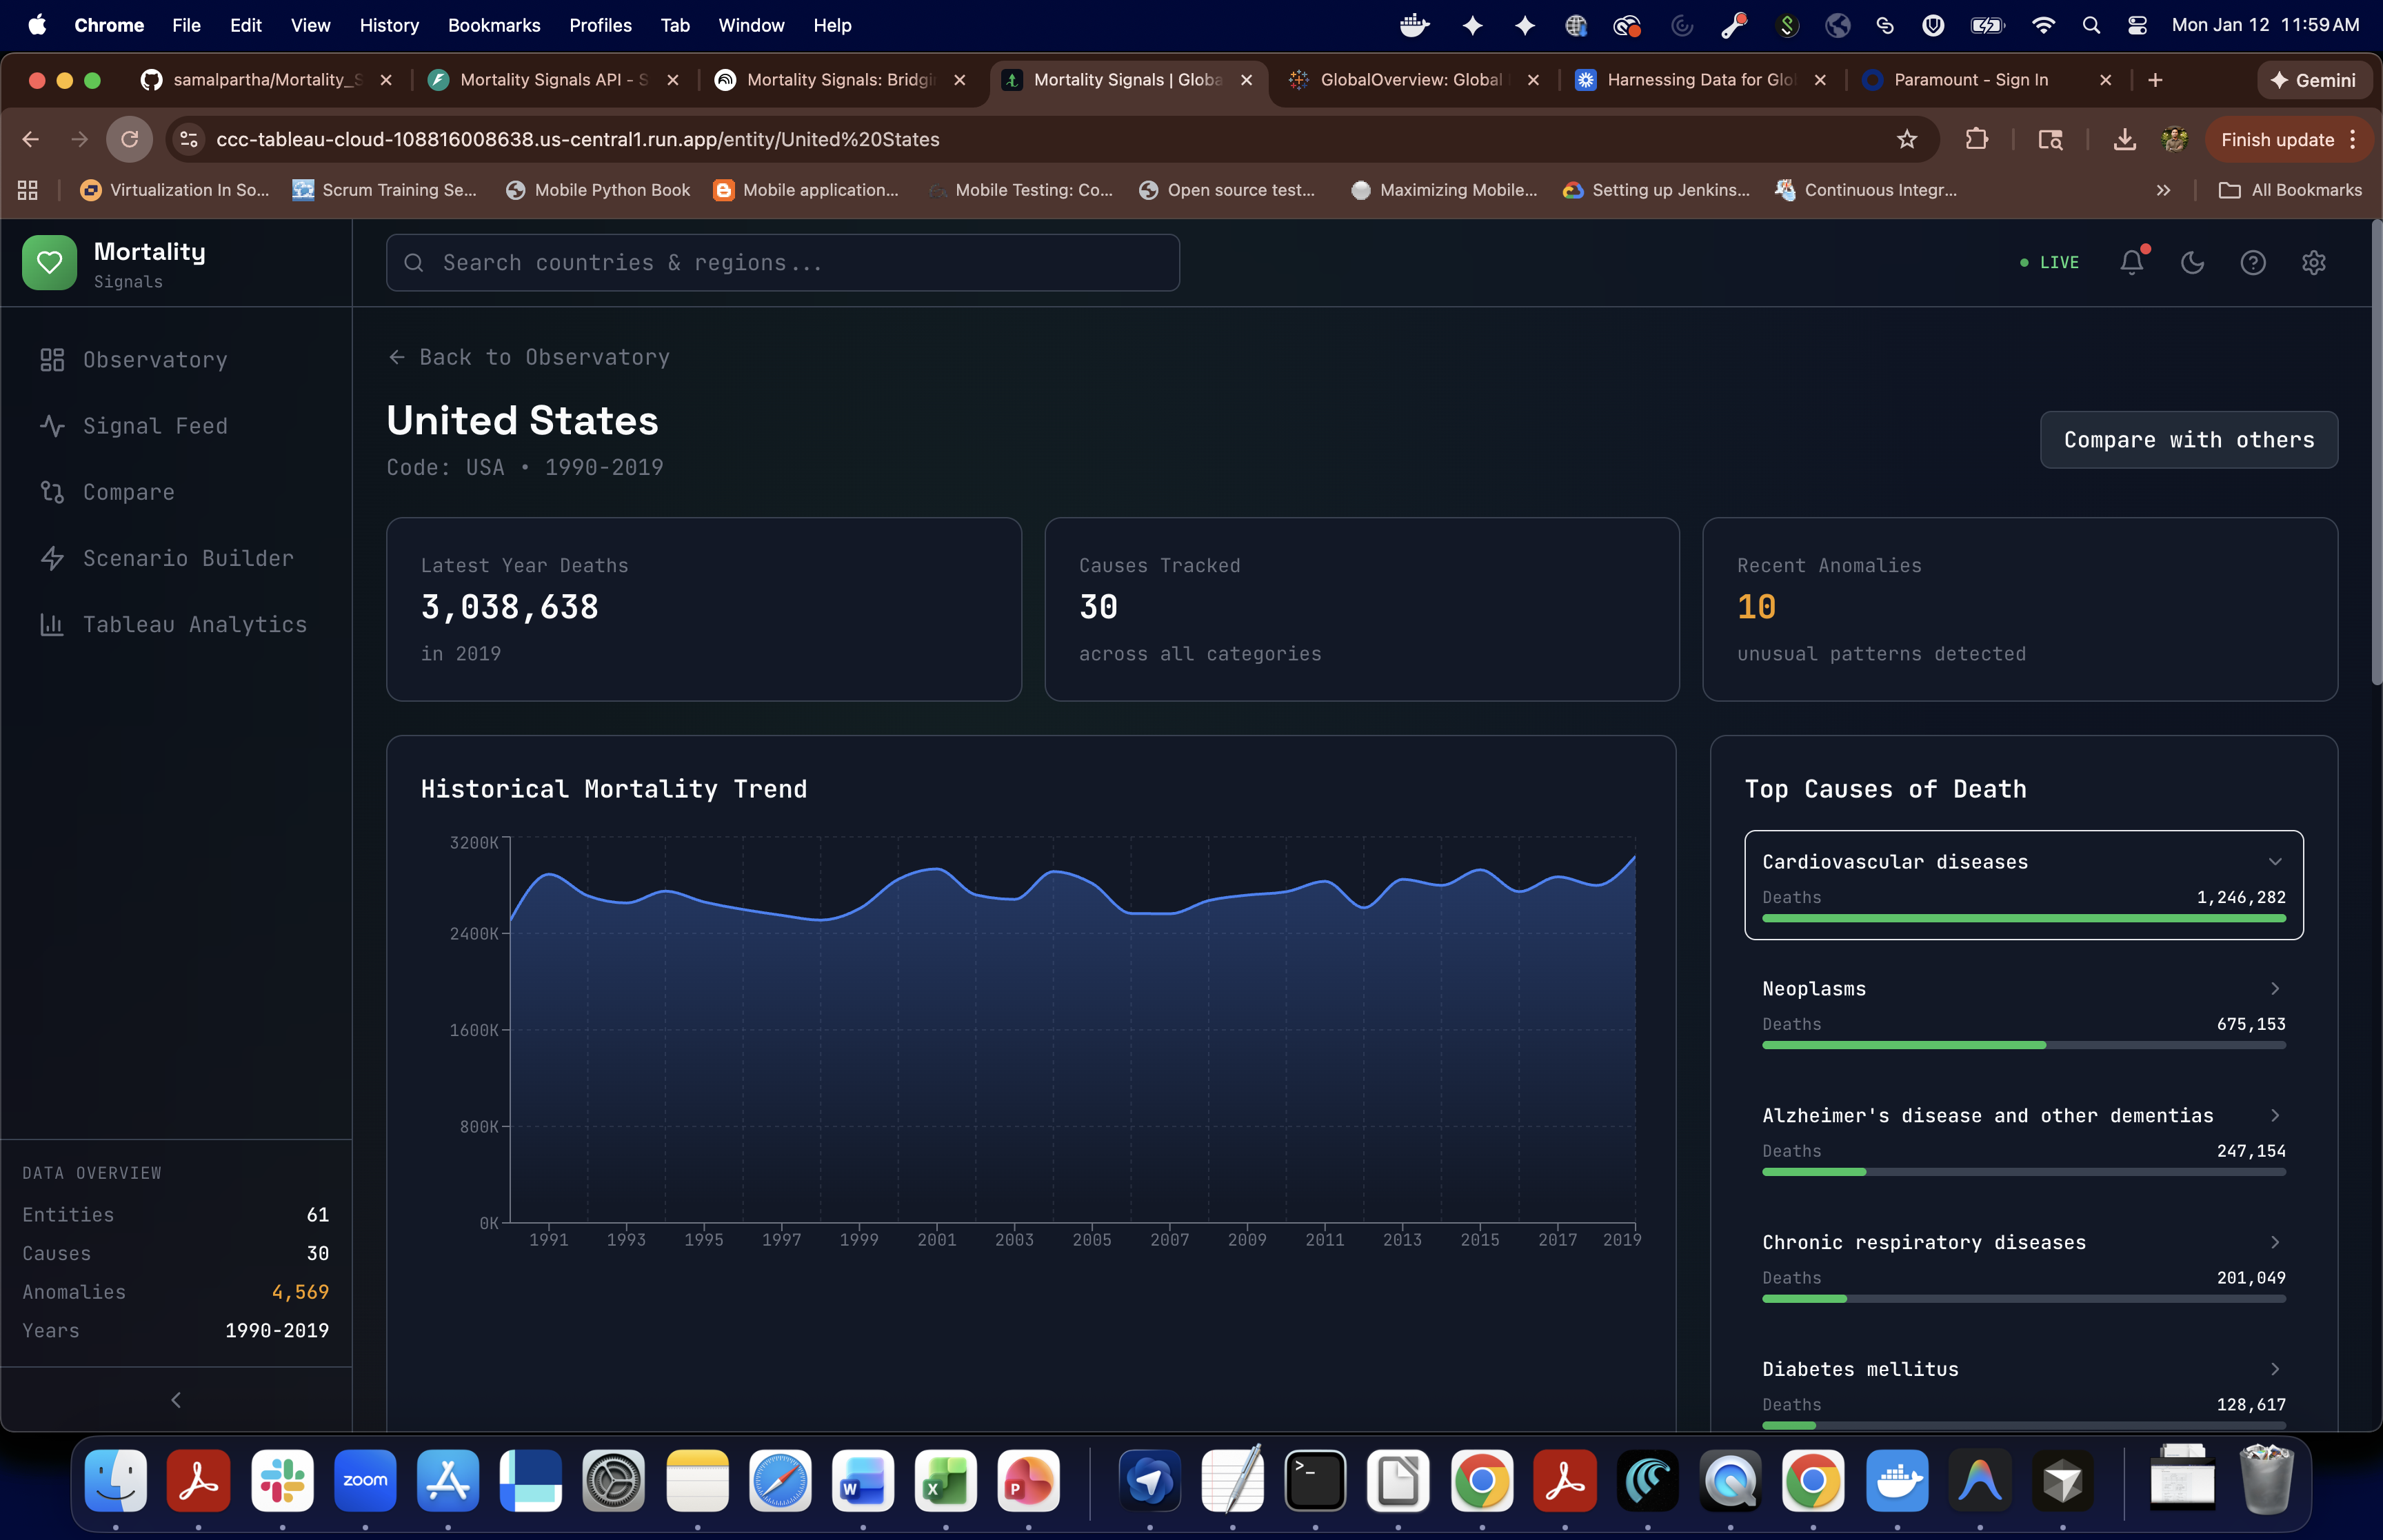
Observatory
-
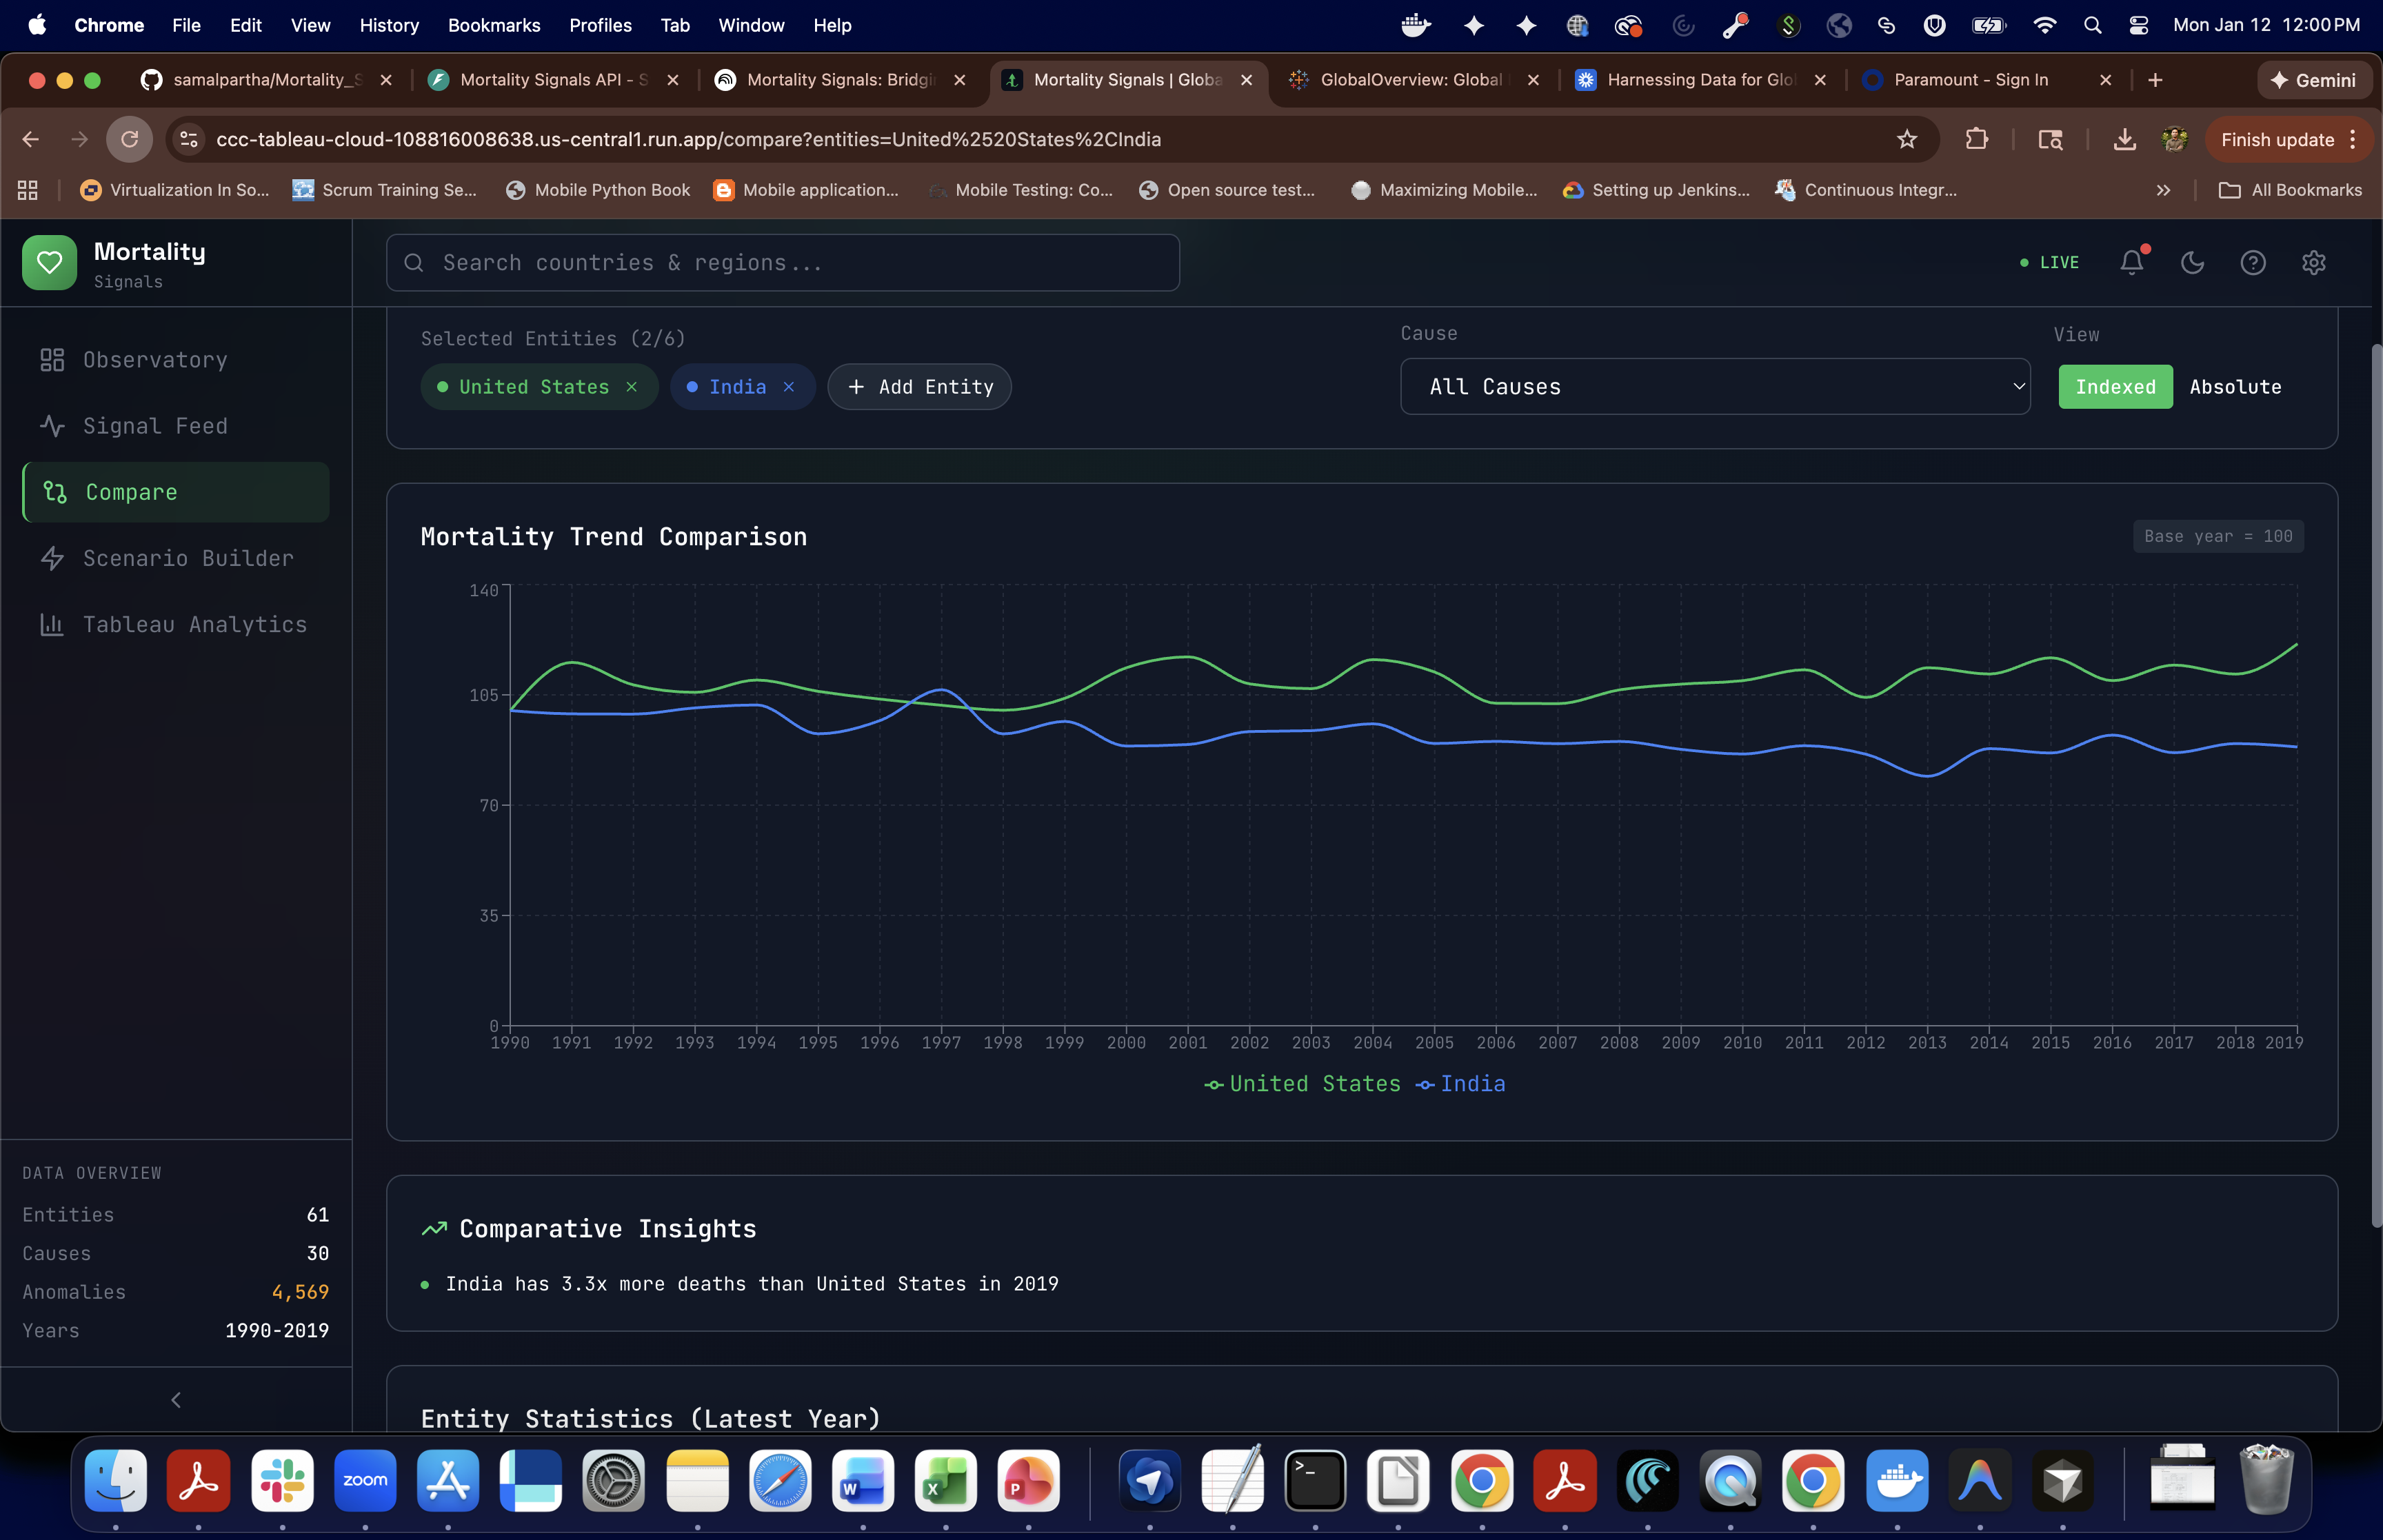
Compare Entities
-

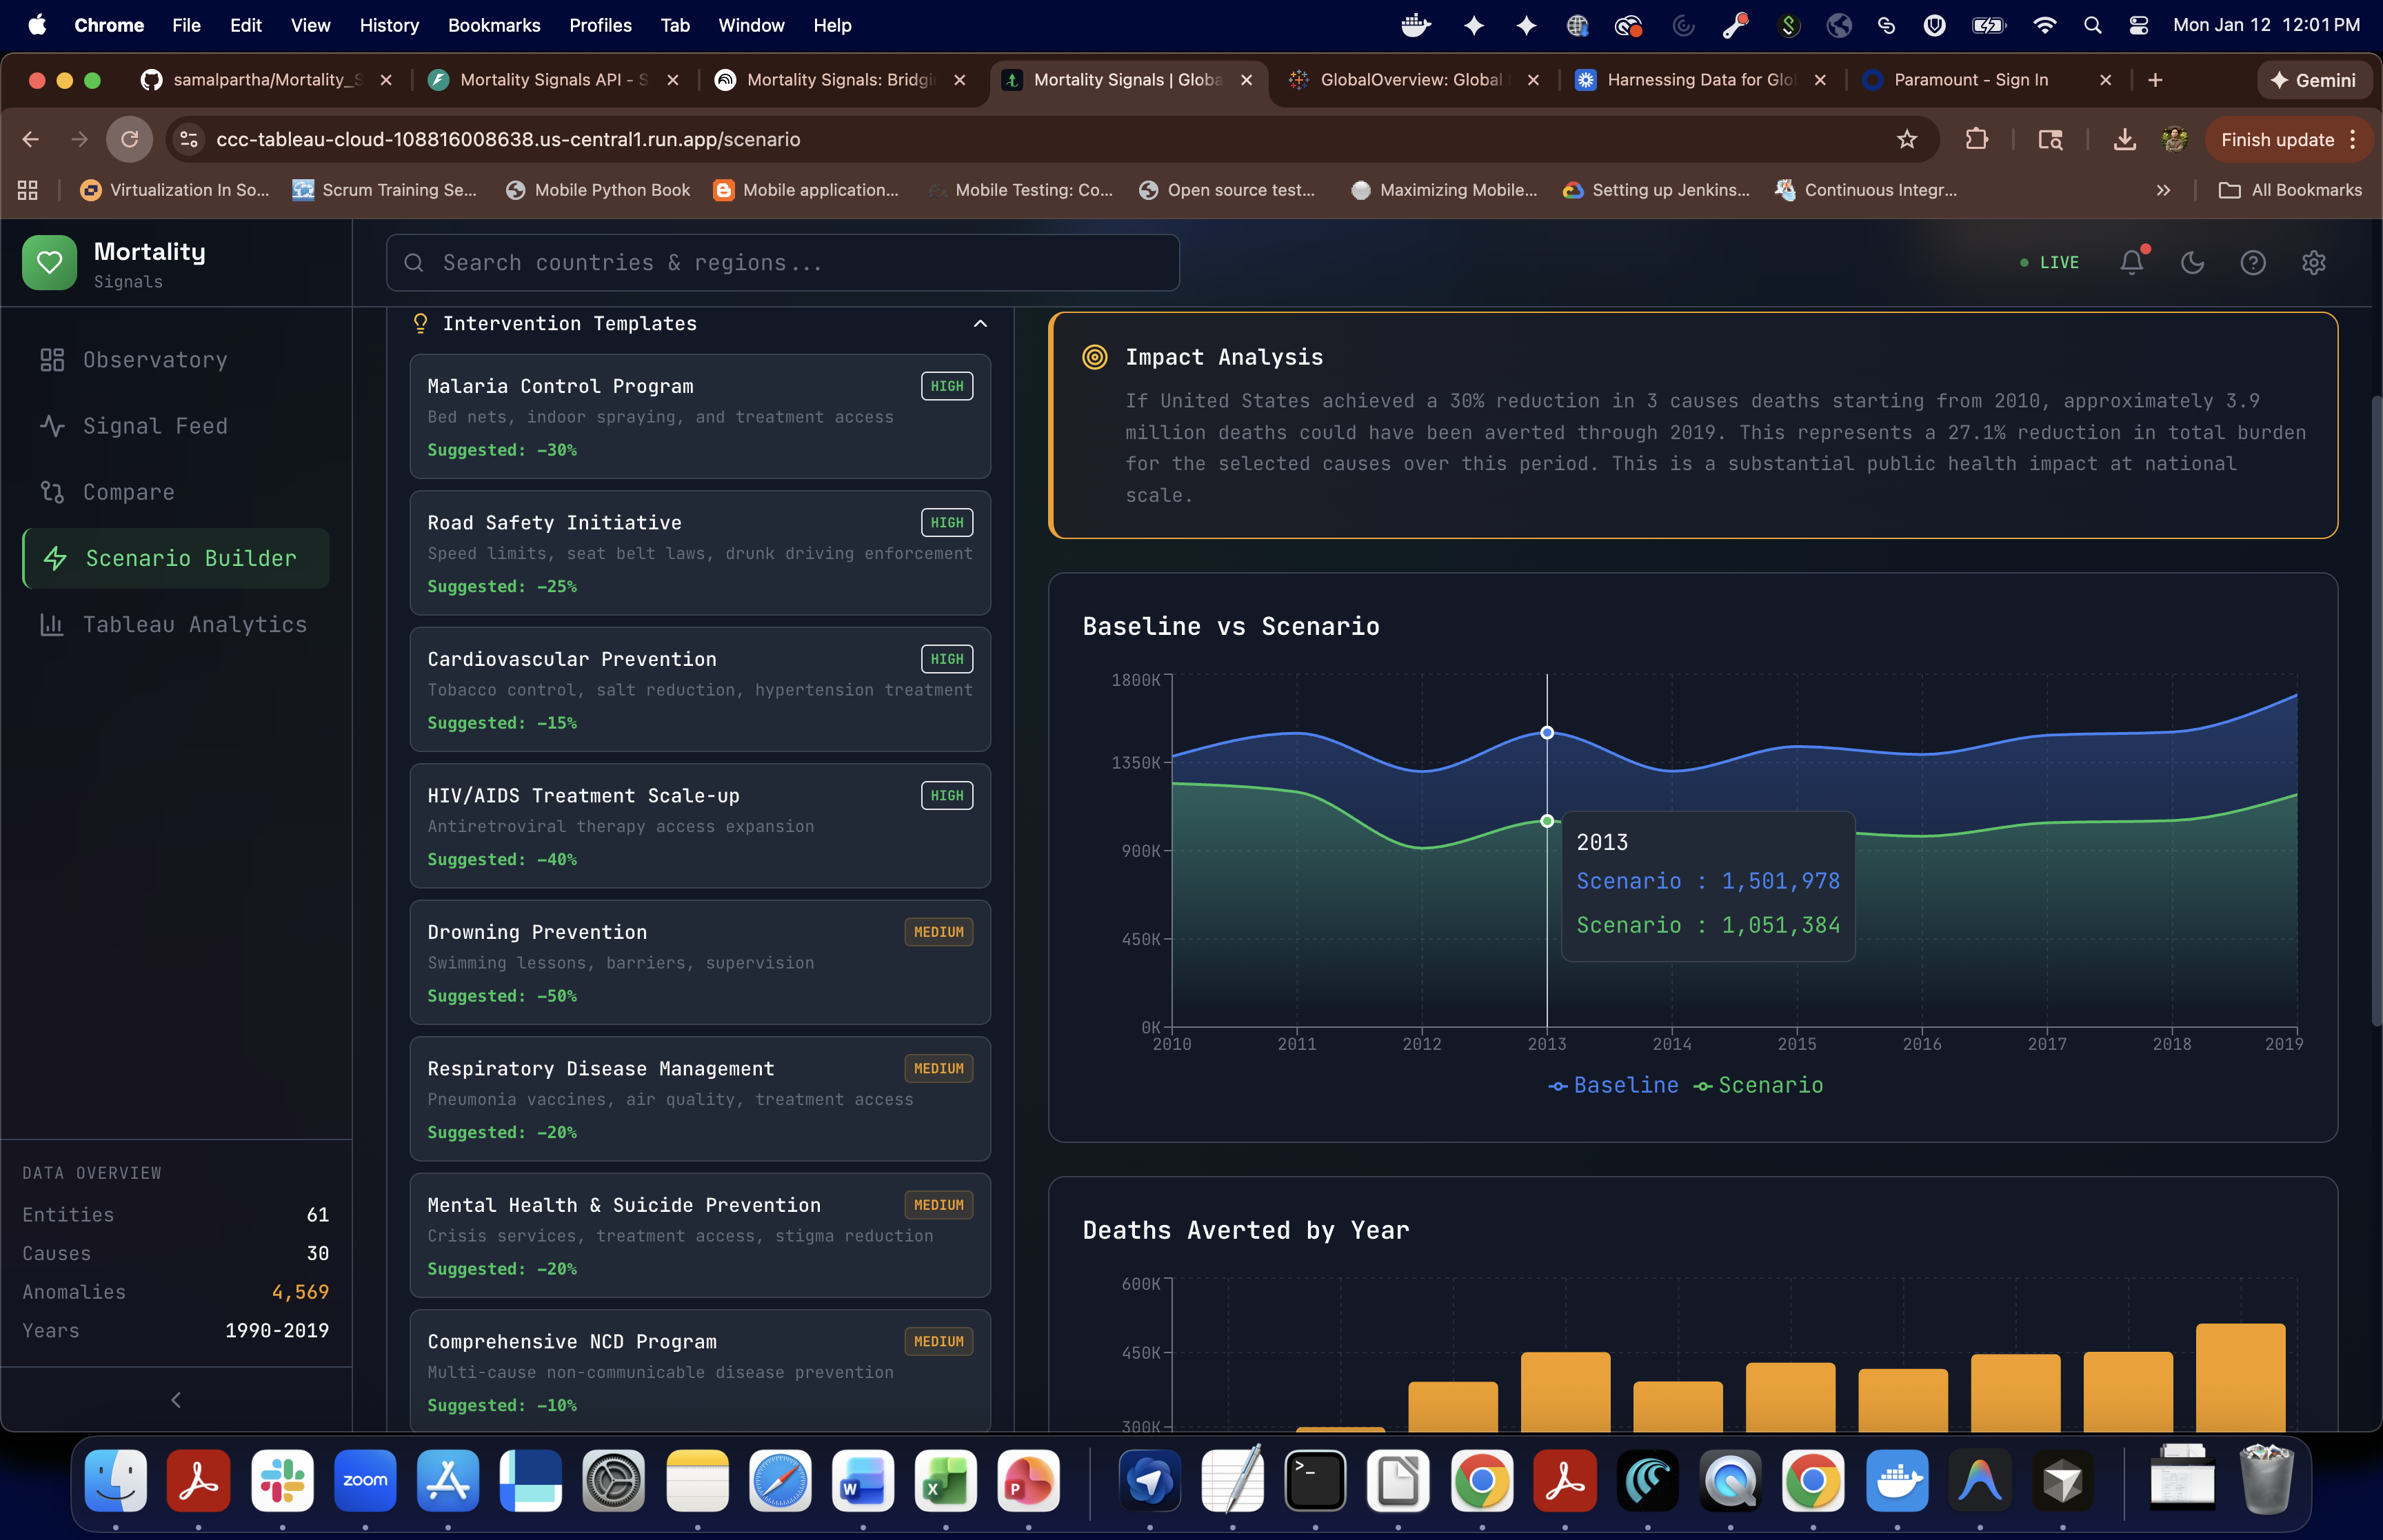
Scenario Builder
-
Signal-Feed
-

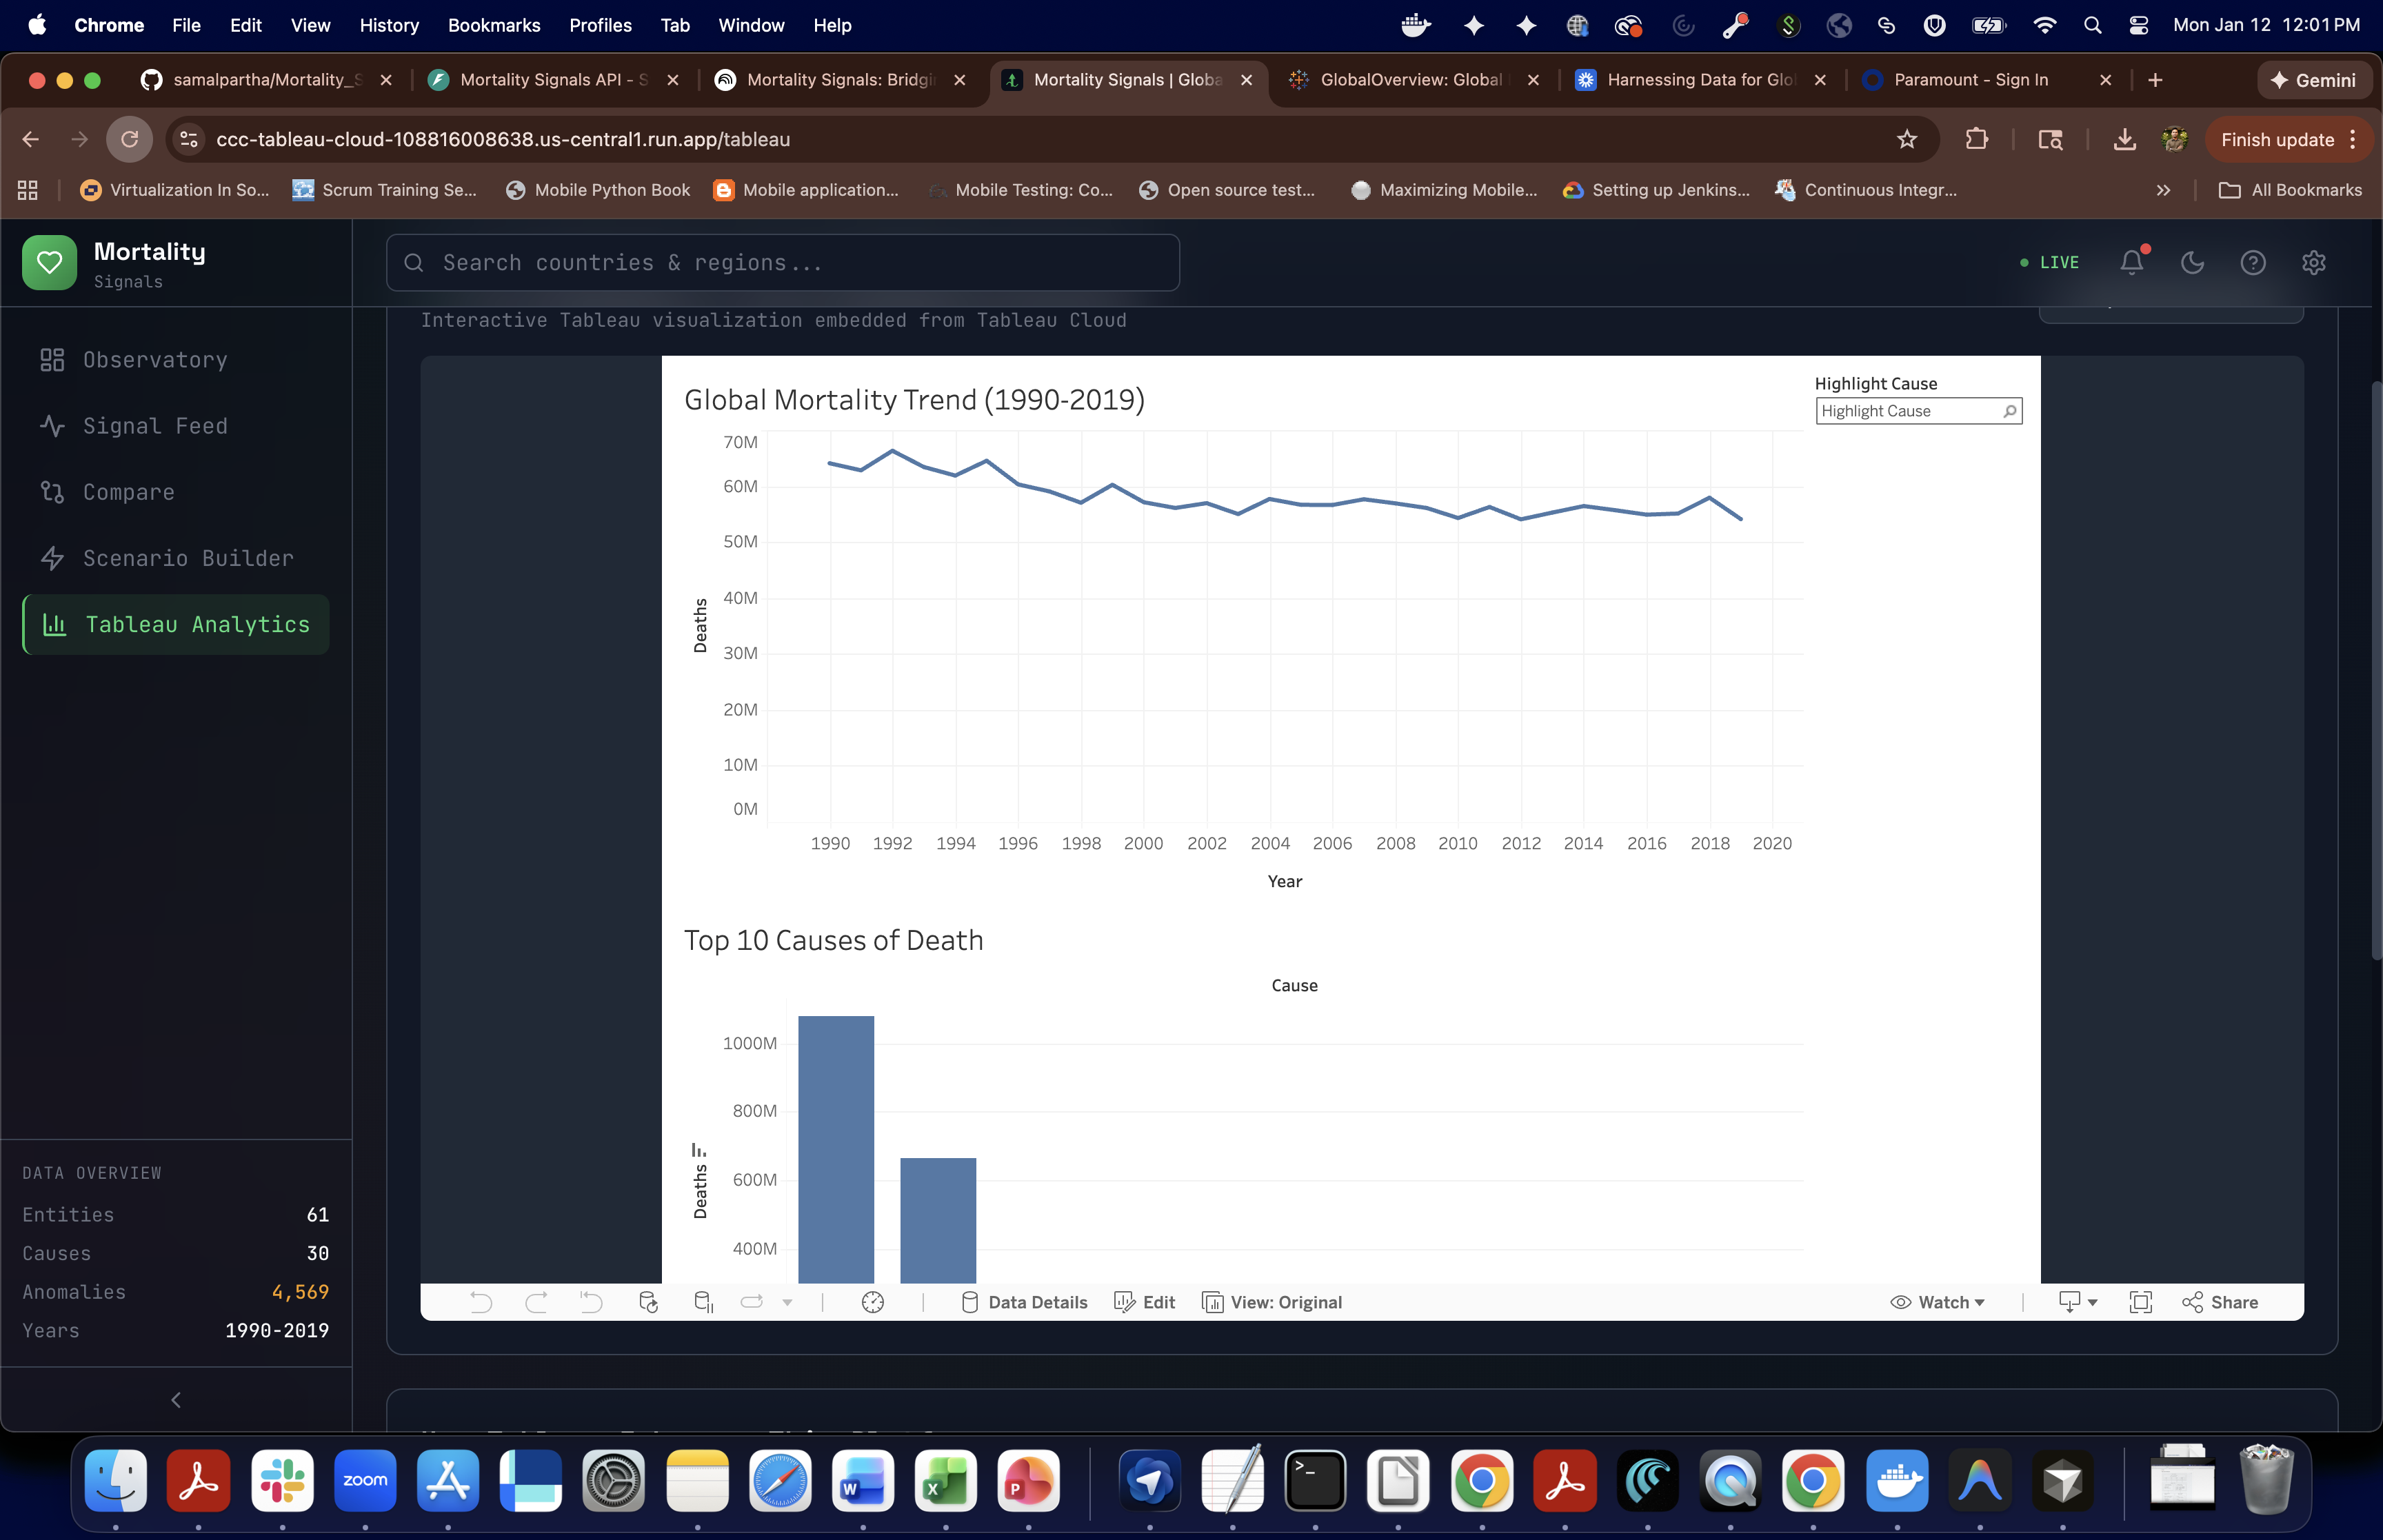
Tableau analytics-1
-
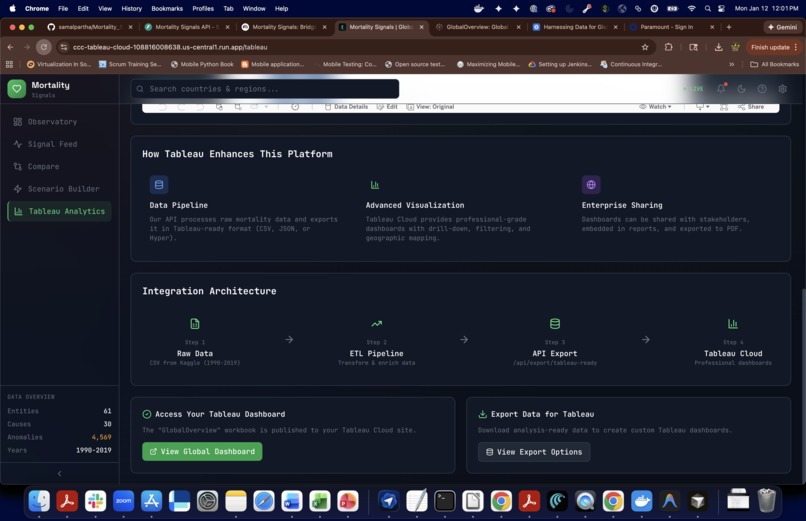
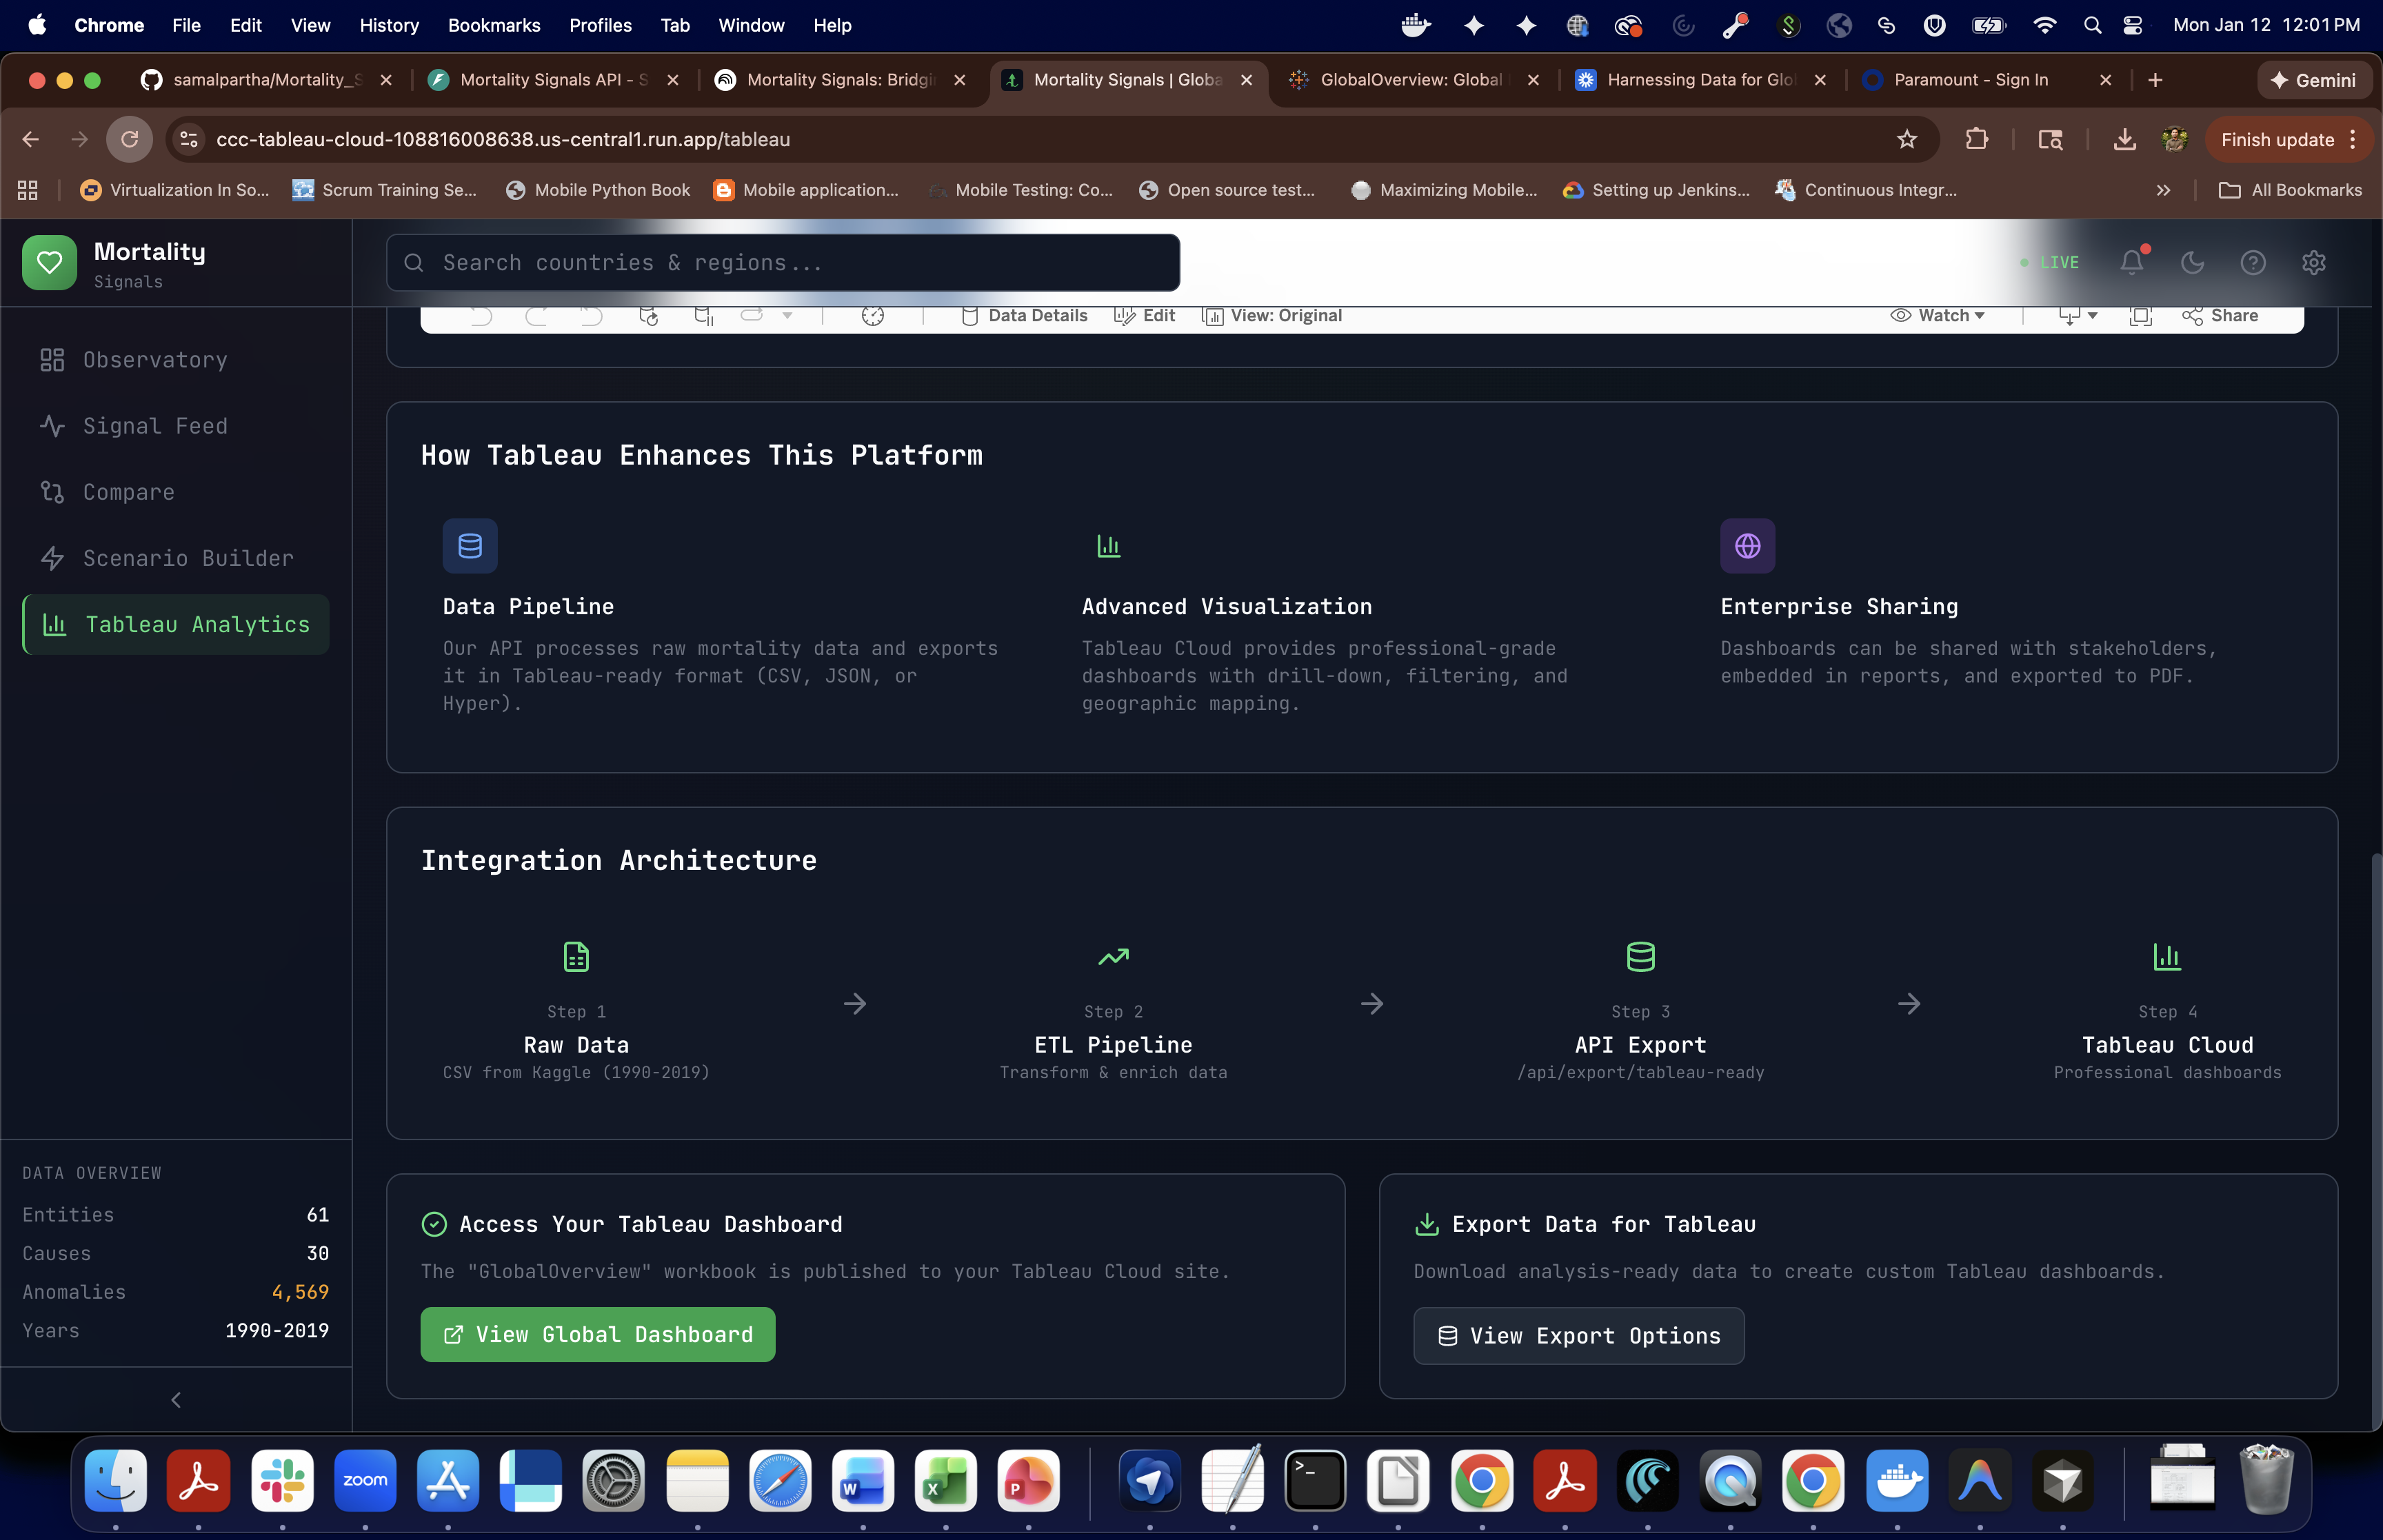
Tableau analytics-2
-
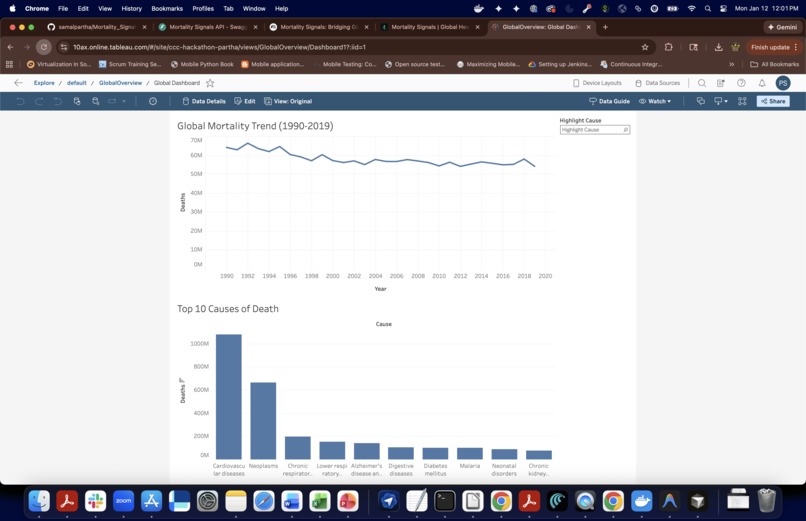
Tableau-Cloud-Dashboard


Inspiration
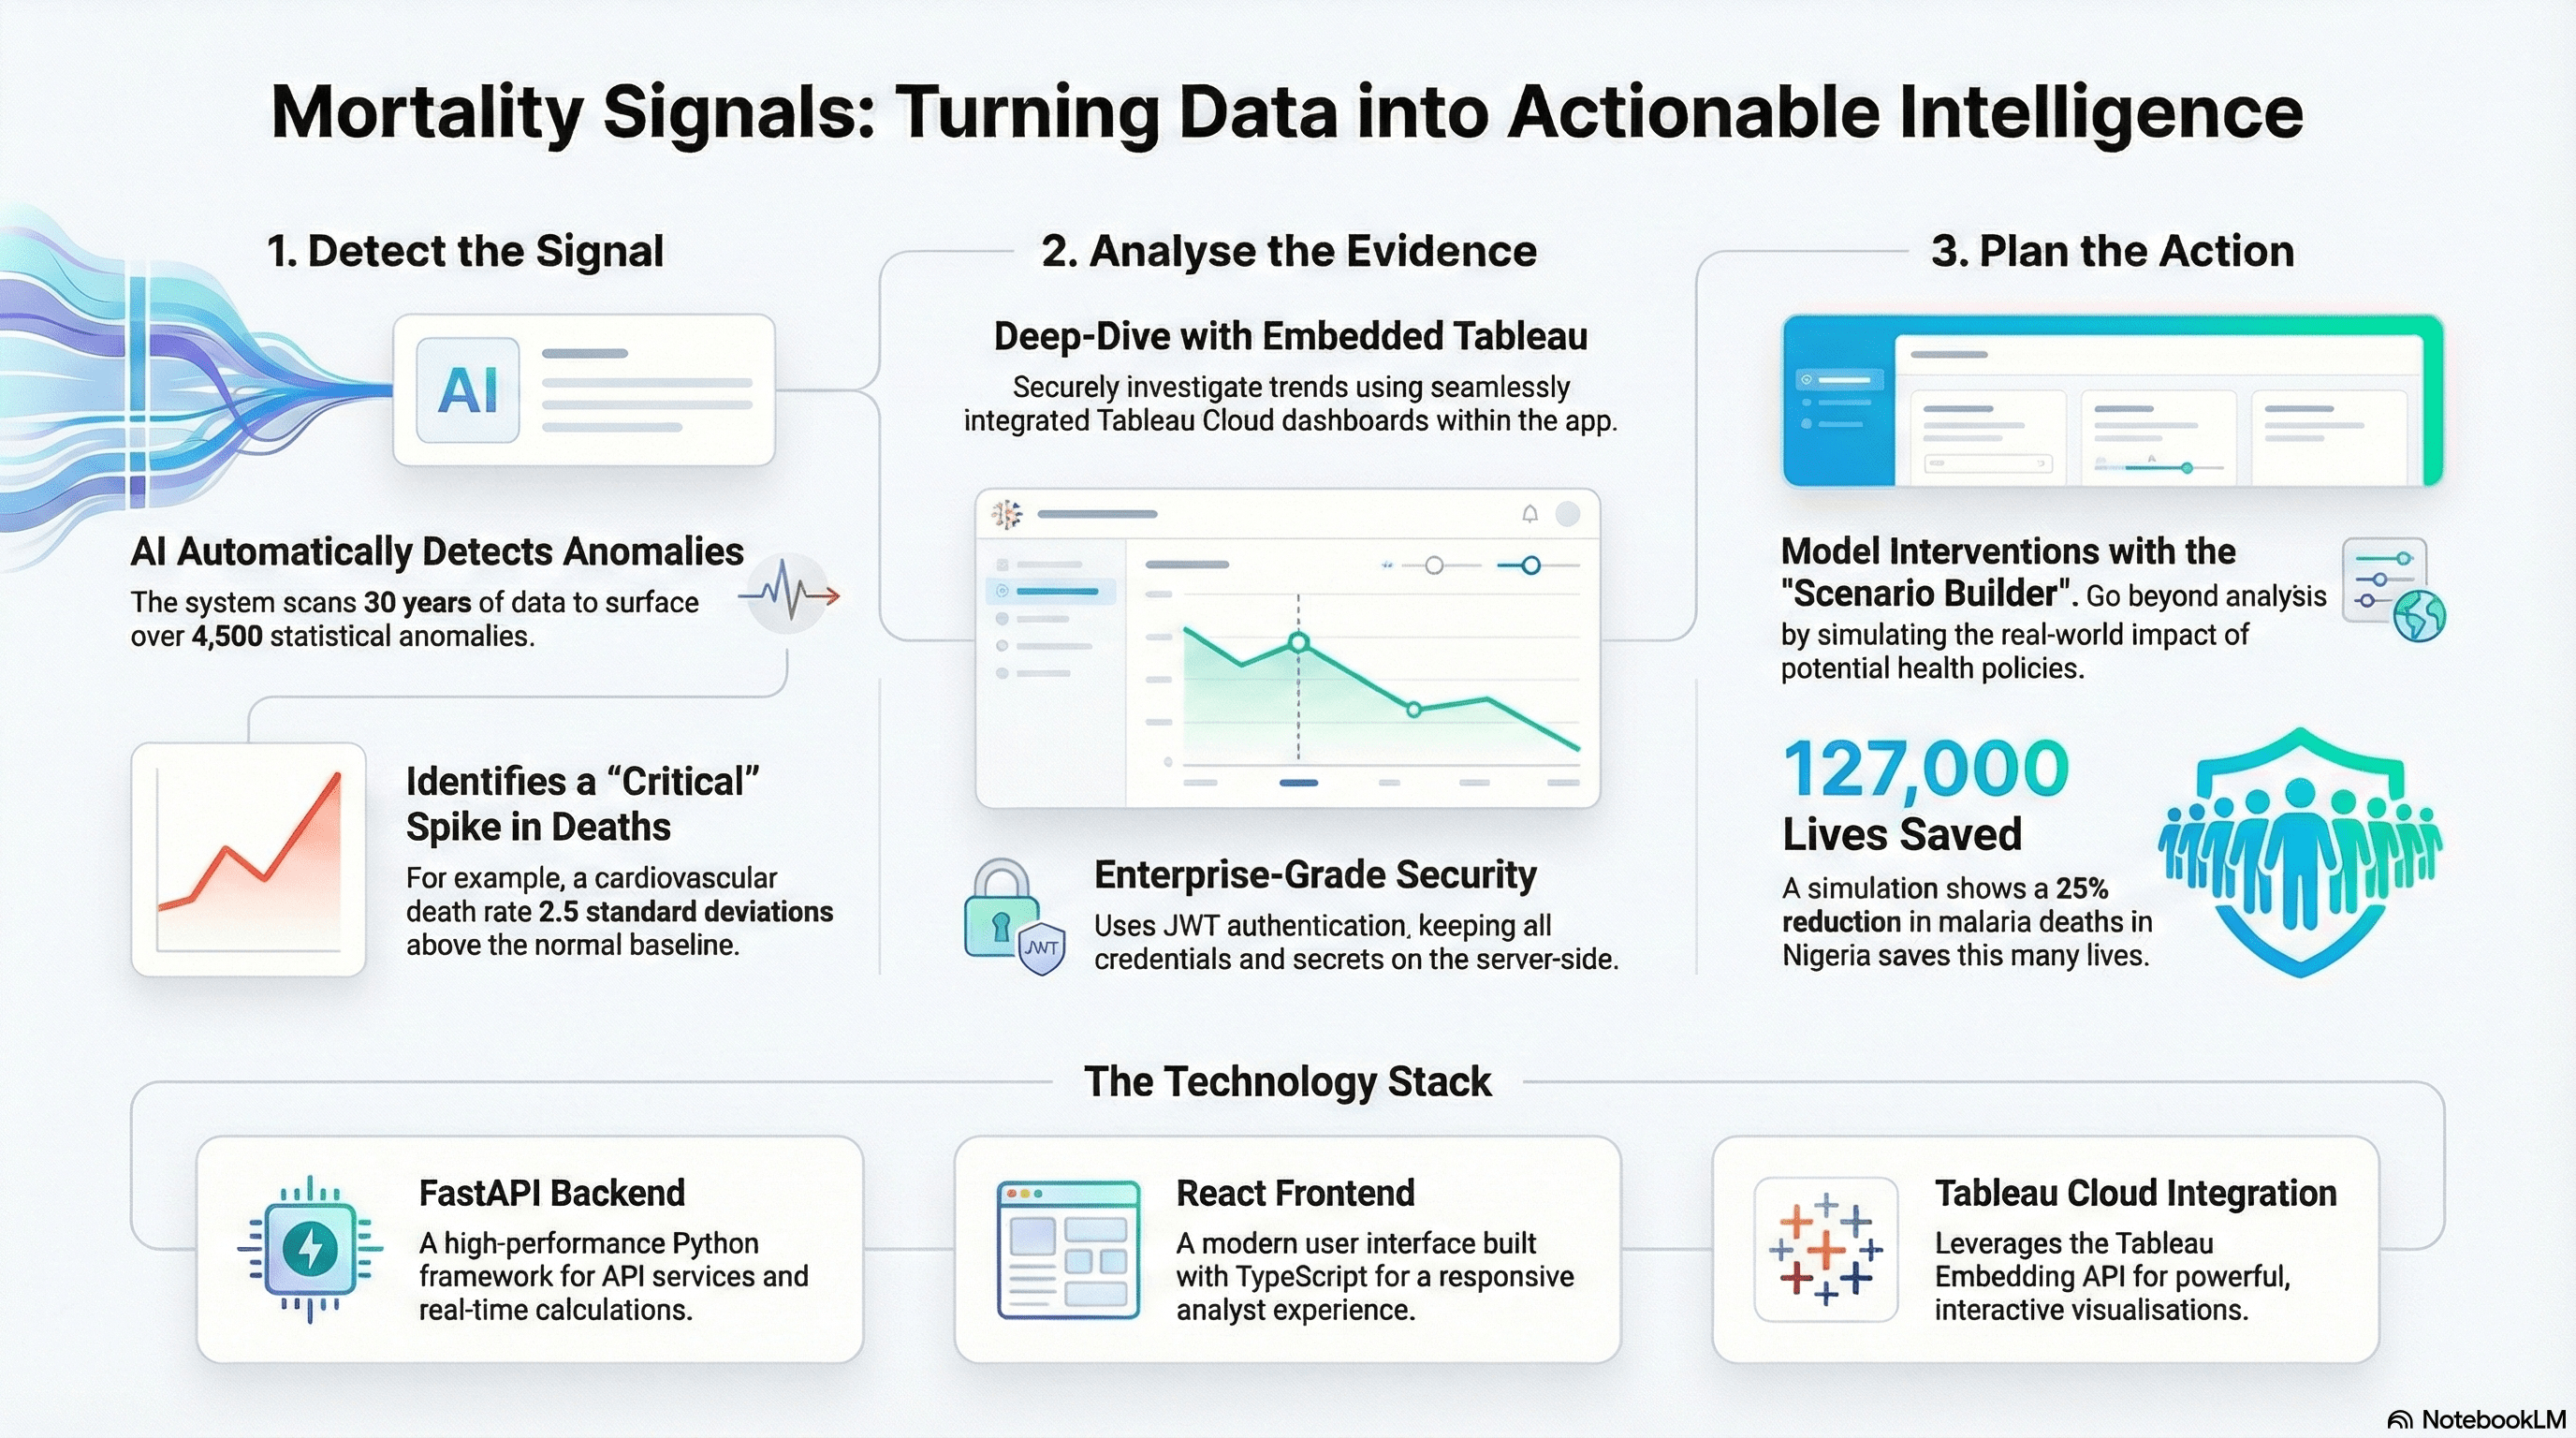
Public health analysts and policymakers face a critical challenge: sifting through vast amounts of global mortality data to identify where interventions are most needed. They need answers to pressing questions: Where are unusual spikes in deaths occurring? What's causing them? And most importantly, what interventions would save the most lives? Traditional analysis is time-consuming and often reactive rather than proactive.
What it does
Mortality Signals transforms 61 countries' mortality data across 30 causes into actionable intelligence through:
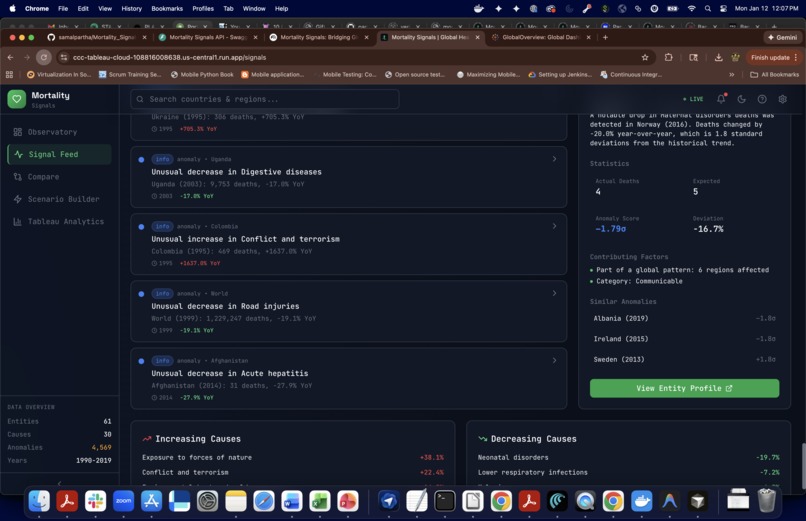
- AI-Powered Signal Detection: Z-score anomaly detection automatically surfaces 4,500+ mortality anomalies with severity levels (Critical/Warning/Info)
- Interactive What-If Scenarios: Scenario Builder allows users to model intervention strategies, showing projected lives saved with specific reduction targets
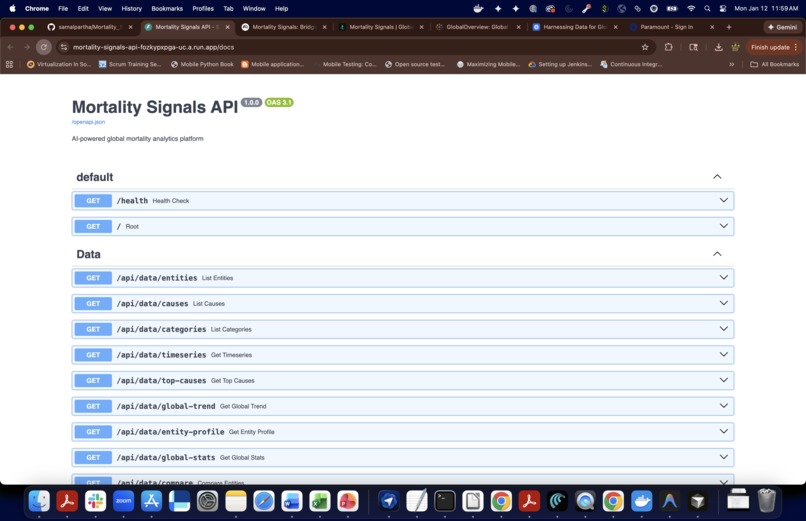
- Tableau Cloud Integration: JWT-authenticated embedded dashboards provide deep analytical views with Top 10 Causes, yearly trends, and interactive filters
- Global Observatory Dashboard: Real-time KPIs, 30-year trends, and cause category breakdowns in a professional dark/light themed UI
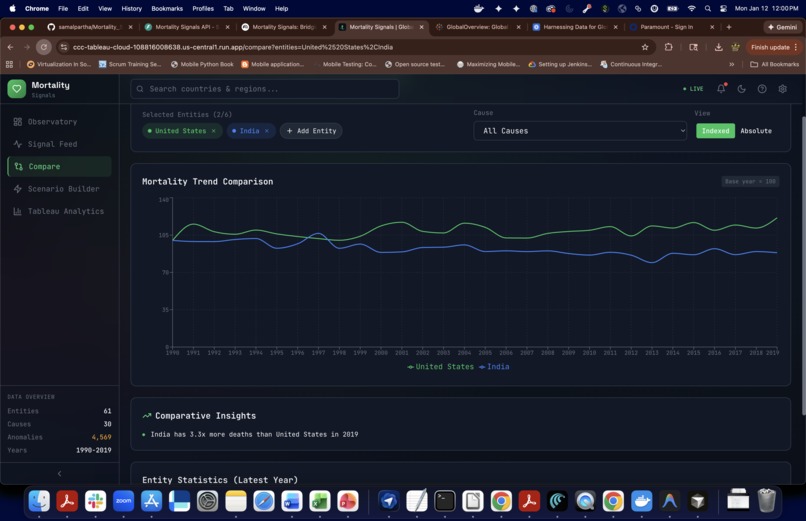
- Peer Country Comparison: Compare up to 6 countries with indexed/absolute views to identify best practices
How we built it
Data Pipeline (Python):
- ETL pipeline processing Kaggle mortality data (1990-2020)
- Z-score statistical analysis for anomaly detection
- Parquet file optimization for fast querying
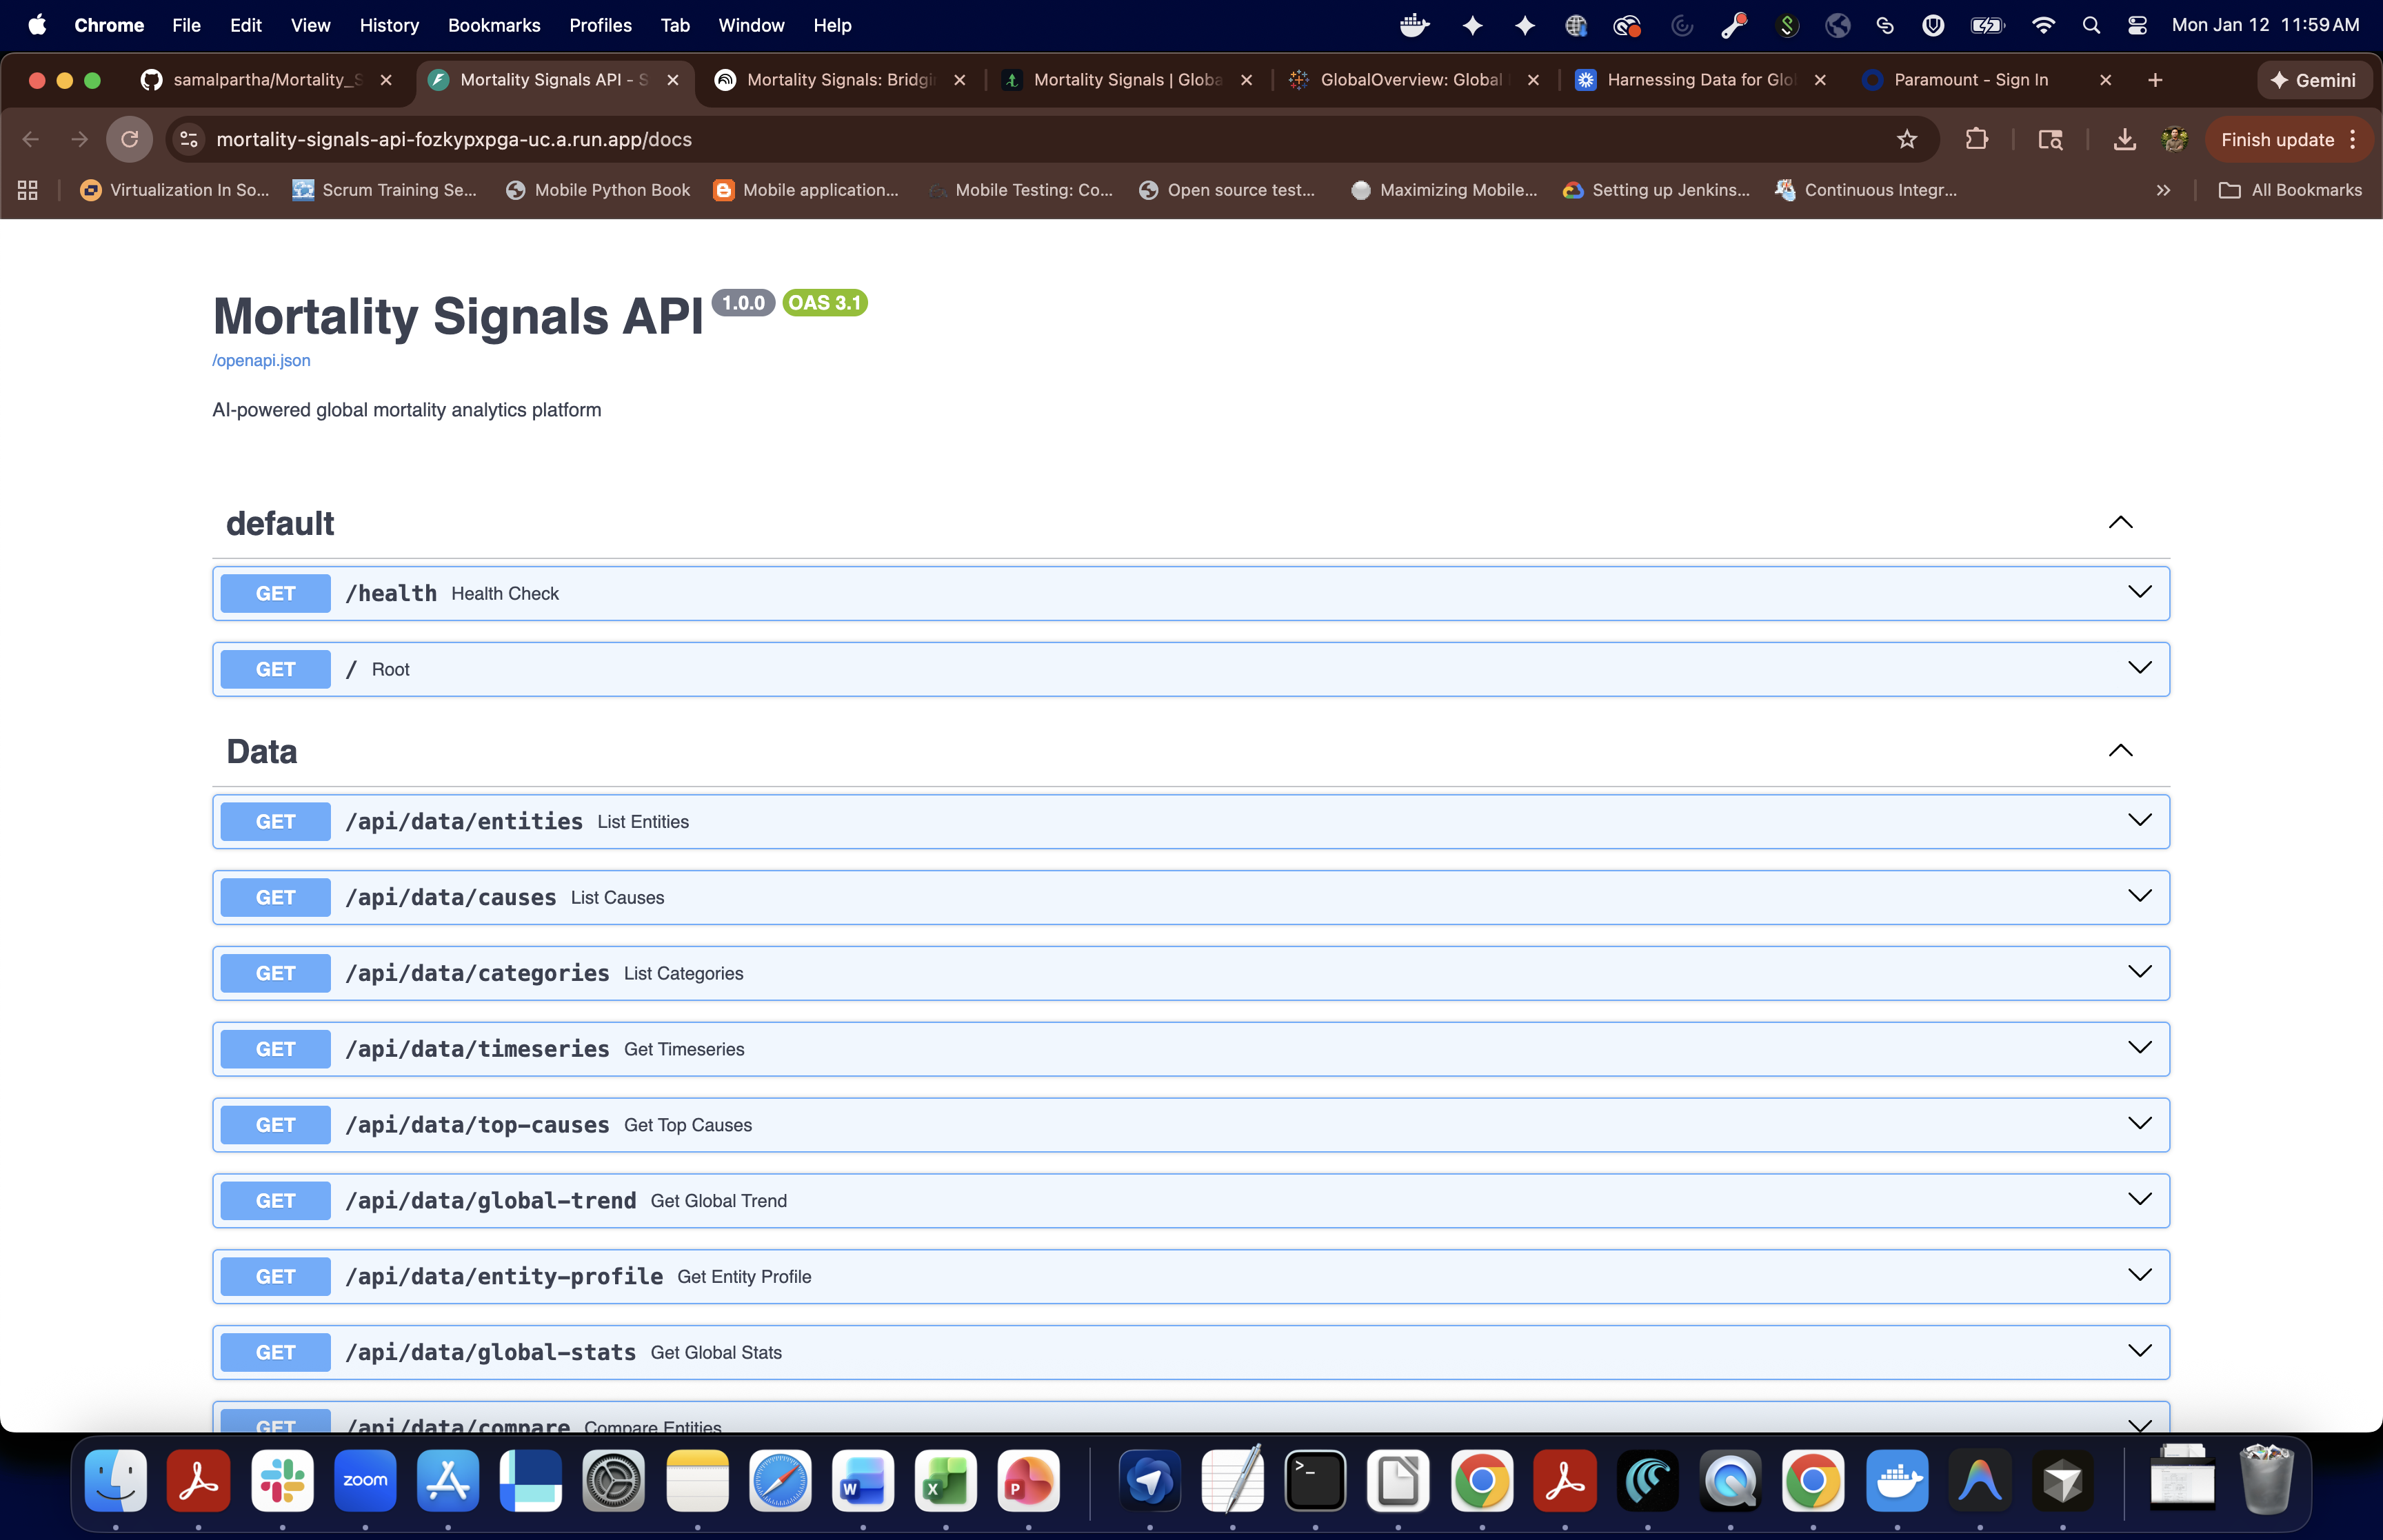
Backend (FastAPI):
- RESTful API with endpoints for data, insights, scenarios, and Tableau integration
- JWT token generation for secure Tableau Cloud embedding
- Scenario simulation engine with lives-saved calculations
- CORS-enabled for production deployment
Frontend (React + TypeScript):
- Modern SPA with Vite build system
- Tableau JavaScript API v3 integration
- Responsive design with Tailwind CSS
- Dark/light theme support
Tableau Cloud:
- Connected App with Direct Trust authentication
- Published dashboards with global mortality visualizations
- Embedded views with row-level security
Deployment:
- Google Cloud Run for API and web services
- Docker containerization
- Production URLs for live demo
Challenges we faced
- Tableau JWT Authentication: Implementing secure server-side JWT token generation while keeping secrets safe from client exposure
- Data Volume: Processing and optimizing 30 years of global mortality data for real-time queries
- Anomaly Detection Tuning: Calibrating Z-score thresholds to surface meaningful signals without overwhelming users with false positives
- Scenario Modeling Logic: Designing an intuitive intervention builder that accurately projects lives-saved outcomes
- Cross-origin Integration: Configuring CORS and Tableau's domain allowlist for seamless embedding
Accomplishments that we're proud of
- Built a production-ready platform with 4,500+ automatically detected mortality anomalies
- Achieved seamless Tableau Cloud integration with JWT authentication
- Created an intuitive Scenario Builder that makes complex what-if analysis accessible
- Developed a polished, professional UI that works in both dark and light modes
- Deployed live demo accessible at production URLs
- Delivered a complete solution from data pipeline to frontend in hackathon timeframe
What we learned
- Deep understanding of Tableau Embedded Analytics and Connected Apps architecture
- Best practices for JWT-based authentication in embedded analytics
- Statistical methods for detecting meaningful anomalies in time-series health data
- Importance of user experience in making complex analytical tools accessible
- Google Cloud Run deployment strategies for full-stack applications
What's next
- Real-time data streaming with Kafka for immediate anomaly alerts
- Advanced forecasting using Prophet/ARIMA models
- User authentication with OIDC for personalized dashboards
- Alert subscriptions and email notifications for critical signals
- Tableau Pulse integration for mobile insights
- Kubernetes deployment for enhanced scalability
- Integration with WHO and CDC data sources


Log in or sign up for Devpost to join the conversation.