Inspiration
Our inspiration is the current global climate crisis.
What it does
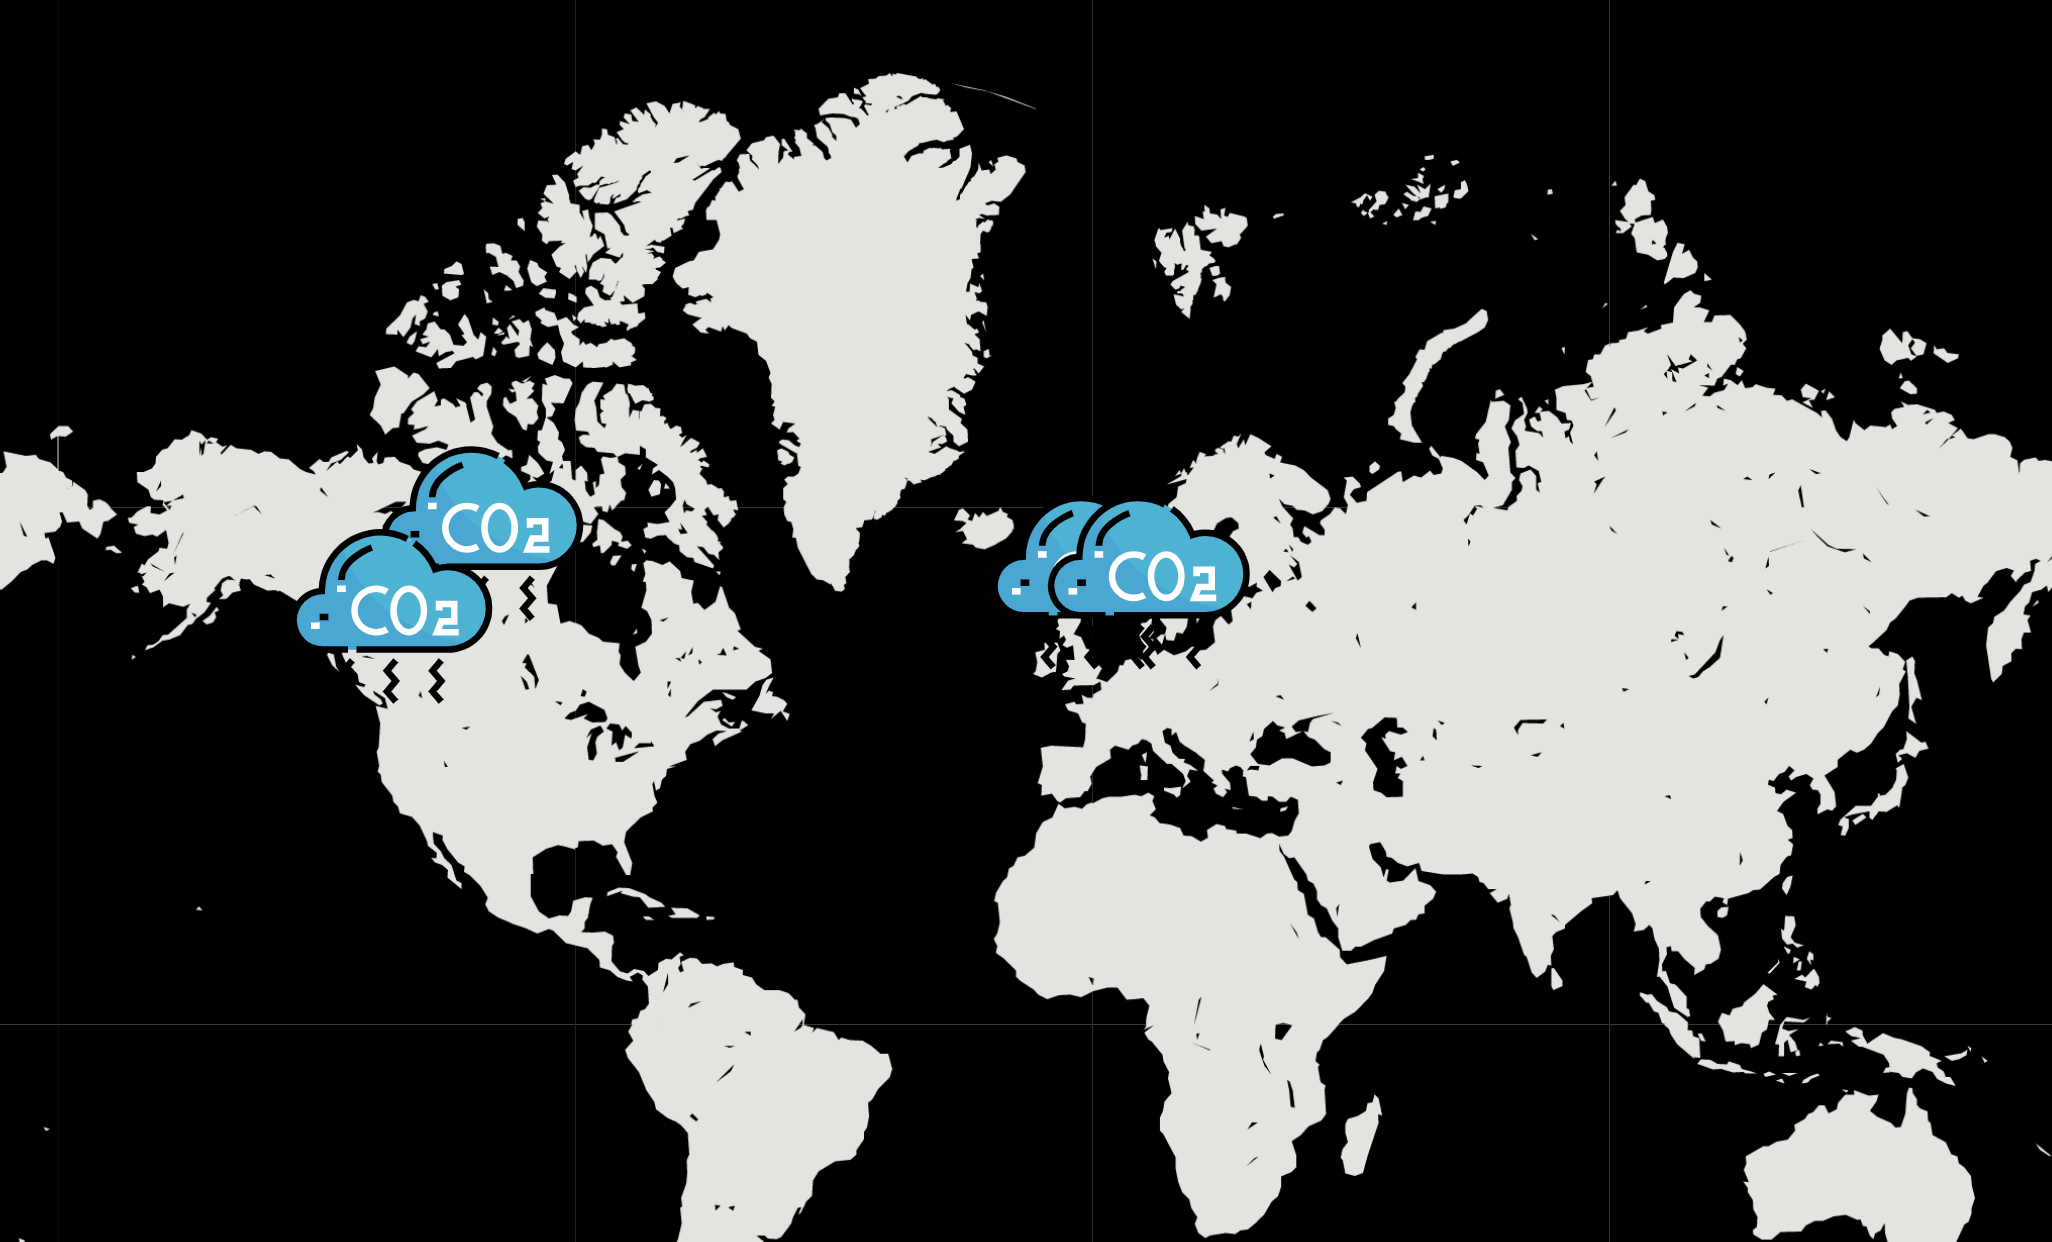
Estimates the user's carbon footprint based on historical transaction data of other users in their country across three major components - Groceries, Flights and Gas.
How we built it
We used the OpenBanking Sandbox to retrieve profiles of users linked with location and transaction history. This transaction history was separated by Region and Type of transaction, and we used statistical transformations to normalize CO2 Emissions per GDP to CO2 Emissions per Dollar. Furthermore, we used regression to find a simple equation that helped estimate emission based on the three coefficients. The map was created in React using Google Maps and the back-end was written in Python using Flask. The front-end was hosted on Google Firebase and the back-end on Heroku.
Challenges we ran into
The Google Maps API was a bit of a rough one.
Accomplishments that we're proud of
We successfully deployed a well round project using ML, React and Flask on Google Cloud services.
What we learned
Deployment is a little harder than it looks, furthermore we learned how to present data in an accessible and relatable way.
What's next for COtoMap
Add more countries, improve real-time updates, link with an actual bank in the future - look into Legal issues.


Log in or sign up for Devpost to join the conversation.