-
-
CostGraph UI
CostGraph
The true cost of one business outcome — across shared infrastructure, cross-project services, and AI.
The problem
Every engineering team can tell you their total cloud bill — but not what one order, one transaction, or one AI decision actually costs to produce. That cost is smeared across shared infrastructure, services owned by other teams, and AI/LLM spend. The gap drives bad pricing, capacity, and optimization decisions every day.
What CostGraph does
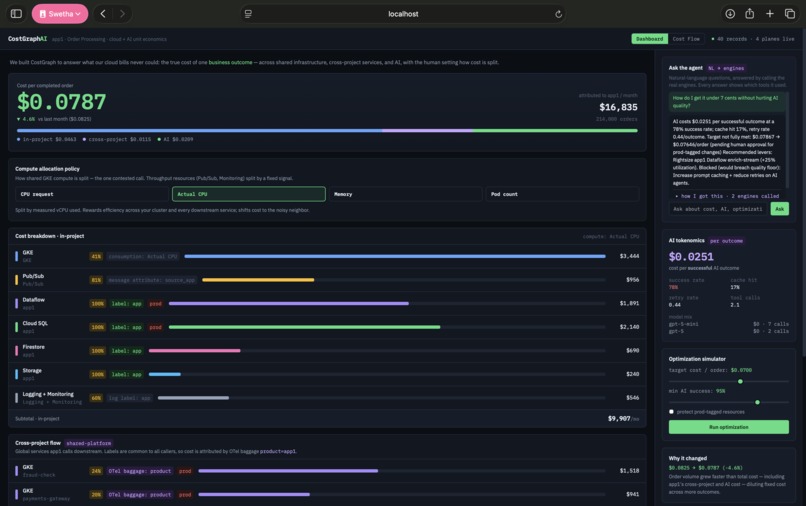
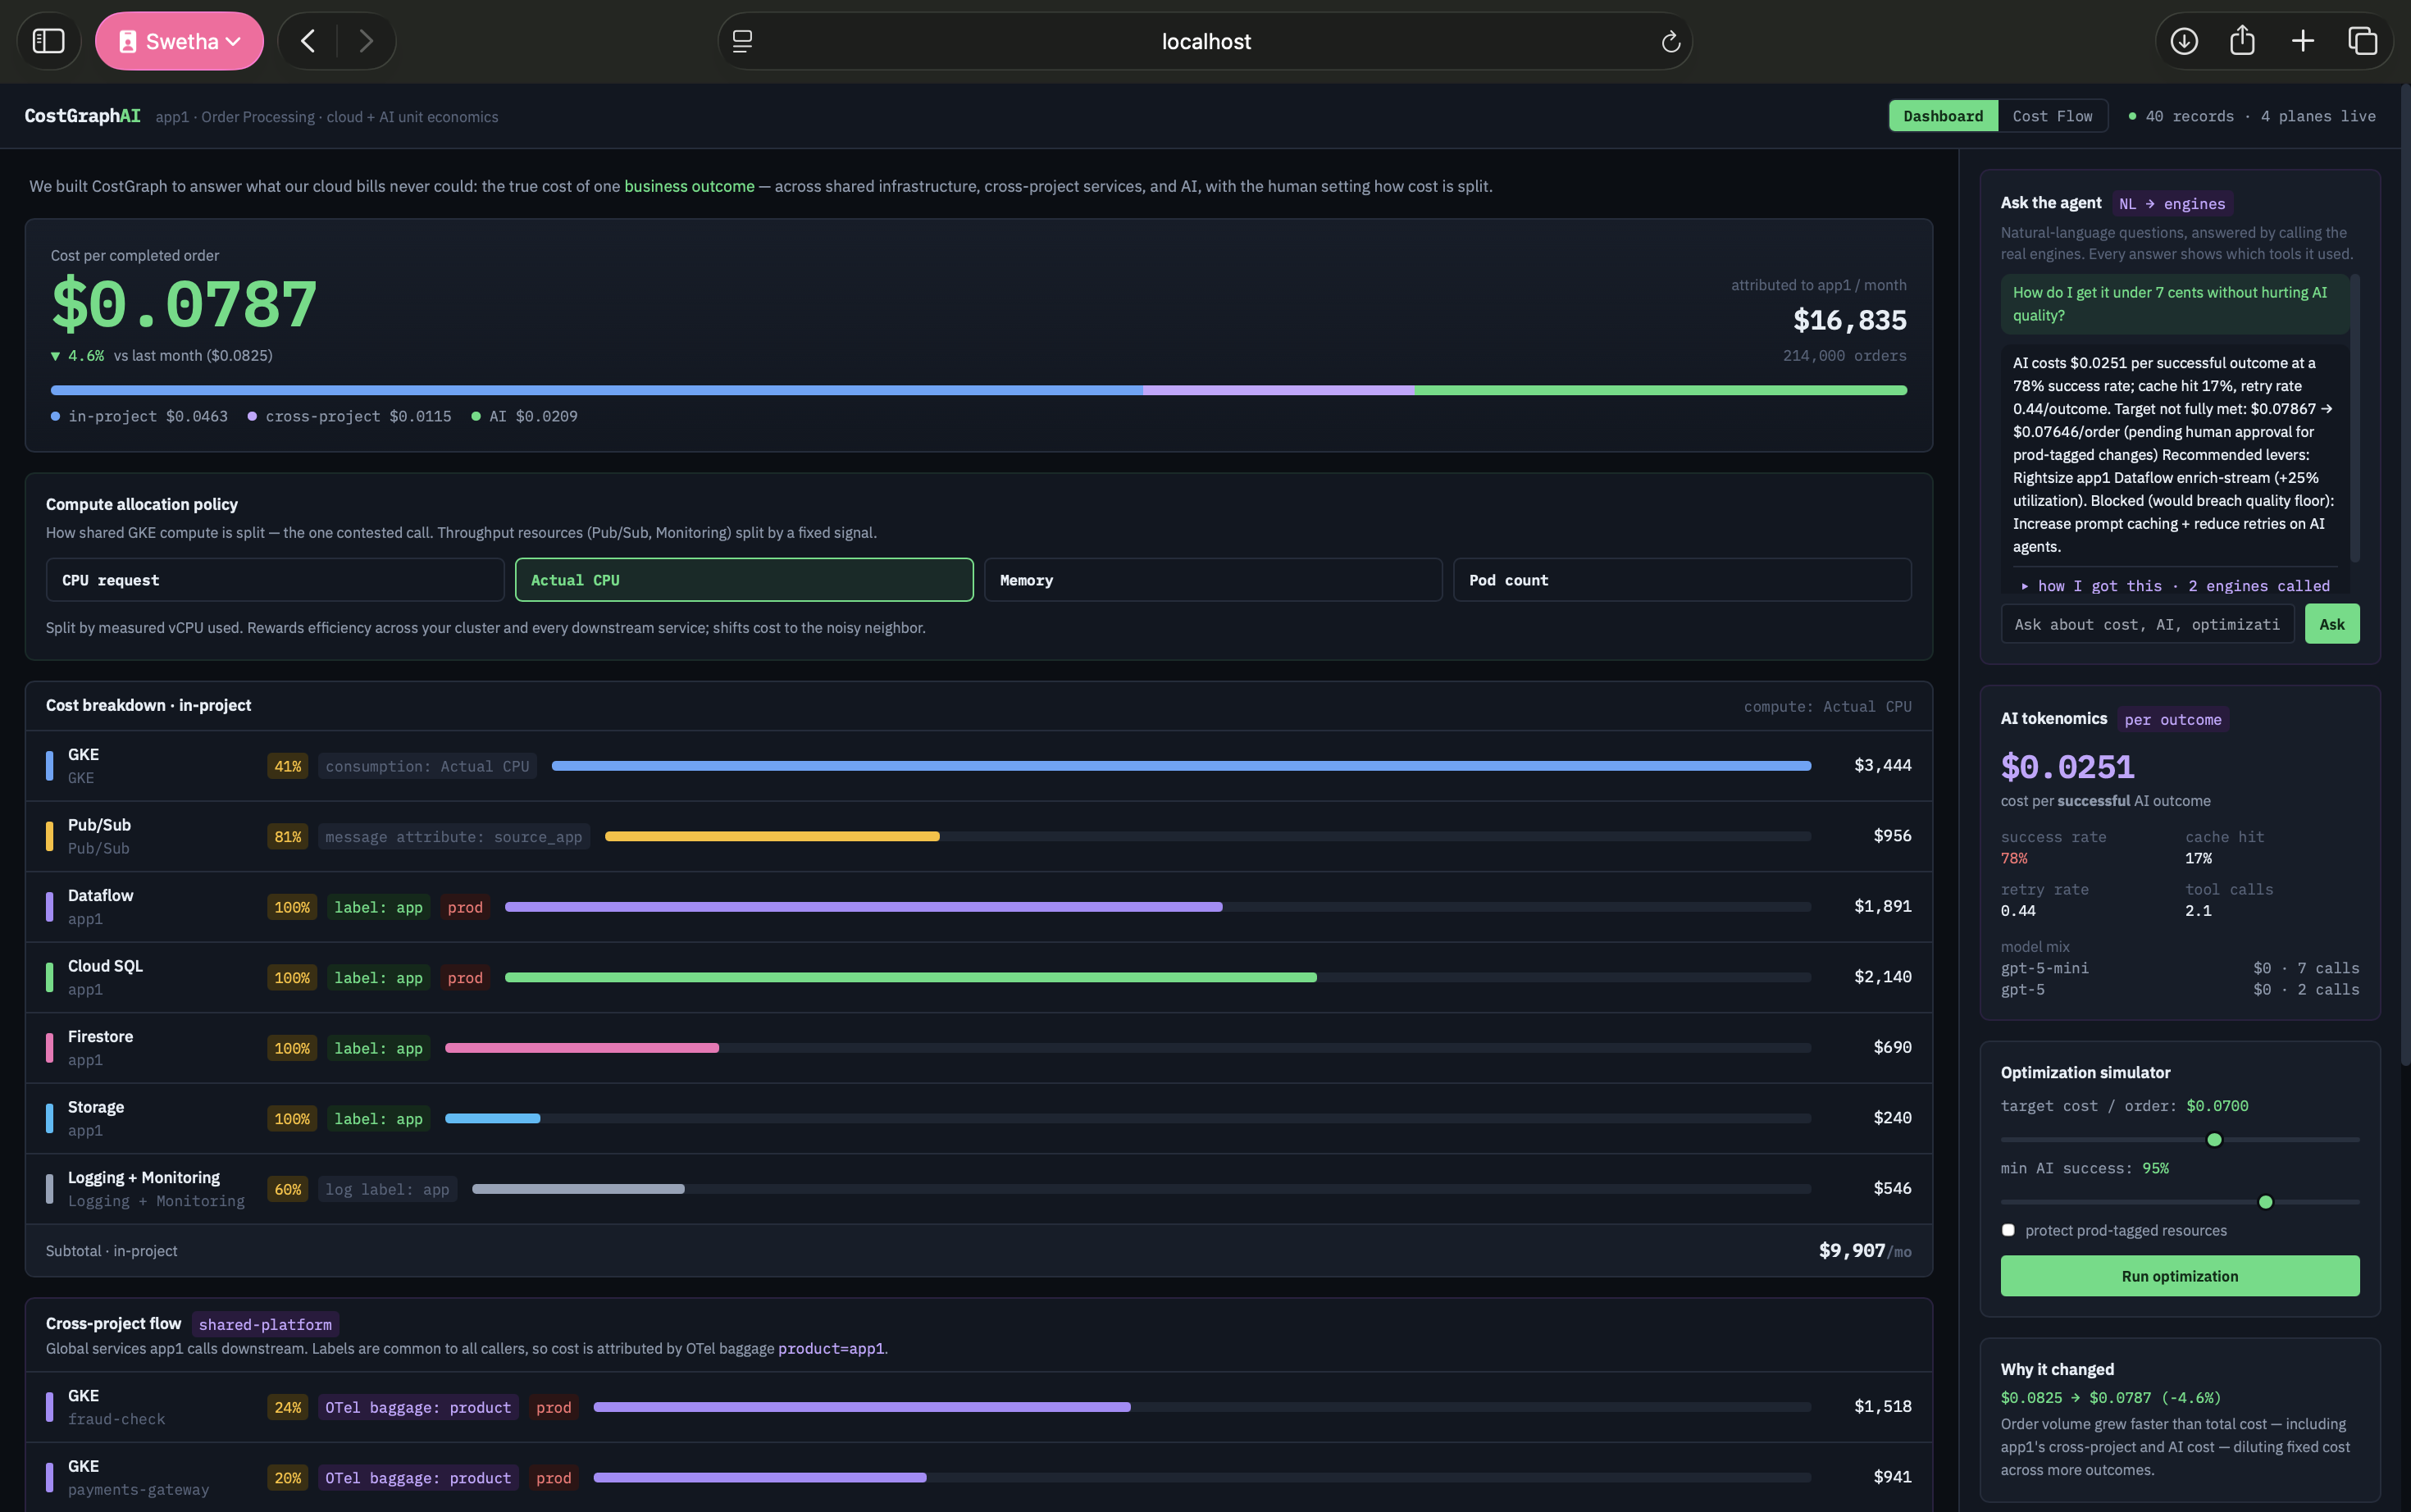
CostGraph computes the fully-loaded cost of one business outcome by attributing shared cloud cost, cross-project service cost, and AI cost down to the unit. It shows why cost changed, simulates optimizations that respect quality and prod guardrails, and includes a natural-language agent that calls real deterministic engines and proves its work with a visible tool trace. The story is KNOW → EXPLAIN → OPTIMIZE.
How it uses AI
- It measures agentic workflows — costing a multi-step agent pipeline (fraud-triage → payments → support) per successful outcome, exposing what retries and failures actually cost.
- It is agent-operated — a natural-language agent interprets questions, orchestrates the cost engines, and explains results, but never computes a number itself. Deterministic core, AI on top: the math is auditable; every answer shows the engines it called.
What's built
- Adoptable connector framework — four normalized data planes
- Working connectors — GCP billing (CSV + BigQuery) and OpenAI usage, plus file; cloud-agnostic
- Five deterministic engines — attribution, unit economics, AI tokenomics, RCA, constrained optimization
- AI agent endpoint — NL → real engine calls → grounded answer with tool trace
- React dashboard — cost decomposition, allocation control, interactive cost-flow graph, tokenomics, agentic-workflow tracing, optimization simulator
- 13 tests, Apache-2.0, public repo
Attribution uses an OpenTelemetry-baggage model for cross-project cost. Baggage values are seeded in this build to demonstrate the model; live OTel collection is the documented integration. The demo uses seeded, plausible figures so it runs standalone — the allocation logic and attribution model are real; only the input data is seeded.
Differentiation
FinOps tools tackle cloud cost allocation. CostGraph goes further by unifying cloud + cross-project + AI cost per successful outcome in one graph — and by making the allocation methodology an interactive control.
Built with
Python · FastAPI · Pydantic · React · Vite · Tailwind · OpenAI · GCP BigQuery · OpenTelemetry

Log in or sign up for Devpost to join the conversation.