-
-
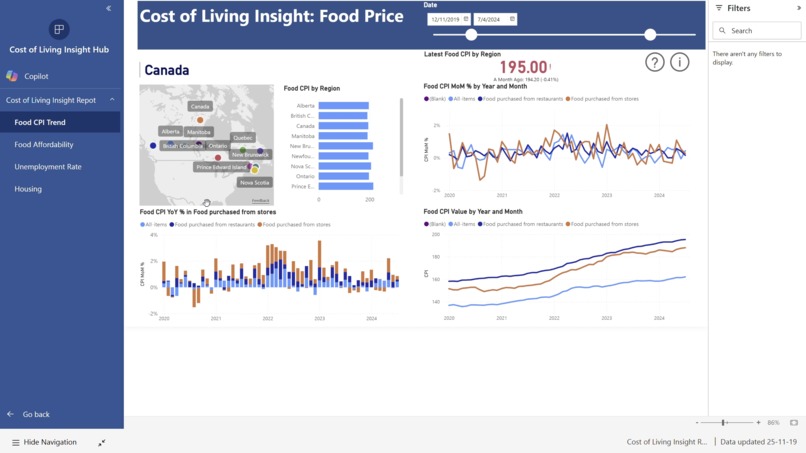
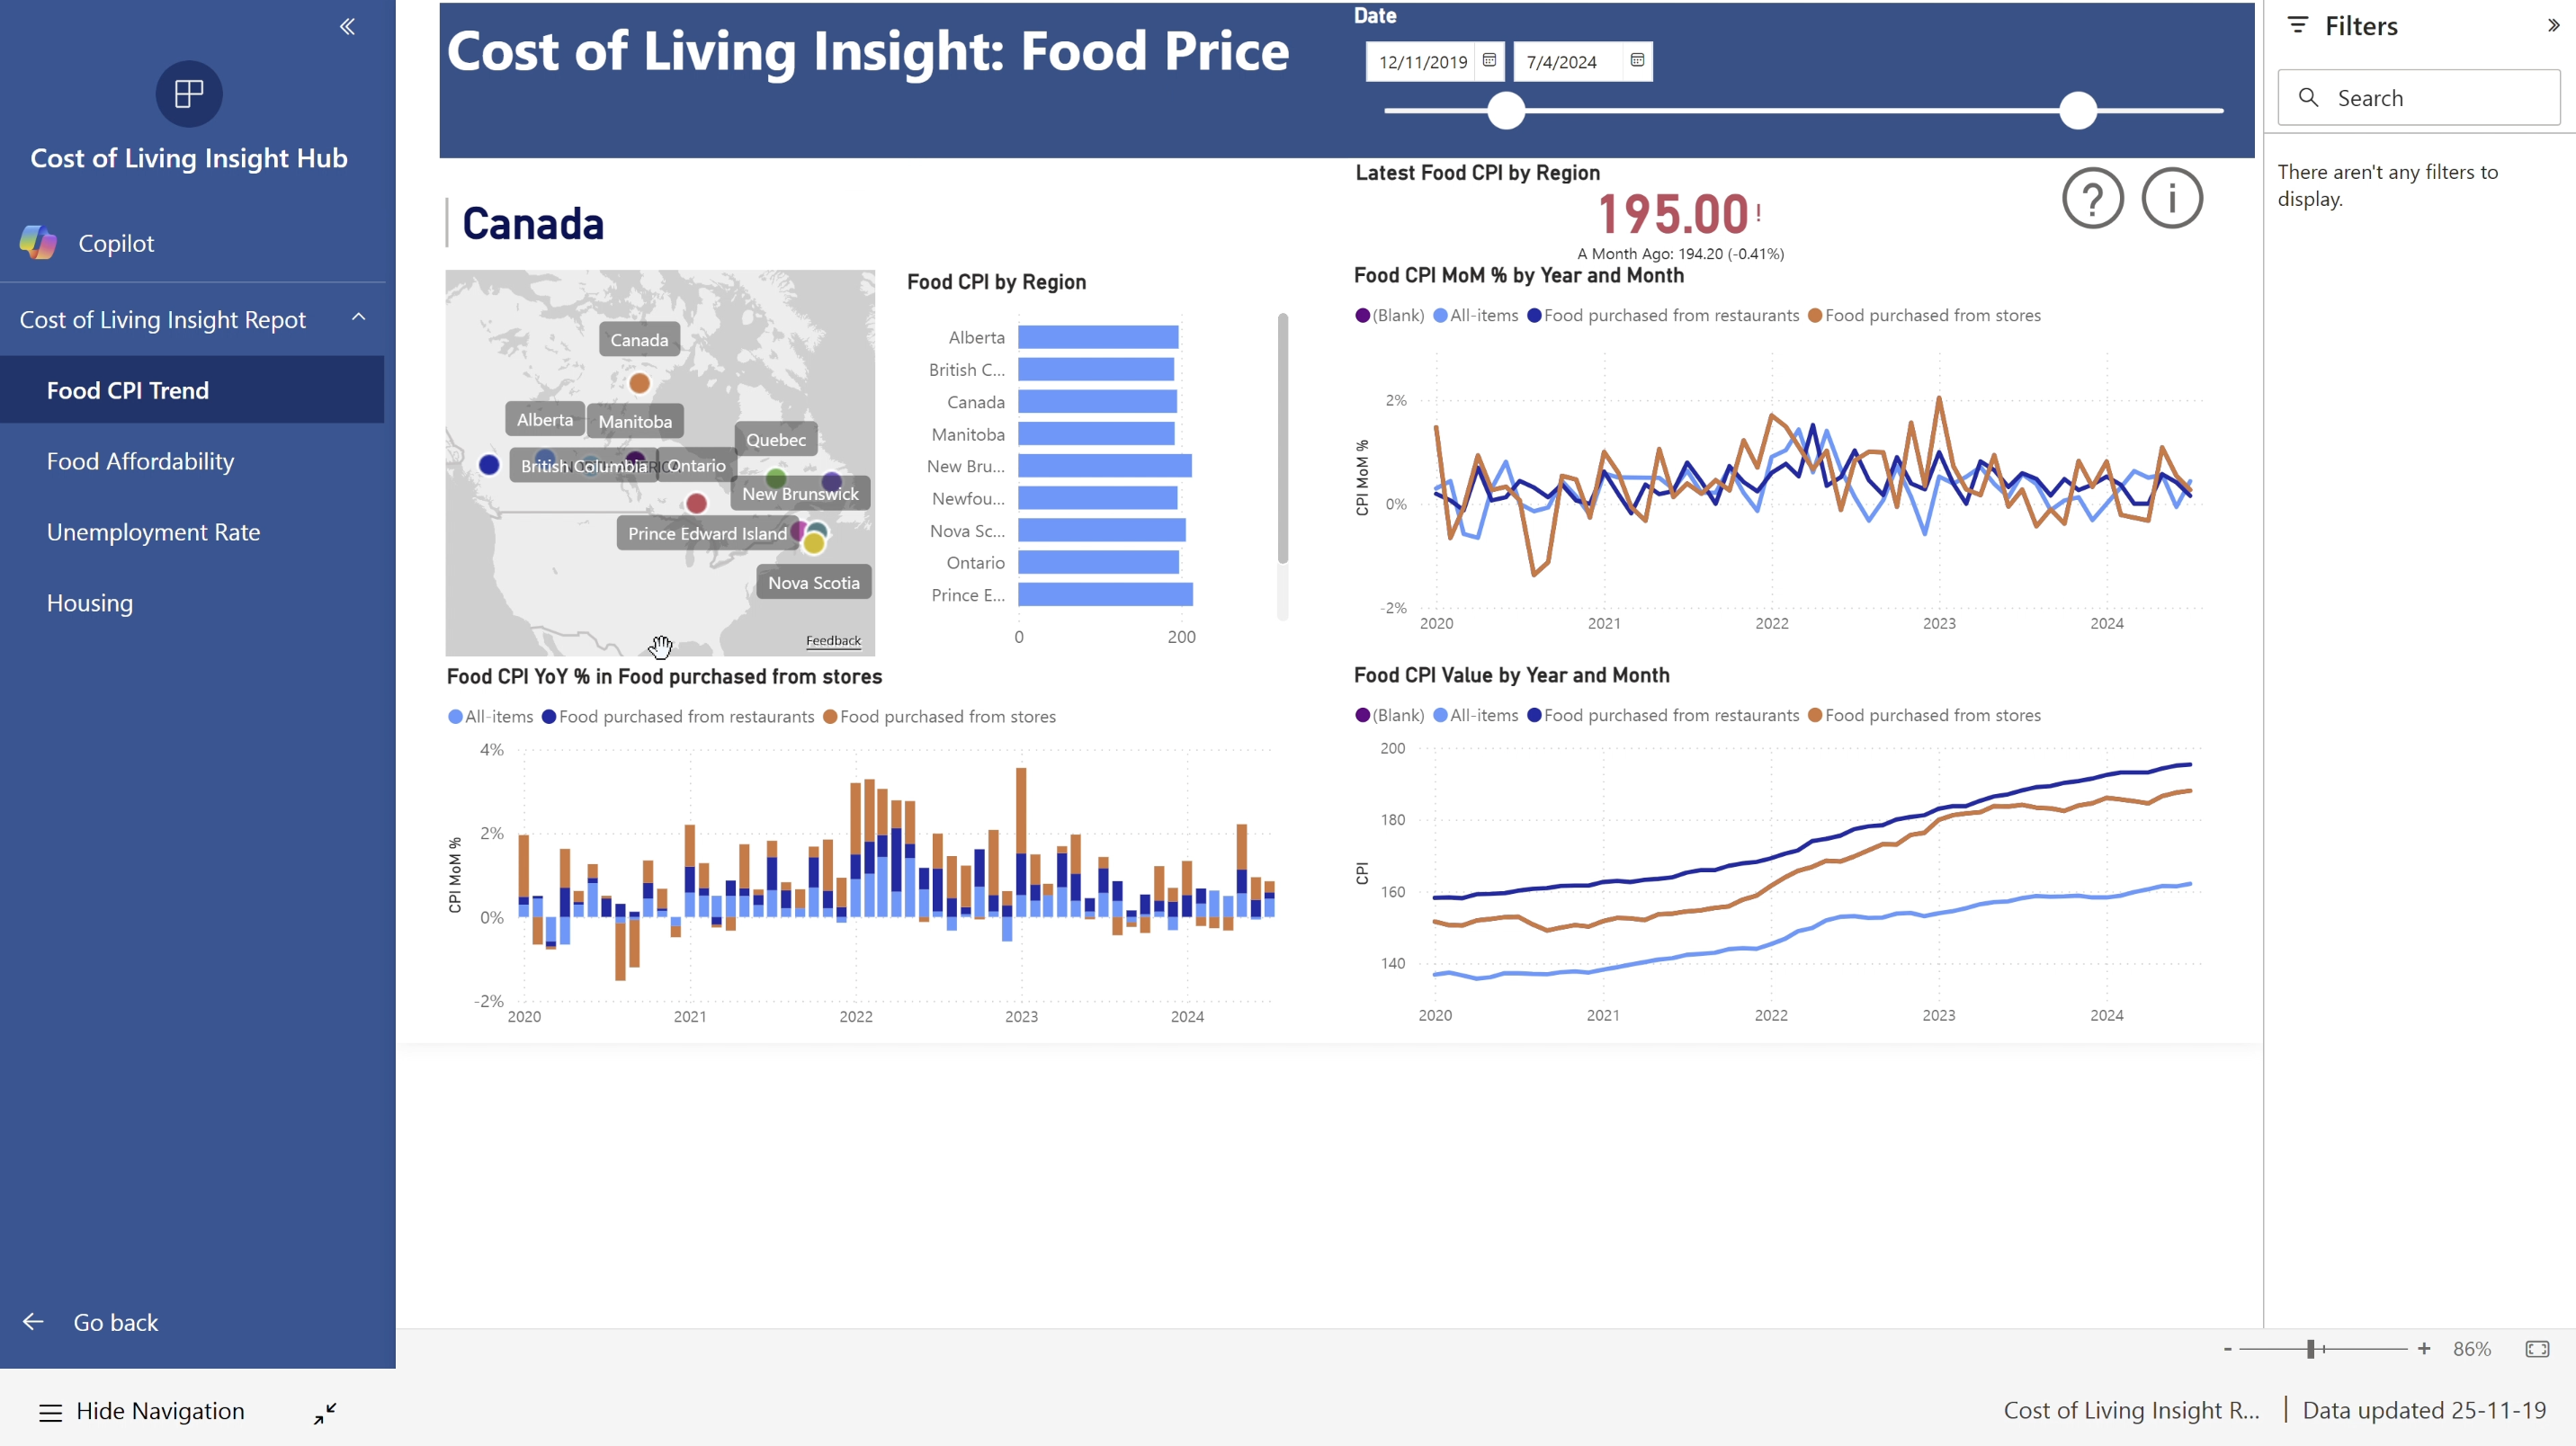
Food CPI
-
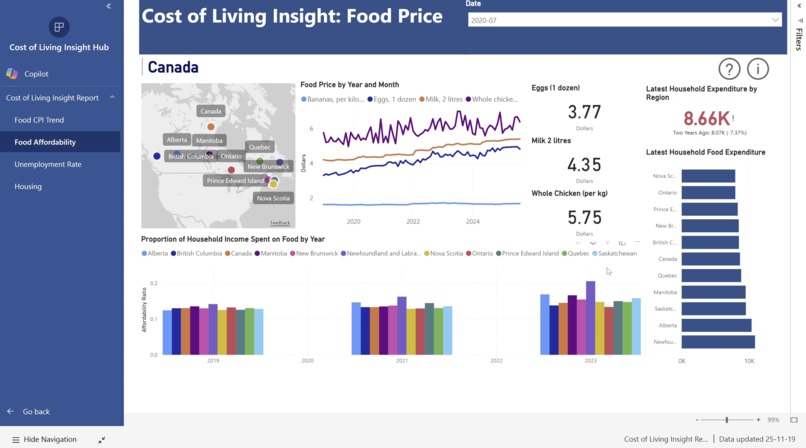
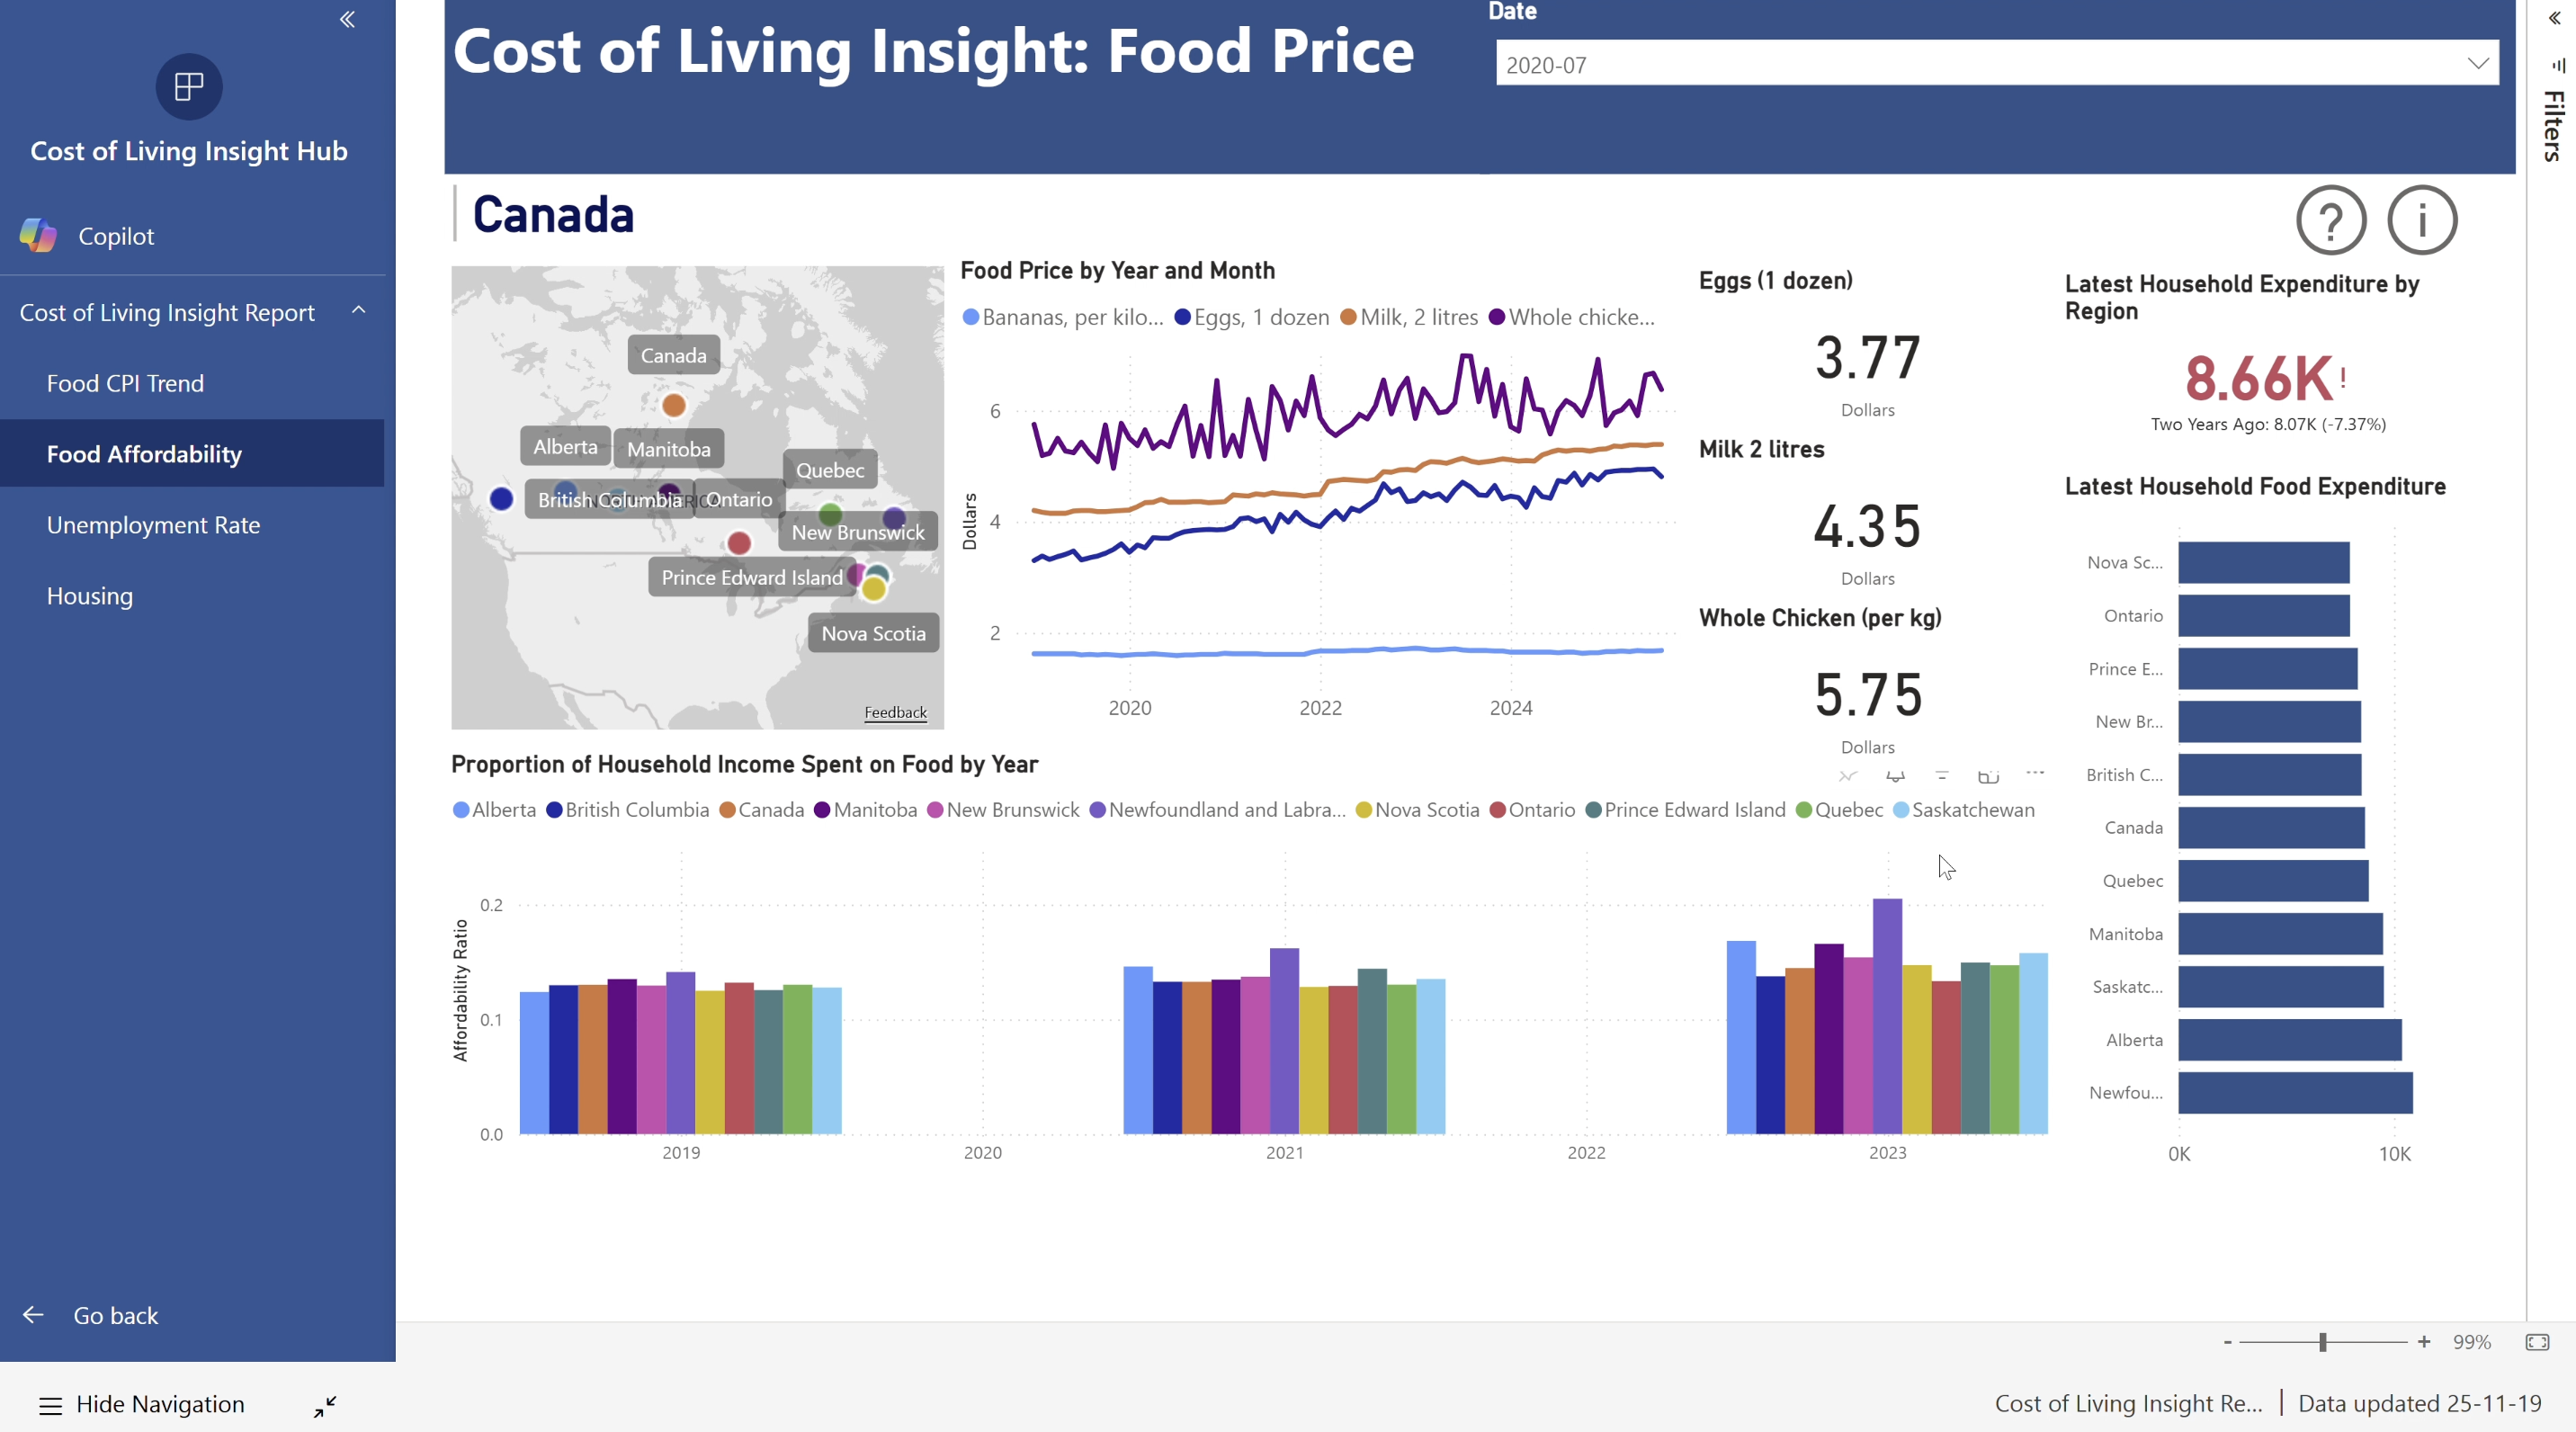
Food Affordability
-
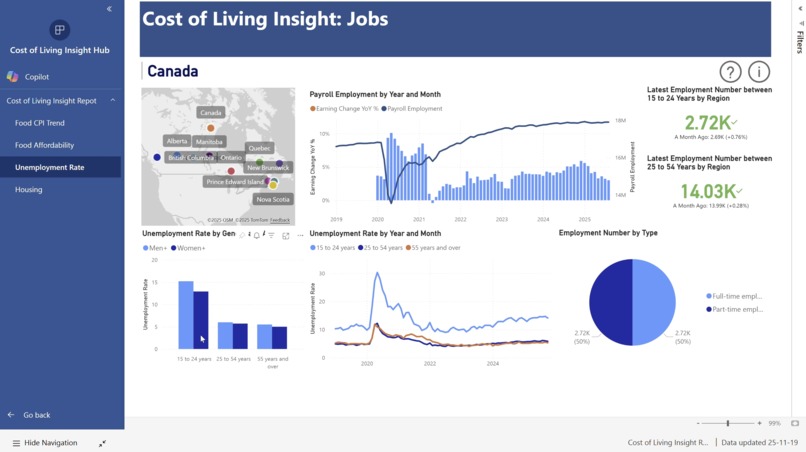
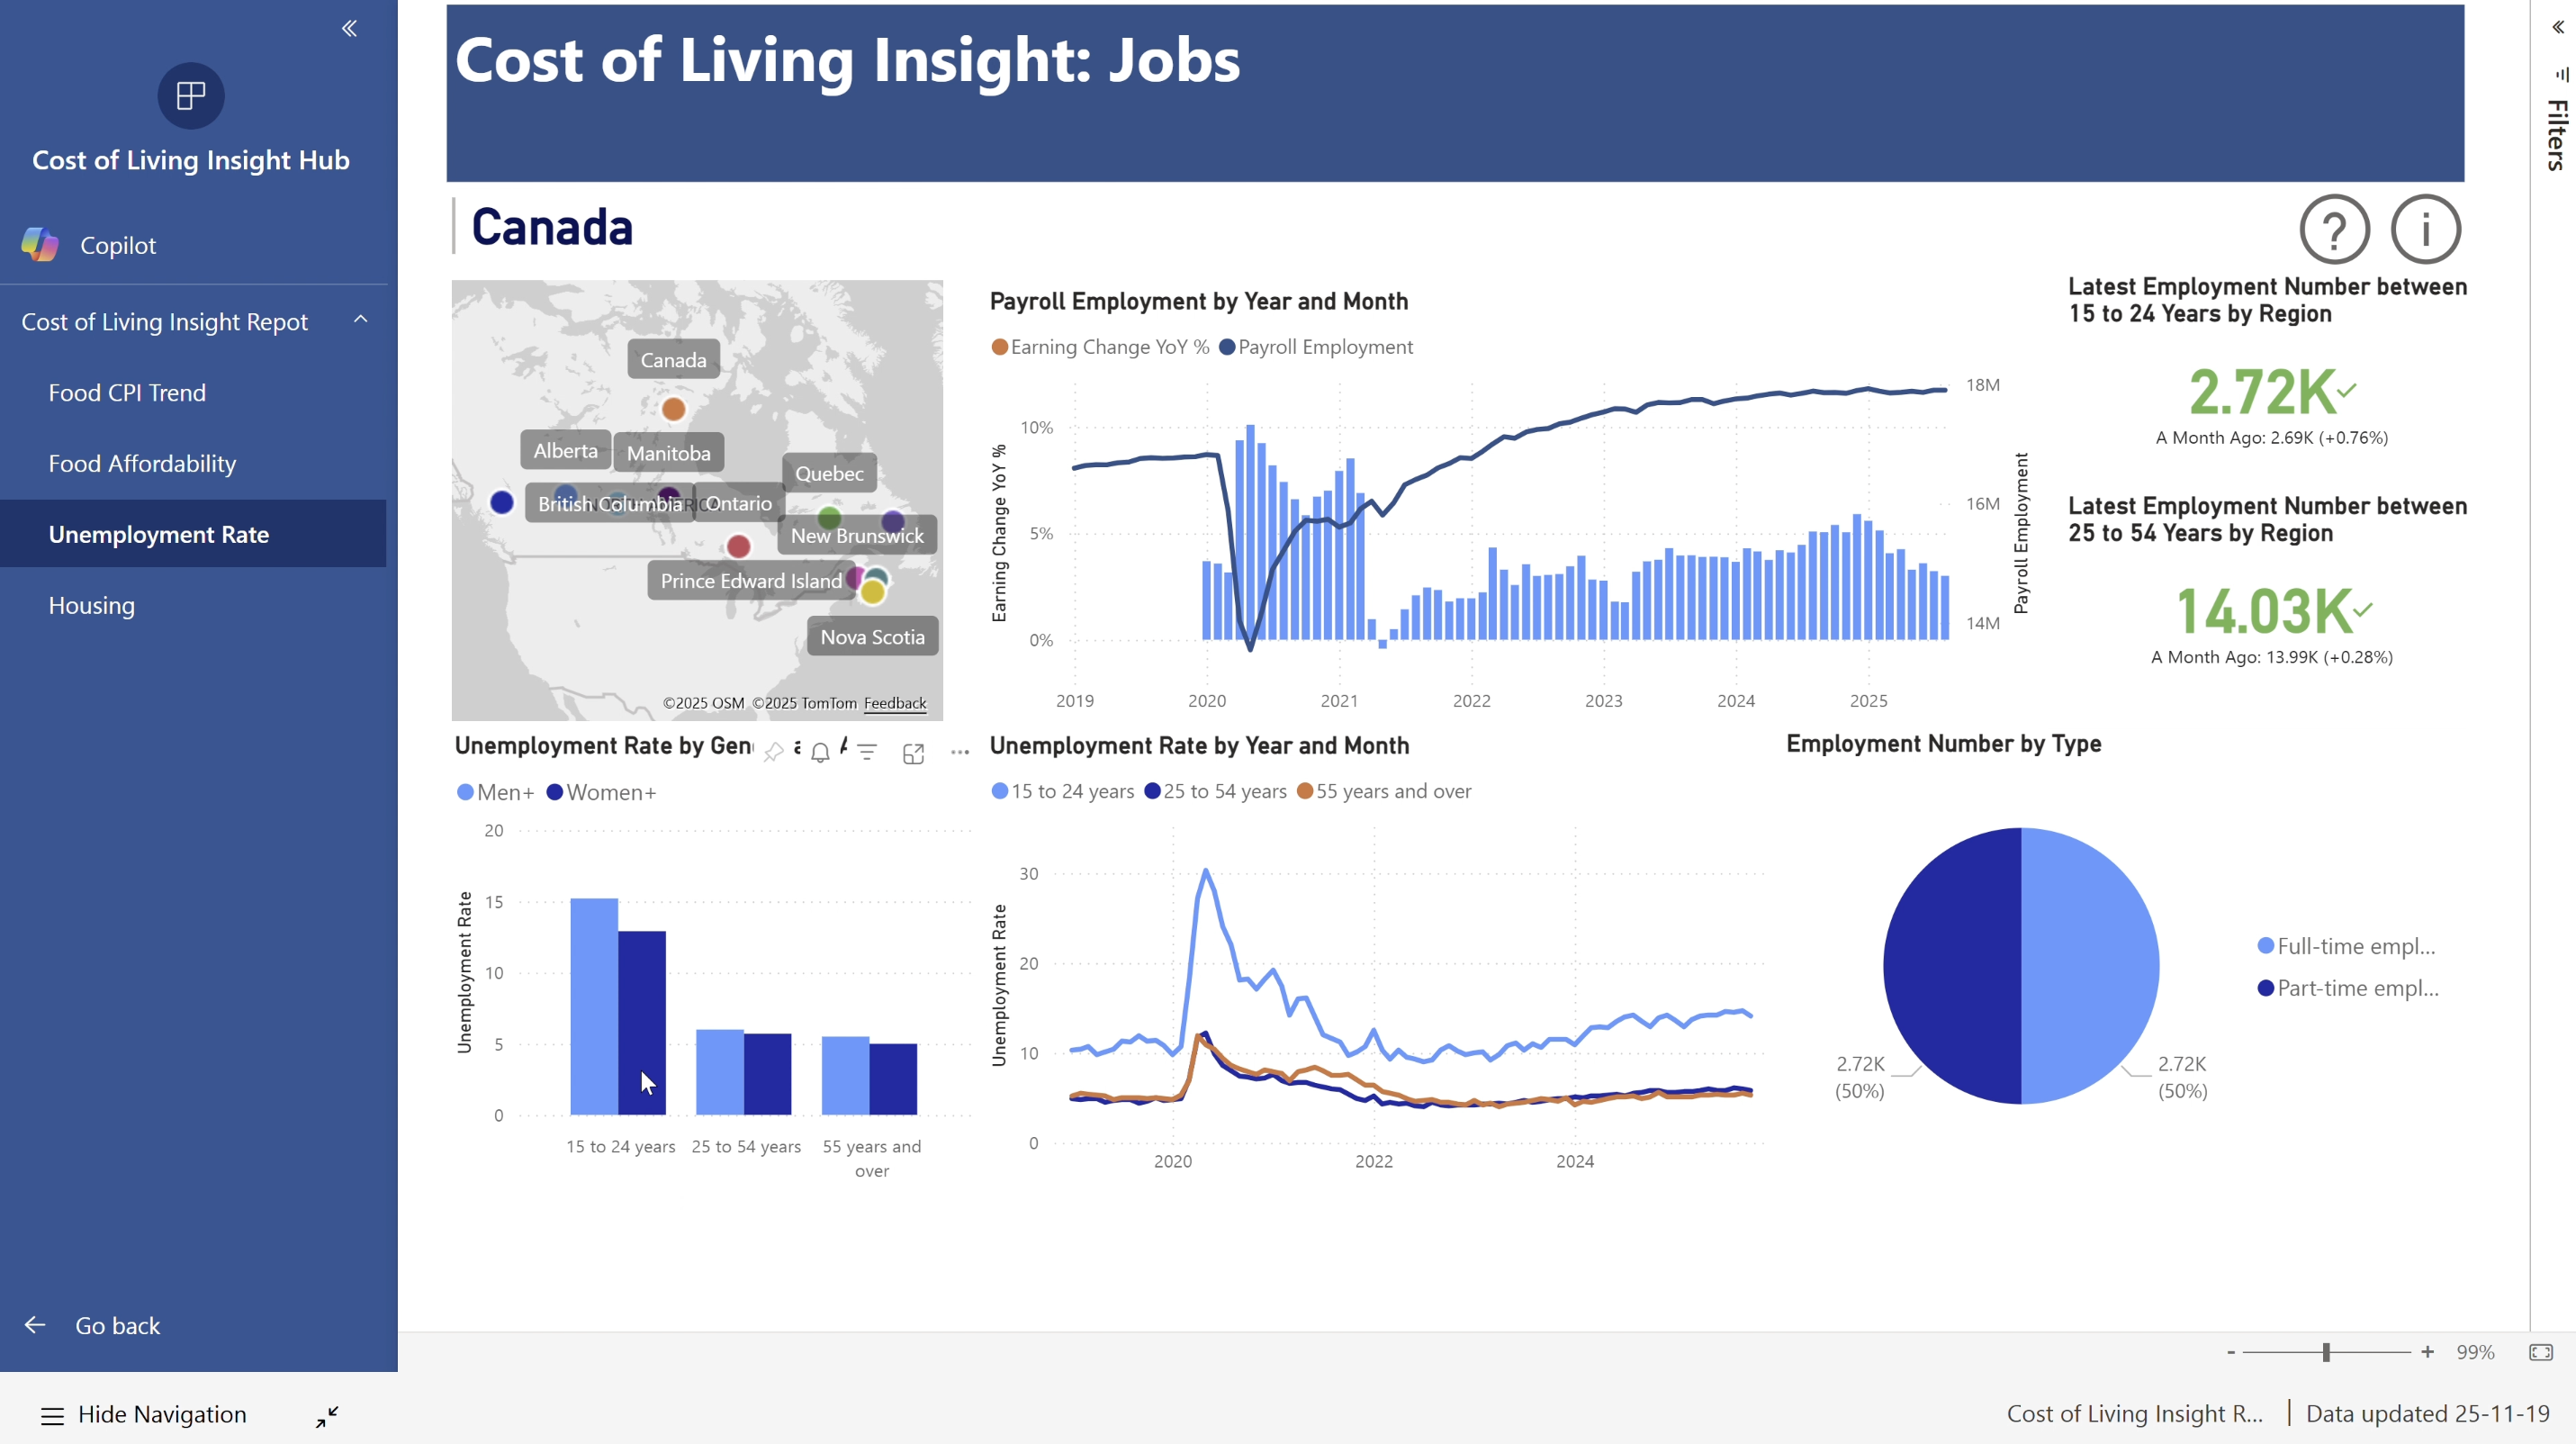
Unemployment Rate
-
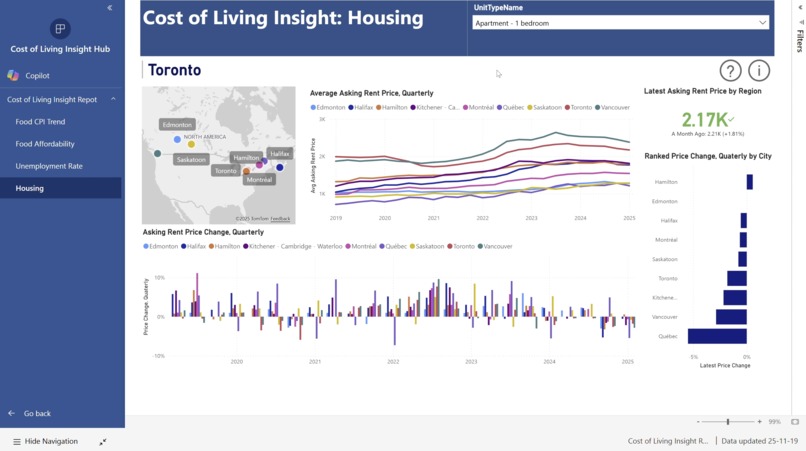
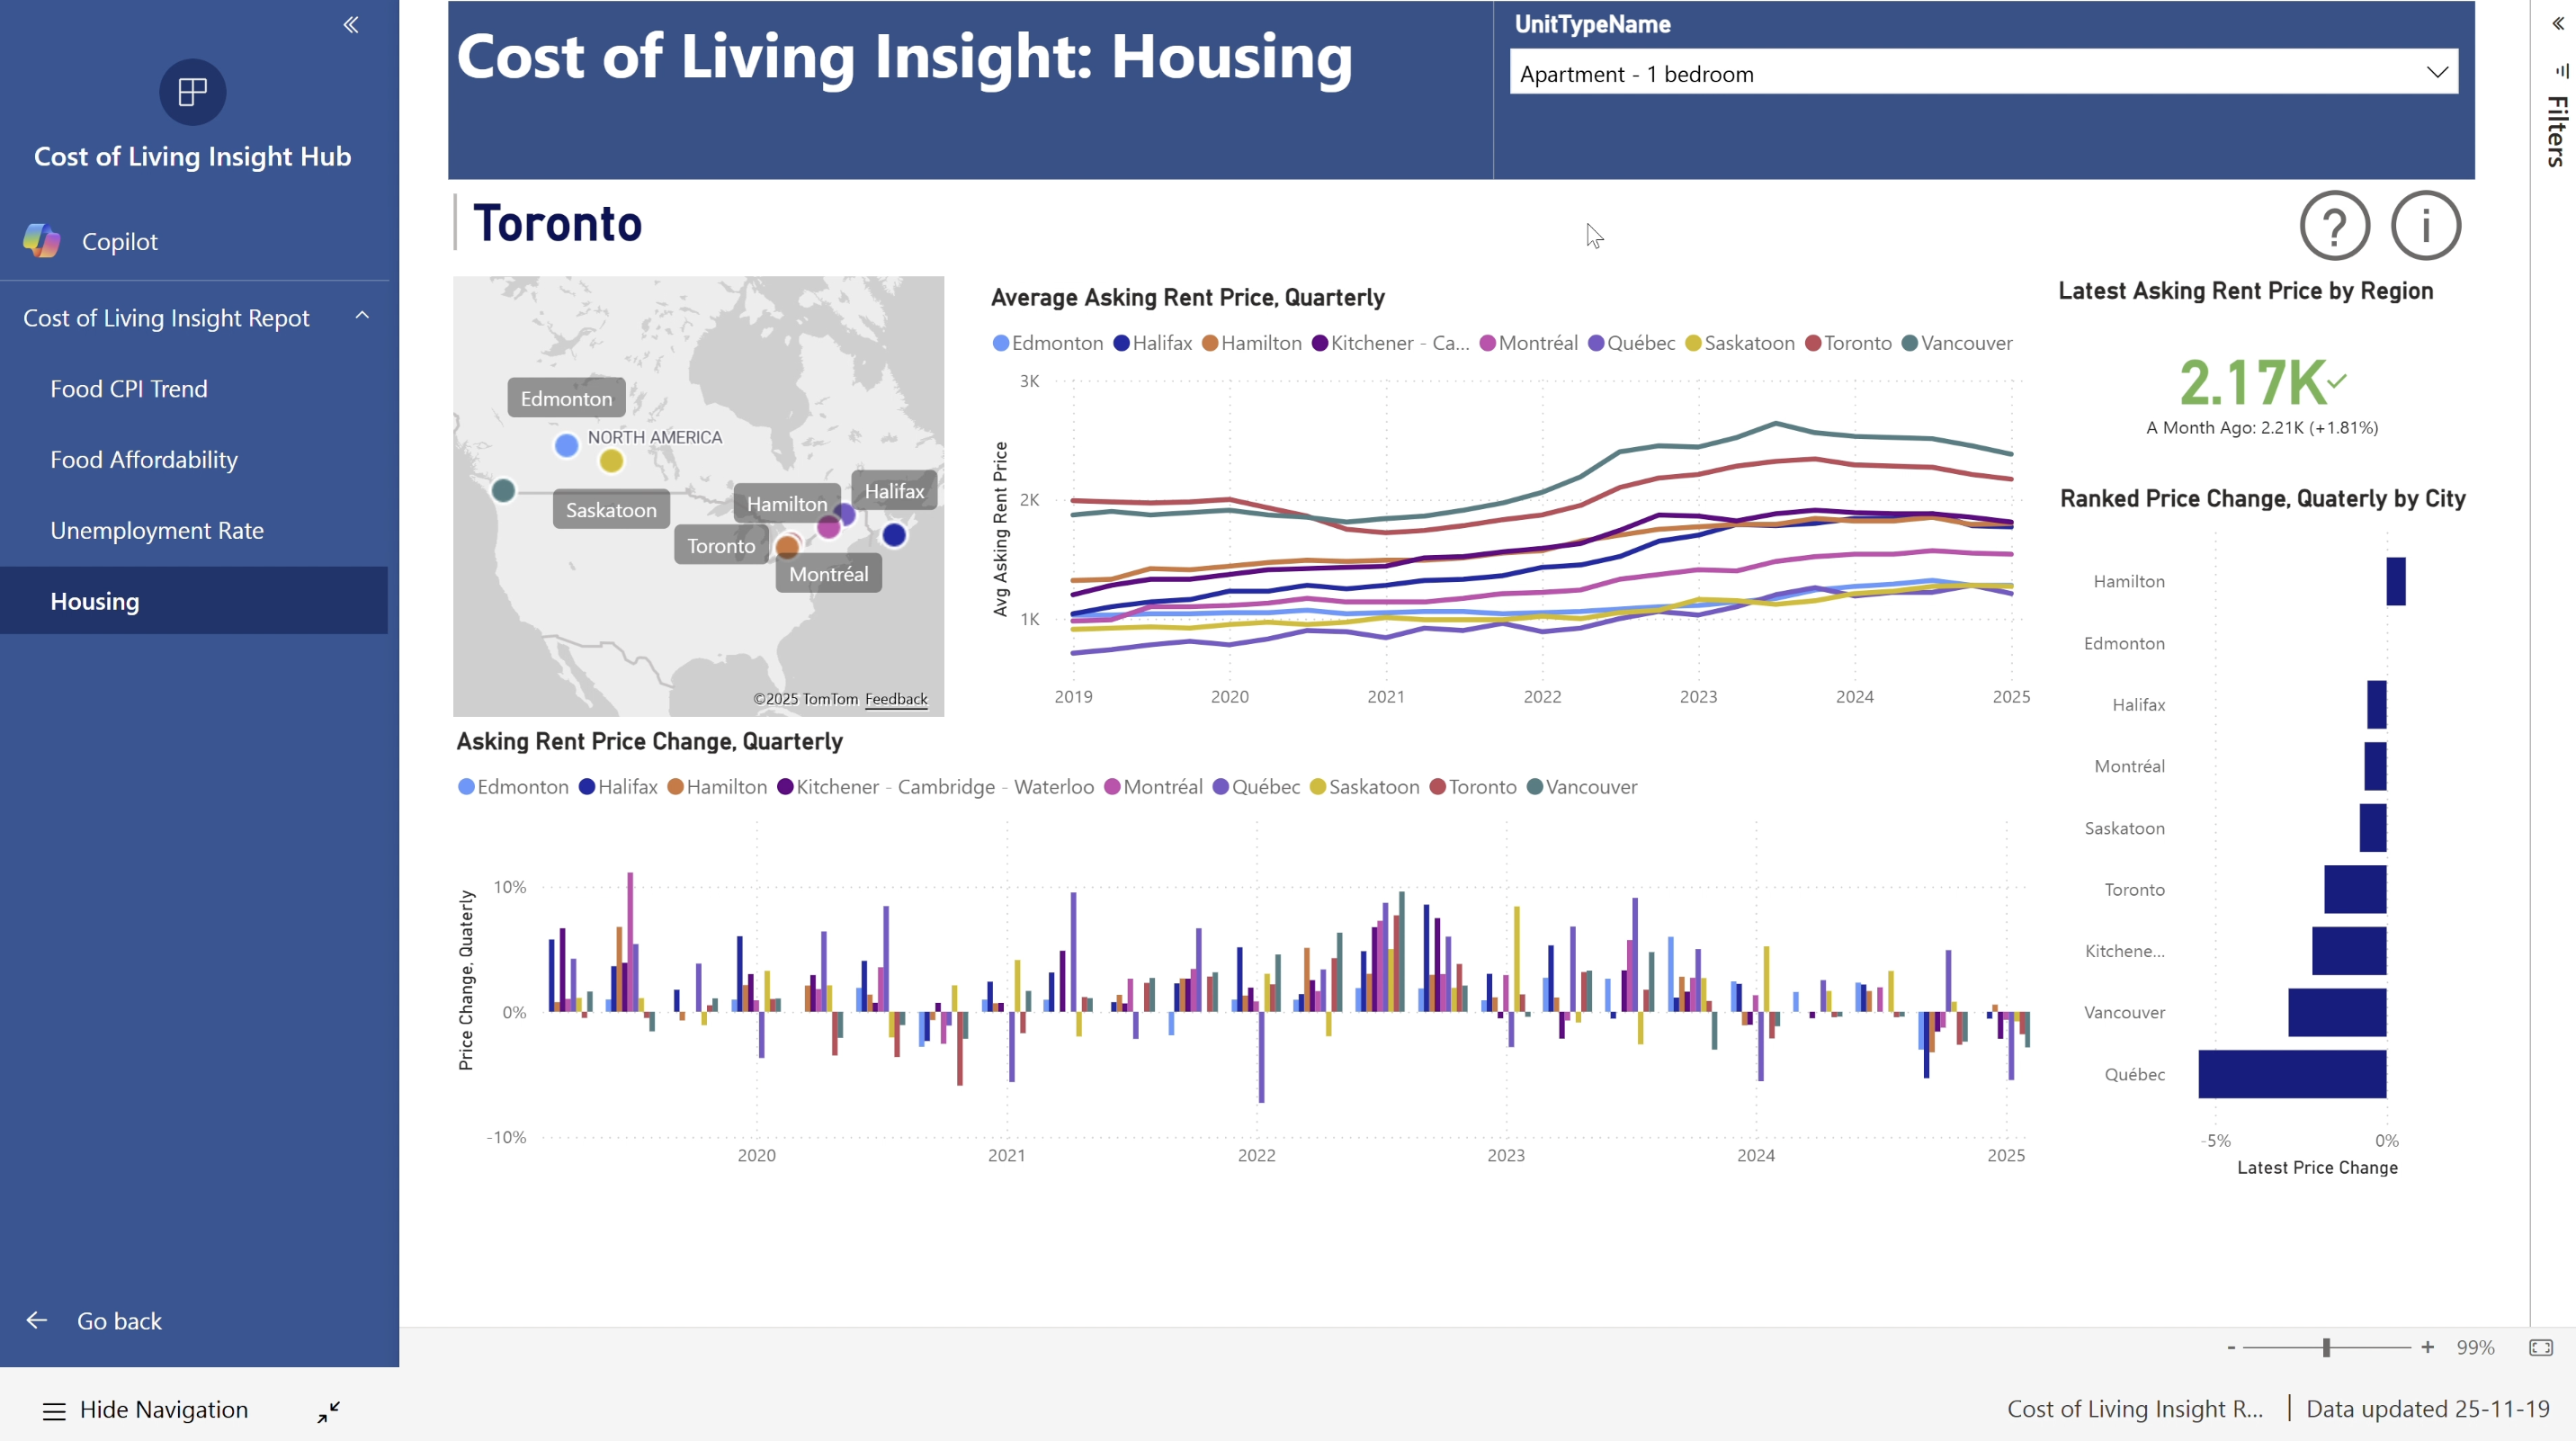
Housing
Inspiration
With the rising cost of living and inflation across Canada, we wanted to build a solution that brings transparency to affordability. Our goal was to help Canadians better understand how housing, groceries, and employment conditions differ across the country — and how those factors shape everyday affordability.
What It Does
Our dashboard visualizes city-by-city affordability metrics using a custom Consumer Price Index (CPI) focused on:
- Housing affordability
- Grocery expenses
- Unemployment impact on cost of living
By consolidating these datasets, users can explore how affordability trends compare across major Canadian cities — all in one cohesive view.
How We Built It
We developed our end-to-end dashboard using:
- Power BI for visualization
- Microsoft Fabric for data integration
- PySpark for large-scale data transformations
- SQL for efficient querying
…and a lot of teamwork and caffeine ☕️✨
Challenges We Overcame
- Cleaning and validating thousands of dataset entries
- Ensuring reliable affordability metrics with evolving CPI data
- Balancing hackathon development with our day-to-day commitments
- Designing visualizations that are both meaningful and intuitive
Accomplishments We’re Proud Of
🏆 Placed 3rd in the hackathon! We’re especially proud of the impact and practicality this project can bring to real Canadians navigating today’s economy.
What We Learned
- Effective collaboration and trust can solve even the messiest data problems
- Data storytelling is just as important as accurate analysis
- No dataset is too big when the team is motivated 💪
What’s Next
We plan to expand our affordability indicators to include transportation, utilities, and wage statistics — so stay tuned for the next version of our dashboard! 📊🇨🇦
Built With
- fabric
- powerbi
- pyspark
- sql
