Inspiration
Our team was inspired by the large ranges of voter turnout across different precincts, and one of our priorities was finding out what factors caused that, particularly demographic information. We were also aware from the start what racial impacts have been on voter participation and how we might find those results showing up in this analysis, and made sure to consider those factors.
What it does
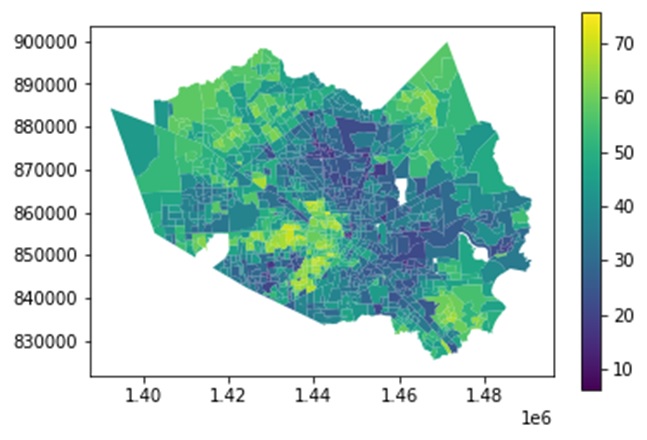
Our project determines which racial, ethnic, and age-group demographics of precincts in Harris County, and comparing those within BakerRipley's target area with those outside. This is in order to ascertain what their outreach program's impacts were on those regions, and what methods were most effective for them, in terms of cost, voter turnout rates, and increase from past years.
How we built it
We started by cleaning the datasets containing information on individual voters inside of and outside of the target precincts, by making sure that each voter ID only appeared once and that there was no inadmissible data points. Our primary goal after that was to get a sense of the rates of voter turnout in the target precincts, and how each method that BakerRipley used impacted those rates. We also wanted to look at which methods were most and least effective overall for BakerRipley, to ensure that future endeavors of theirs could continue to grow and be more efficient. After analyzing voter turnout rates within the target precinct, we then looked outside of that using data from the Texas Legislative Council that contained information on precinct racial demographics as well as people of voting age. We were also able to make use of Houston Public Health data to get age groups for voting individuals as well.
Challenges we ran into
Although we had easy access to the racial demographic data, we did not want to solely base analyses off of that as we understood the potential importance of other factors. It was not provided, but we were eventually able to locate age data on our own after extensive searching and brainstorming.
Accomplishments that we're proud of
- Visualizations: Chlorepeth Graph, Bubble Plot, Bar Charts
- Insightful conclusions were reached that could help Baker Ripley’s efforts
What we learned
- Cleaning Data, Collaboration, and Presentation Skills
- Learned additional methods to analyze data effectively
- How data sets should be transformed to generate models effectively
- How to create an insightful data story
What's next for Cost-Effective Analysis of GOTV Impact on Turnout
The next step for Team SaPHIra would be to obtain more data pertaining to more specific demographic information such as ages for registered voters and socioeconomic statuses for each precinct so that we can better analyze what exactly is affecting voter turnout and create a more holistic regression model based on those factors. Additionally, with more time we would be able to help BakerRipley implement our suggestions and analyze those results as well.
Built With
- geopandas
- github
- google-colab
- jupyter-notebook
- matplotlib
- python
- scikit-learn
- seaborn

Log in or sign up for Devpost to join the conversation.