The Inspiration: Seeing the System
The inspiration for Equity Lens didn't come from a single "aha!" moment, but from a slow-burning frustration with the state of Diversity, Equity, and Inclusion (DEI) in tech. We saw companies spending millions on DEI initiatives—unconscious bias training, hiring pledges, and internal task forces—yet the needle on representation and equity was moving painfully slowly.
We realized the problem wasn't a lack of will, but a lack of visibility. Bias isn't always a dramatic, malicious act; it's often baked into the very fabric of an organization's systems. It's in the gendered language of a job description that subtly discourages female applicants. It's in the vague criteria of a performance review that allows subjective "culture fit" to override objective achievement. It's in the promotion patterns that consistently favor one demographic group over another.
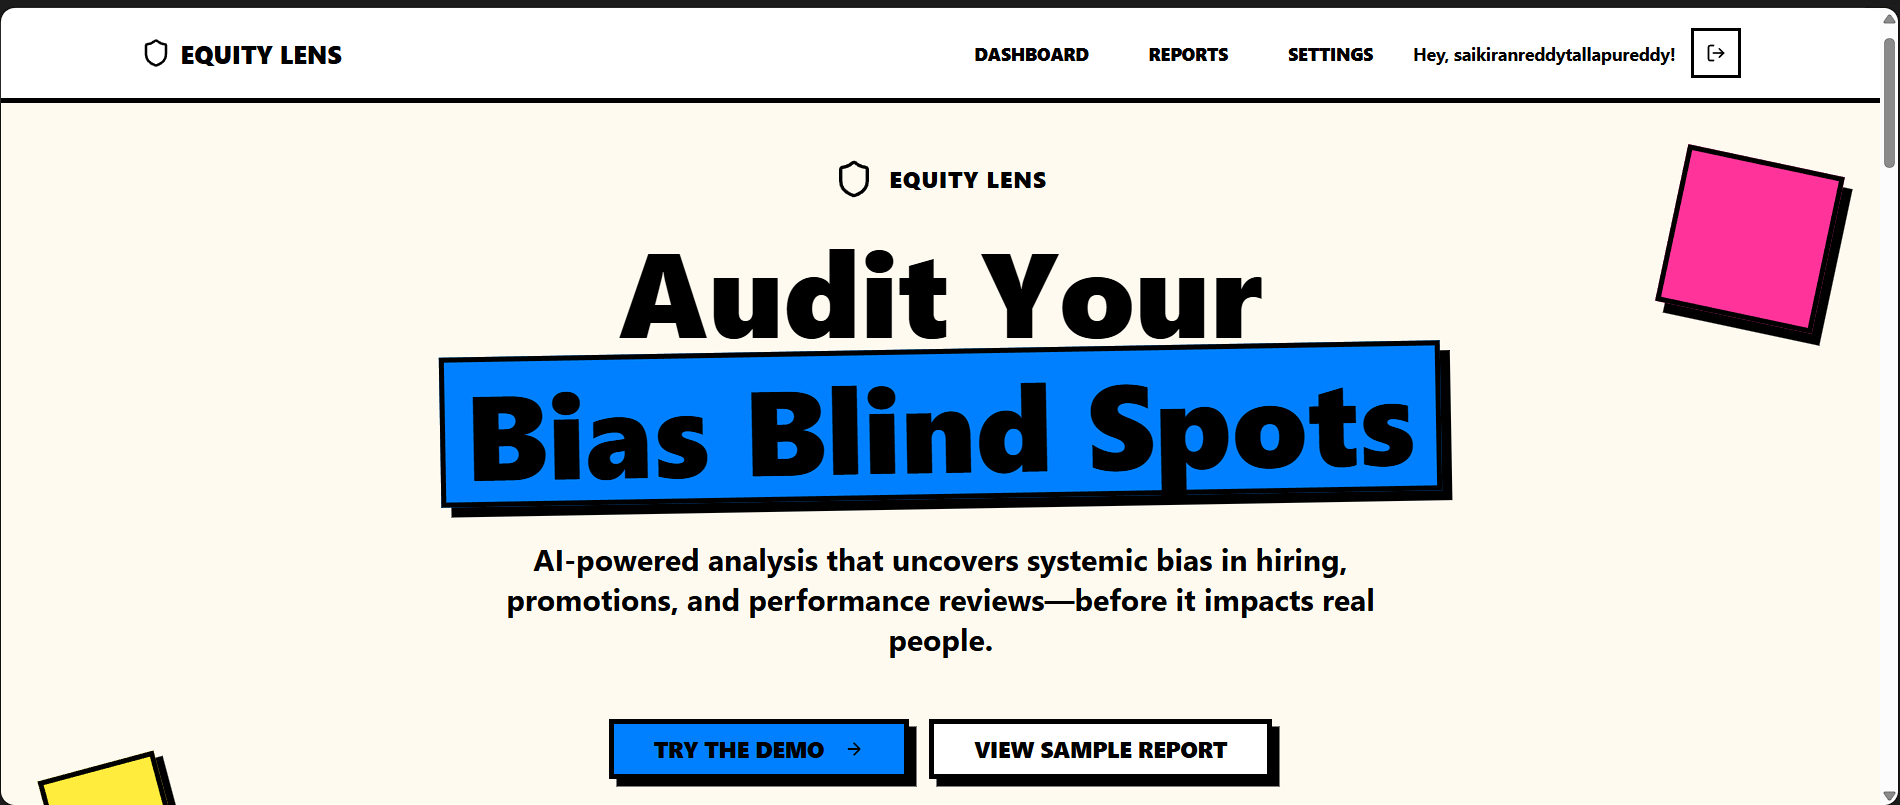
How can you fix a problem you cannot clearly see? Traditional surveys and manual audits are slow, subjective, and often fail to capture these systemic patterns. We were inspired to build a tool that could act as an X-ray for organizational equity, revealing the hidden skeletons in the corporate closet with data and precision.
What We Learned
Building Equity Lens was a profound learning journey that stretched far beyond code.
Bias is Quantifiable: We learned that systemic bias isn't an abstract concept. It manifests in linguistic patterns, statistical disparities, and network structures that can be measured. For example, the overuse of words like "aggressive" or "ninja" in job descriptions can be correlated with a decrease in applications from women. This can be represented as a probability, where a job description's "masculinity score" $M_d$ impacts the application rate $A_w$ from women:
\[
P(A_w) \propto \frac{1}{M_d}
\]
The Privacy-Insight Paradox: The most valuable data for detecting bias is also the most sensitive. We had to learn to build systems that could derive powerful insights from anonymized and aggregated data without ever storing or exposing individual employee information. Our approach relies on differential privacy principles, adding statistical noise
\(\epsilon\)to protect individual records while preserving cohort-level insights.The Human Must Be in the Loop: Technology can identify a pattern, but it takes human wisdom to understand the context and implement a fair solution. We learned that our tool's greatest value isn't in automating decisions, but in augmenting human judgment with data-driven evidence.
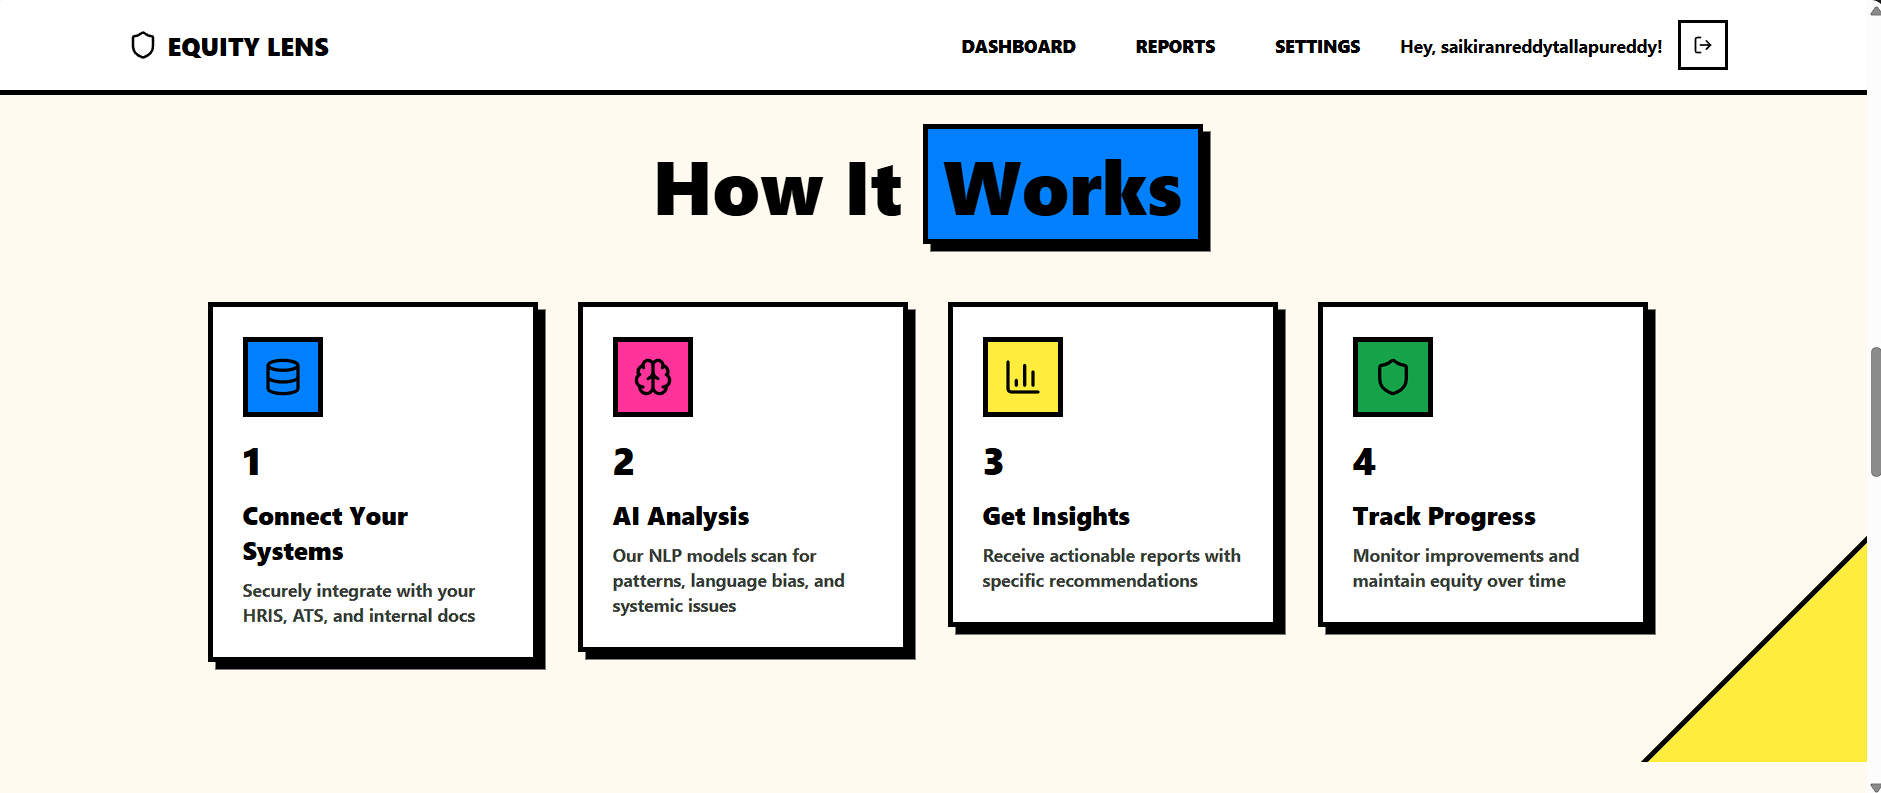
How We Built It
Equity Lens is a full-stack application built on a modern, secure, and scalable architecture.
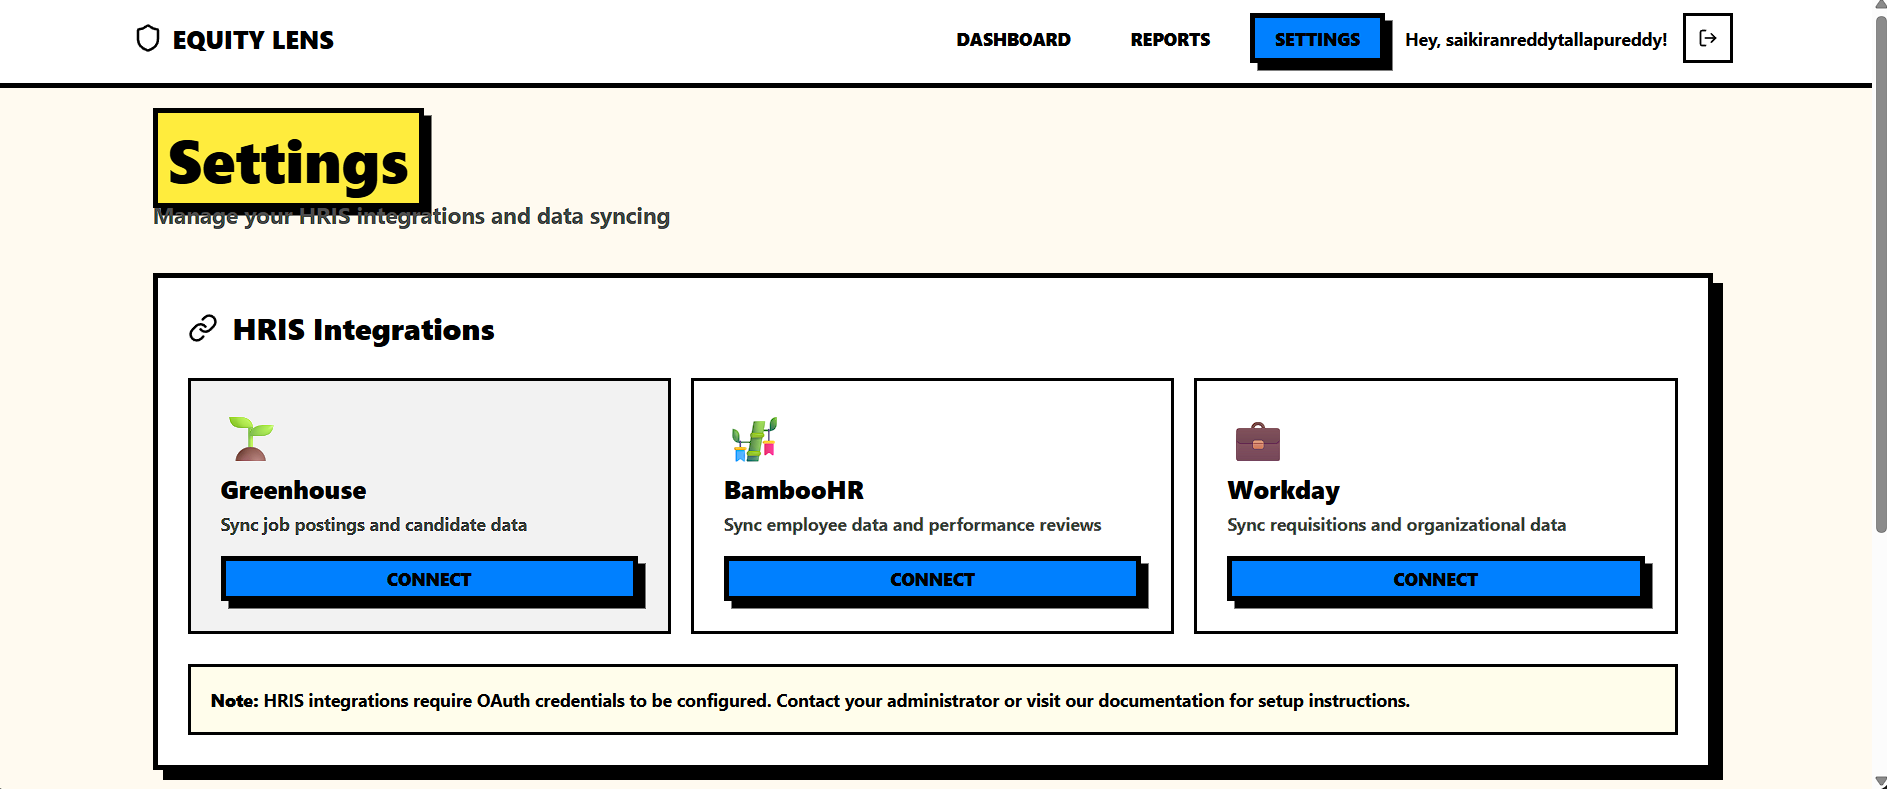
1. The Data Ingestion Layer:
- We built secure, read-only connectors to common HR Information Systems (HRIS) like Workday and Greenhouse using their REST APIs.
- All data is anonymized at the point of ingestion. Personal identifiers are hashed and replaced with universal unique identifiers (UUIDs).
2. The AI Analysis Engine (The Core):
- Natural Language Processing (NLP): We fine-tuned transformer-based models (like BERT) on a custom corpus of academic research on biased language to classify text in job descriptions, performance reviews, and internal communications.
- Statistical Analysis: We built a pipeline to calculate key equity metrics, such as the impact of demographic factors
\(D\)on promotion rates\(P\)while controlling for performance scores\(S\):\[ \logit(P(promotion)) = \beta_0 + \beta_1 D + \beta_2 S + \epsilon \] - Anomaly Detection: We used unsupervised learning algorithms to detect outliers and patterns in compensation and promotion data that deviate from equitable norms.
3. The Frontend Dashboard:
- Built with React and TypeScript for a robust, type-safe user experience.
- D3.js for generating interactive, clear visualizations of equity metrics and trends over time.
- The UI is designed with WCAG AA accessibility standards from the ground up.
Tech Stack: Python (FastAPI), PostgreSQL, React/TypeScript, Docker, AWS, Hugging Face Transformers.
Challenges We Faced
The "Black Box" Problem: Early on, our models could detect bias but couldn't explain why. A manager wouldn't trust a system that just says "this performance review is biased." Our biggest technical challenge was implementing model explainability (XAI) techniques like SHAP values to highlight the specific words and phrases that contributed to the bias score, making our findings transparent and actionable.
Data Sparsity and Imbalance: In many companies, the number of employees from underrepresented groups is small. Training accurate models on such imbalanced data was difficult. We had to employ advanced techniques like synthetic minority oversampling (SMOTE) and stratified cross-validation to ensure our models were fair and accurate for all demographic groups.
Building Trust: Our biggest non-technical challenge was overcoming the natural fear and skepticism from potential users. People were afraid of being "graded" by an AI or that their data would be misused. We addressed this through our core design principle: We audit systems, not people. We focused on aggregating data to protect anonymity and providing recommendations for process improvement, not for penalizing individuals.
Equity Lens is more than a project; it's our commitment to using our skills as engineers and builders to create a more just and equitable world, one workplace at a time.
Built With
- amazon-web-services
- apis
- base44
- claude
- deepseek
- python

Log in or sign up for Devpost to join the conversation.