CorVita: AI-Powered Coronary Artery Assessment with Explainable Machine Learning and Interactive 3D Visualization
Inspiration
Cardiovascular disease remains one of the world's leading causes of death, and Coronary Artery Disease (CAD) is a major contributor to serious cardiac complications. While traditional cardiovascular risk scores help estimate long-term risk, we were interested in a more specific question: Can machine learning estimate the likelihood of overall CAD and individual coronary artery involvement while explaining why a prediction was made?
Clinical data is complex, and interpreting multiple patient parameters alongside predicted outcomes can be challenging. We envisioned a system that combines the analytical capabilities of machine learning with the transparency of explainable AI and the clarity of interactive 3D visualization. Rather than presenting users with unexplained numerical scores, we wanted to create an intuitive platform where clinical inputs, predictive insights, and anatomical representations work together.
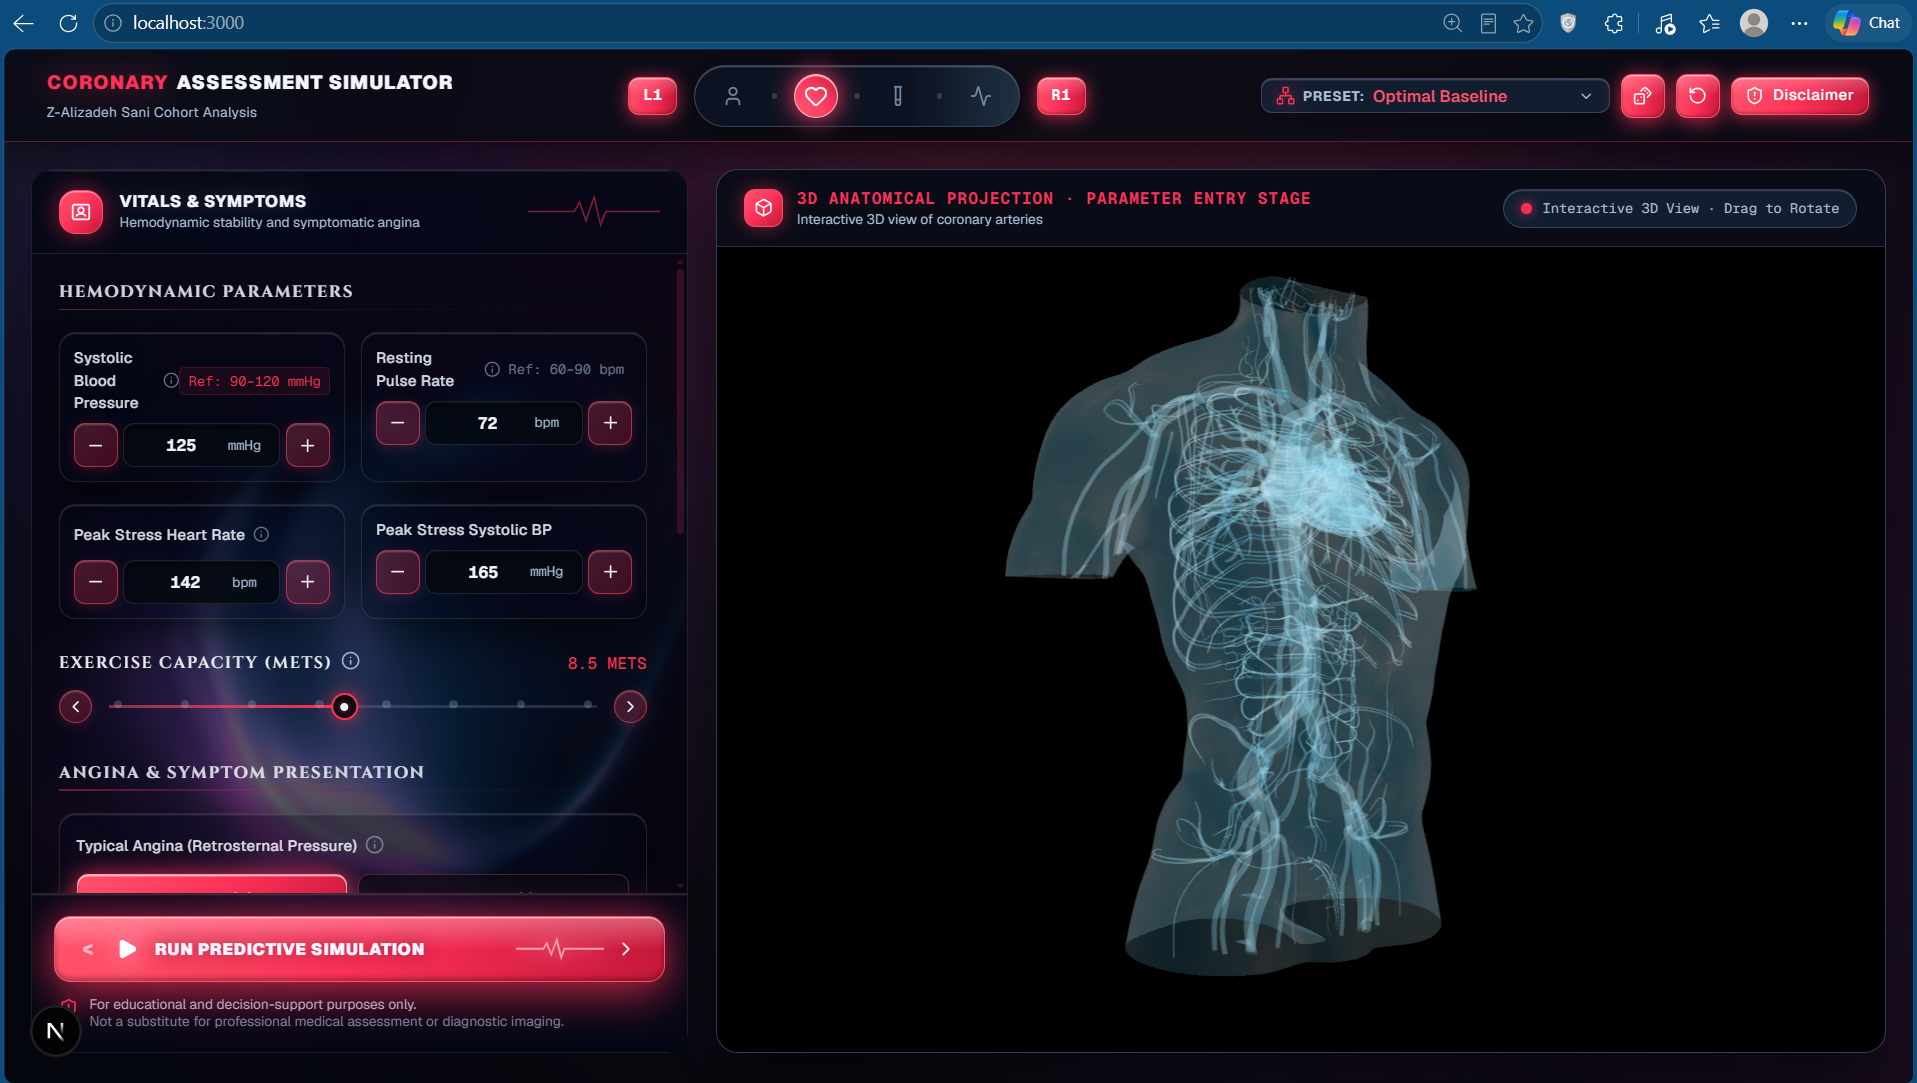
This vision led to CorVita, an intelligent cardiovascular assessment research prototype that brings together predictive machine learning, explainable AI, and interactive 3D cardiac anatomy to make complex clinical data easier to explore, understand, and interpret.
How We Built It
CorVita is built around three integrated components: a modern frontend, a machine learning inference engine, and an interactive 3D visualization system.
1. Machine Learning Engine
We developed our predictive pipeline using the Z-Alizadeh Sani Coronary Artery Disease dataset, containing 303 patient records and 54 raw clinical attributes. Through preprocessing and feature engineering, the pipeline works with a 67-feature representation incorporating additional cardiovascular indicators.
The system predicts four outcomes:
- Cath: Overall CAD status, corresponding to at least 50% stenosis on catheterization.
- LAD: Left Anterior Descending artery involvement.
- LCX: Left Circumflex artery involvement.
- RCA: Right Coronary Artery involvement.
To capture relationships among clinical measurements, we engineered additional biomarkers, including the atherogenic index, triglyceride-to-HDL ratio, rate-pressure product, pulse pressure, neutrophil-to-lymphocyte ratio, and other derived indicators.
For example, the atherogenic index is calculated as:
$$ \text{AI} = \frac{\text{LDL}}{\text{HDL}} $$
The rate-pressure product, a measure related to cardiac workload, is represented as:
$$ \text{RPP} = \frac{\text{Systolic Blood Pressure} \times \text{Heart Rate}}{100} $$
We implemented a soft-voting ensemble combining four machine learning algorithms: Gradient Boosting, XGBoost, Random Forest, and Extra Trees. Instead of relying on a single classifier, the ensemble combines the probability estimates from its component models:
$$ P(y=1\mid\mathbf{x}) = \sum_{m=1}^{M} w_m P_m(y=1\mid\mathbf{x}), \qquad \sum_{m=1}^{M}w_m=1 $$
Here, (\mathbf{x}) represents a patient's clinical feature vector, (P_m) is the probability estimated by model (m), and (w_m) is its ensemble weight.
Data integrity was a core part of our approach. We excluded the four catheterization outcome labels from the input feature matrix and incorporated imputation and SMOTE-based class balancing within the training folds of our five-fold stratified cross-validation workflow to reduce data leakage.
2. Explainable AI with SHAP
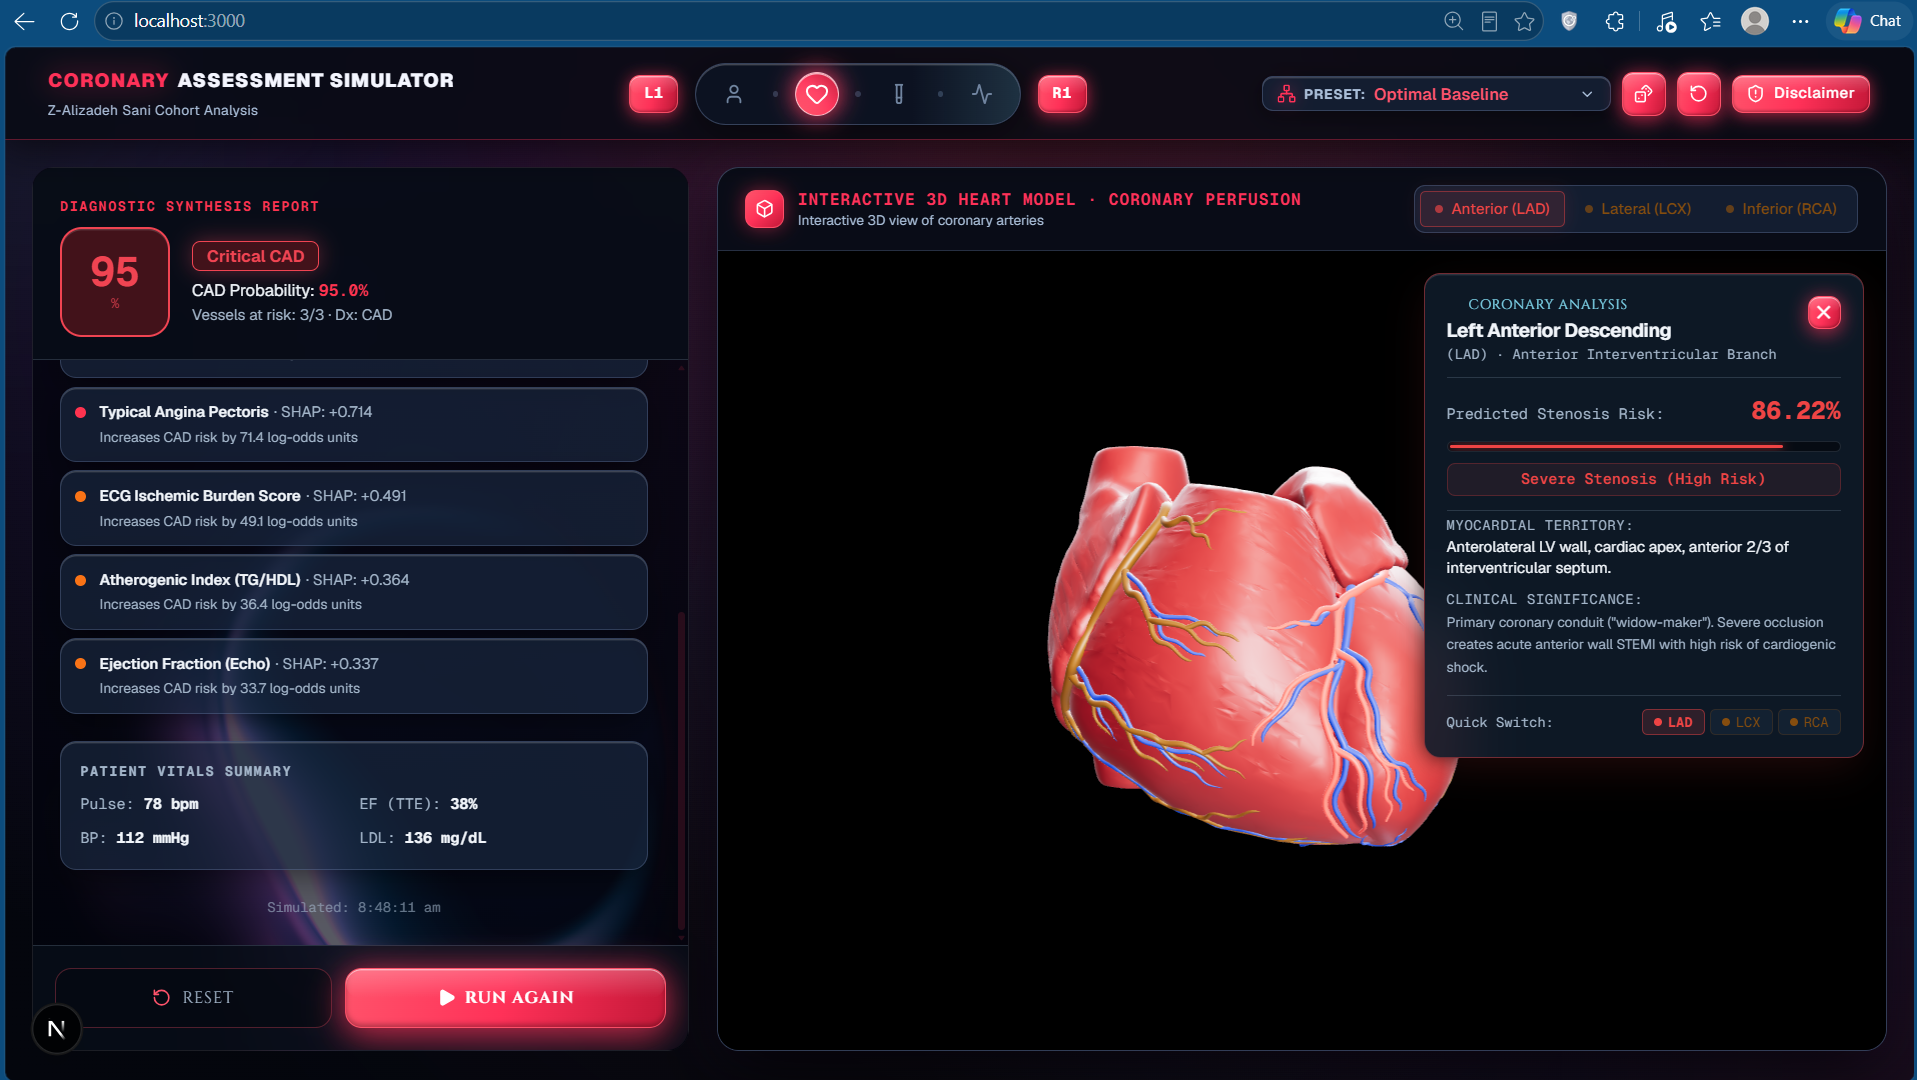
A probability alone does not tell us why a model produced a particular prediction. To address this, we integrated SHAP (SHapley Additive exPlanations) to estimate the contribution of individual clinical features to each prediction.
The SHAP value for feature (i) is defined as:
$$ \phi_i(\mathbf{x}) = \sum_{S\subseteq F\setminus{i}} \frac{|S|!(|F|-|S|-1)!}{|F|!} \left[ f_{\mathbf{x}}(S\cup{i})- f_{\mathbf{x}}(S) \right] $$
This formulation measures how a feature changes the model output across different combinations of other features. In CorVita, SHAP attributions help users explore the clinical inputs that contribute to predictions rather than viewing unexplained risk scores.
3. FastAPI Backend and Modern Frontend
The backend uses Python, FastAPI, and Uvicorn to load the saved model artifacts, validate incoming patient data, execute preprocessing and inference, and return predictions and feature-attribution information through REST APIs. Pydantic supports request validation, and the generated Swagger interface simplifies API inspection and testing.
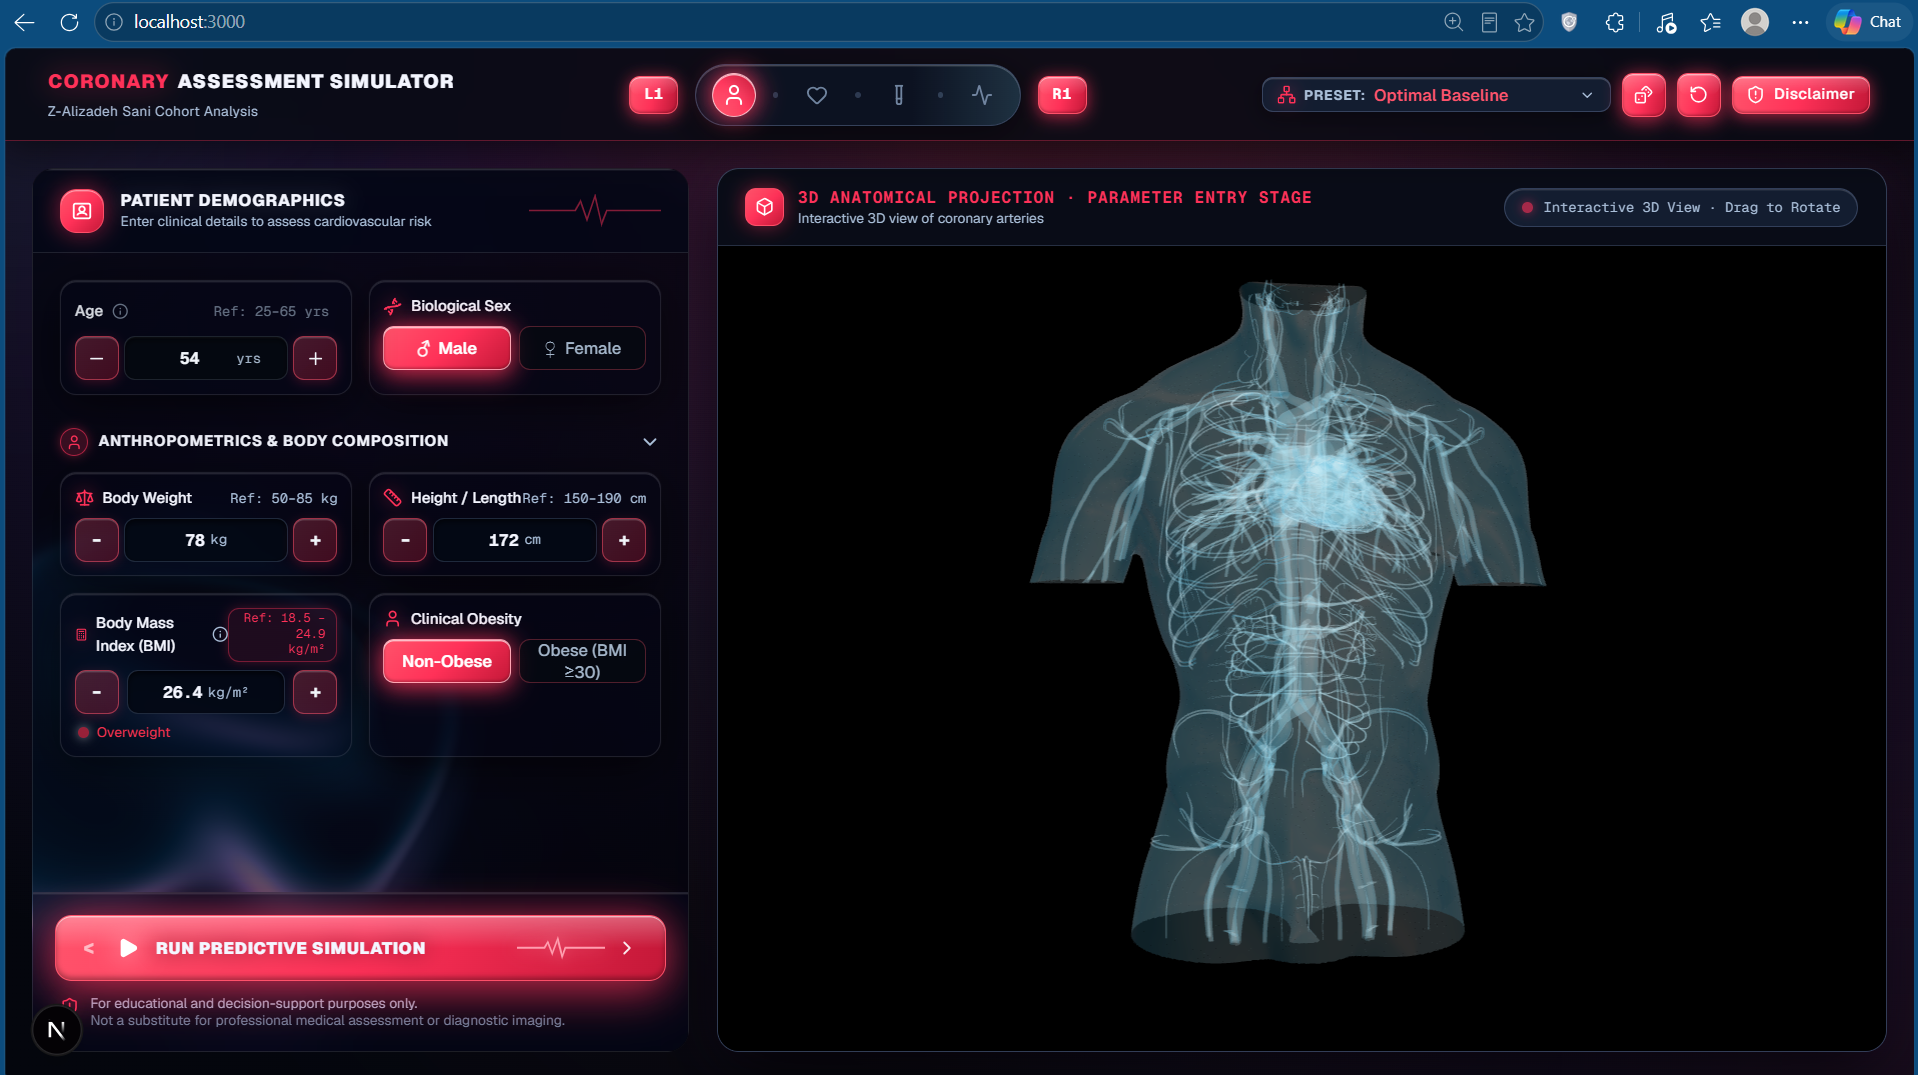
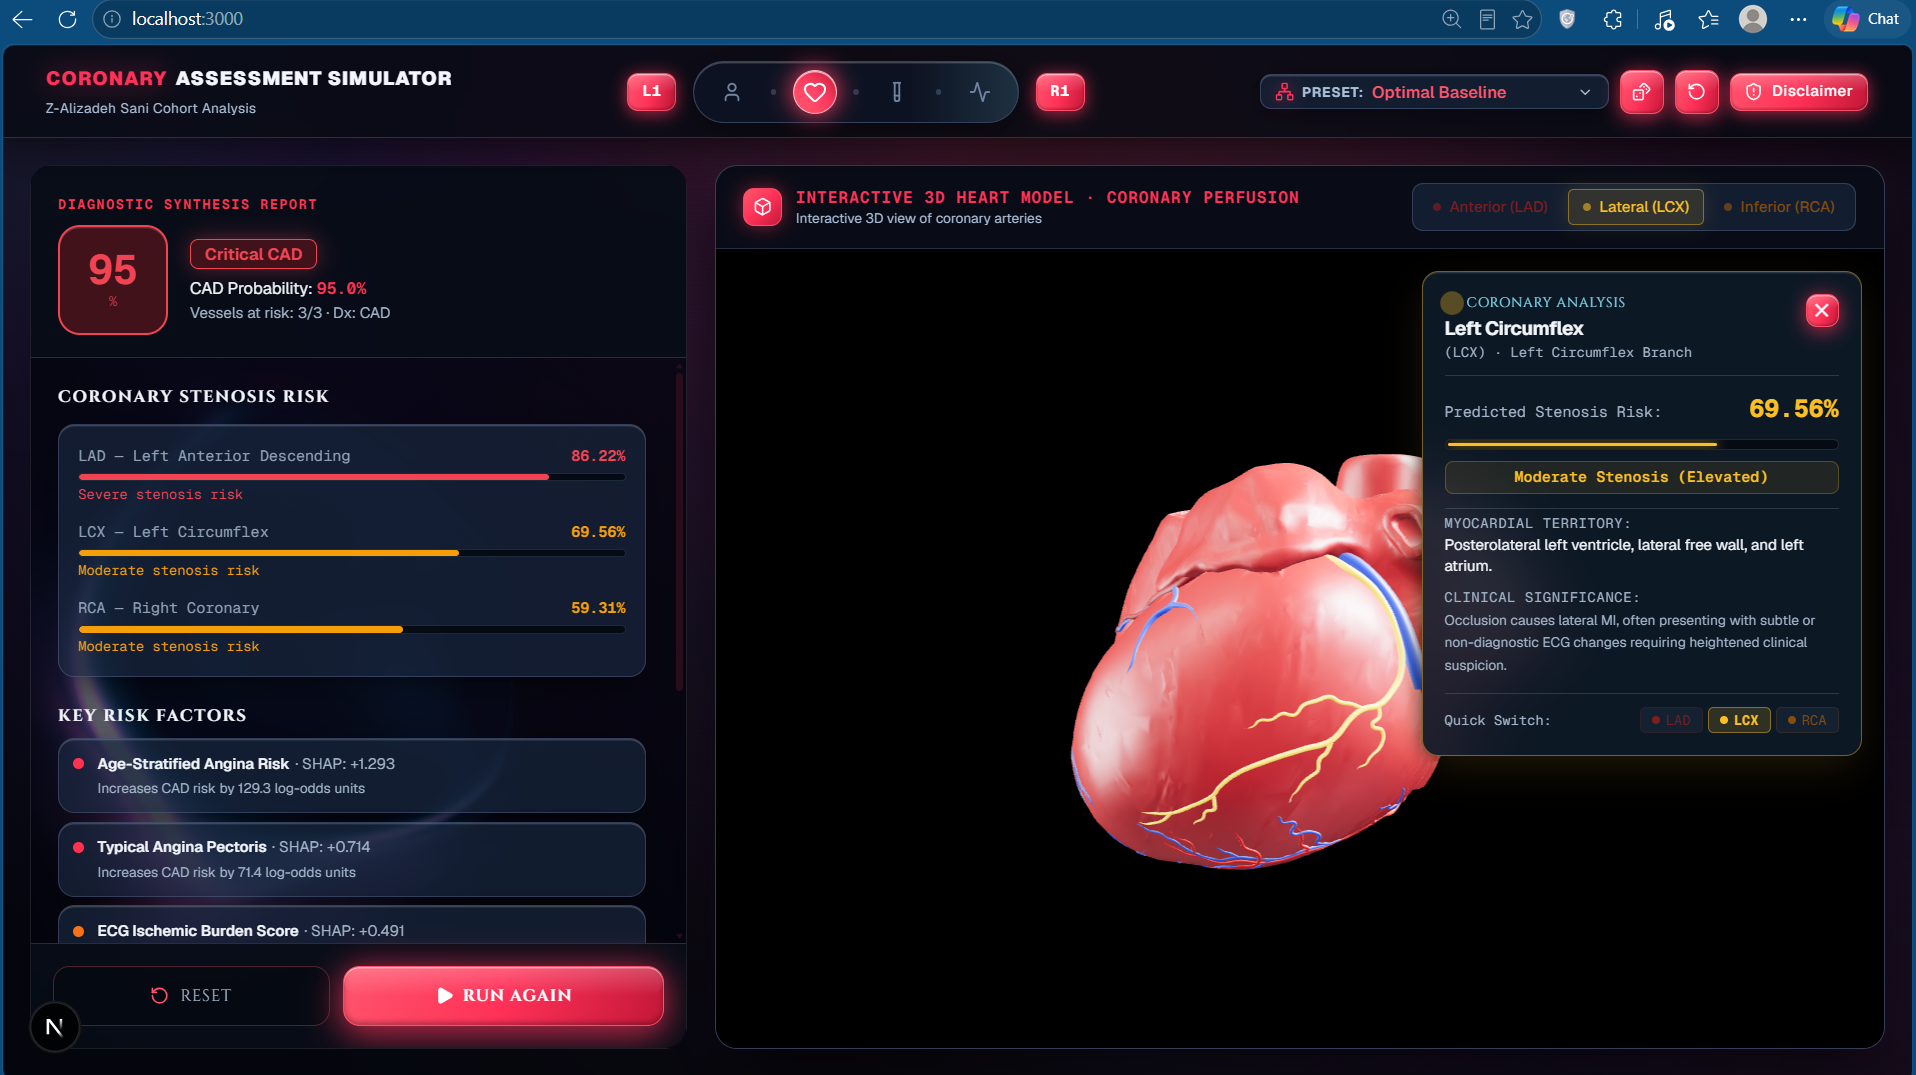
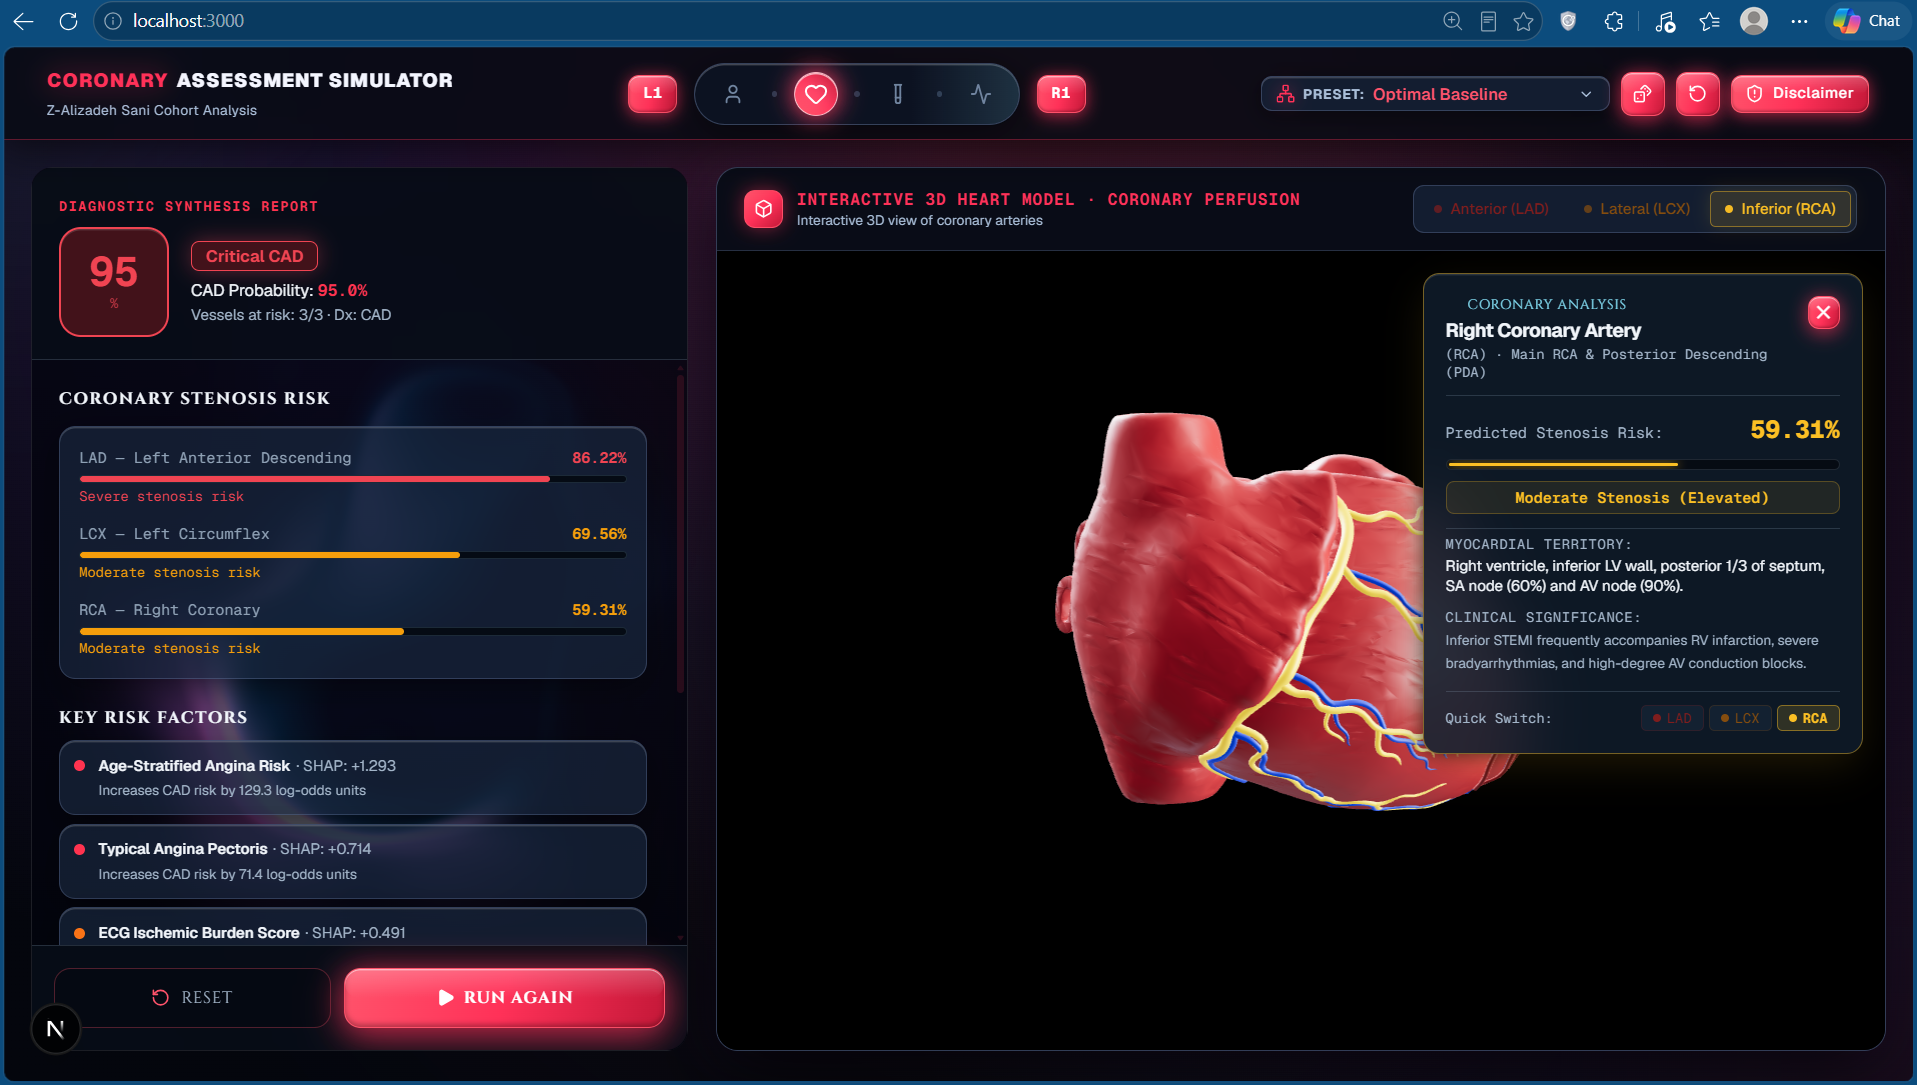
The frontend is built with Next.js 16, React 19, and TypeScript. We integrated Three.js, React Three Fiber, and Drei to render interactive 3D heart and torso models, while GSAP powers smooth camera transitions between the LAD, LCX, and RCA.
The interface uses a clean charcoal-and-gold visual theme, with clinical inputs organized into intuitive sections for demographics, vitals and symptoms, laboratory measurements, and ECG/echocardiography findings. Dynamic vessel materials and emissive effects visually distinguish different predicted probability ranges, while interactive controls make patient parameter adjustment and anatomical exploration straightforward.
We also implemented an offline heuristic fallback that allows the interface to remain interactive when the machine learning backend is unavailable. This fallback is separate from the trained models and should not be interpreted as equivalent to their predictions.
What We Learned
Reliable healthcare AI is about more than model accuracy. We learned that even sophisticated models can produce misleading evaluation results when preprocessing or resampling introduces data leakage. Keeping these operations within the training folds helped us build a more rigorous evaluation workflow.
We also discovered that overall CAD prediction and vessel-specific prediction present different challenges. Differences in class distributions and the limited number of patient records make individual artery predictions particularly challenging.
Integrating SHAP taught us how explainability can help communicate model behavior, while developing the full-stack application strengthened our experience with REST APIs, model serialization, dependency management, and the integration of Python-based machine learning with a TypeScript frontend.
Finally, working with 3D anatomical assets demonstrated that visual clarity requires significant engineering: geometry must be positioned correctly, cameras must transition smoothly, and WebGL resources must be managed carefully to maintain a responsive experience.
Challenges We Faced
Preventing target leakage: Clinical datasets can contain variables related to the very outcomes being predicted. We explicitly excluded Cath, LAD, LCX, and RCA from the feature matrix and structured preprocessing and SMOTE within the training folds.
Managing class imbalance: Predicting isolated vessel involvement was more difficult than predicting overall CAD because the target distributions differed. We incorporated SMOTE-based resampling into the training workflow and assessed the outcomes separately.
Making predictions interpretable: Raw probability scores offer limited insight into model behavior. Integrating SHAP required connecting feature attribution to the inference pipeline and presenting the resulting information in a way that users could explore alongside predictions.
Aligning complex 3D anatomy: The heart and torso GLB assets had to be centered, scaled, and positioned consistently. We used bounding-box and bounding-sphere calculations to improve alignment and created vessel-specific camera transitions for anatomical exploration.
Bringing the full stack together: Maintaining consistent feature schemas across preprocessing, saved models, backend endpoints, and frontend inputs required careful integration. We also needed to handle unavailable backend services and modern React/WebGL compatibility without sacrificing the user experience.
Results and Impact
CorVita combines multi-target coronary assessment, ensemble learning, explainable AI, and interactive 3D visualization in one research prototype.
Under our five-fold stratified cross-validation evaluation, the overall CAD model achieved 87.13% accuracy and a mean ROC-AUC of 0.920. The vessel-specific targets were evaluated independently, with different performance levels reflecting the challenges of predicting individual coronary artery involvement.
Accuracy is calculated as:
$$ \text{Accuracy} = \frac{TP+TN}{TP+TN+FP+FN} $$
Here, (TP), (TN), (FP), and (FN) represent true positives, true negatives, false positives, and false negatives. ROC-AUC measures a model's ability to distinguish positive and negative cases across classification thresholds.
These results are specific to our experimental dataset and evaluation workflow; they do not establish clinical effectiveness or generalizability to other populations. Independent external validation would be required before considering clinical use.
What makes CorVita meaningful to us is not simply the prediction score. It is the integration of machine learning, transparent explanations, and interactive anatomical visualization into a unified experience. We set out to make complex cardiovascular predictions easier to explore and understand, while recognizing the importance of rigorous validation and responsible use.
CorVita is designed for educational, academic, and research demonstration purposes. It does not replace clinical diagnosis, medical advice, or the judgment of qualified healthcare professionals.
Built With
- fastapi
- gsap
- joblib
- nextjs
- numpy
- pandas
- pydantic
- python
- react
- scikit-learn
- shap
- tailwind
- three.js
- typescript
- xgboost

Log in or sign up for Devpost to join the conversation.