
INSPIRATION ───────────
Clinical risk scores for coronary artery disease typically produce a single number — positive or negative — without showing which measurements drove the result or how individual vessels differ. A researcher reviewing a case has to cross-reference model outputs, measurement tables, and anatomy diagrams in separate tools. Context is lost at every handoff.
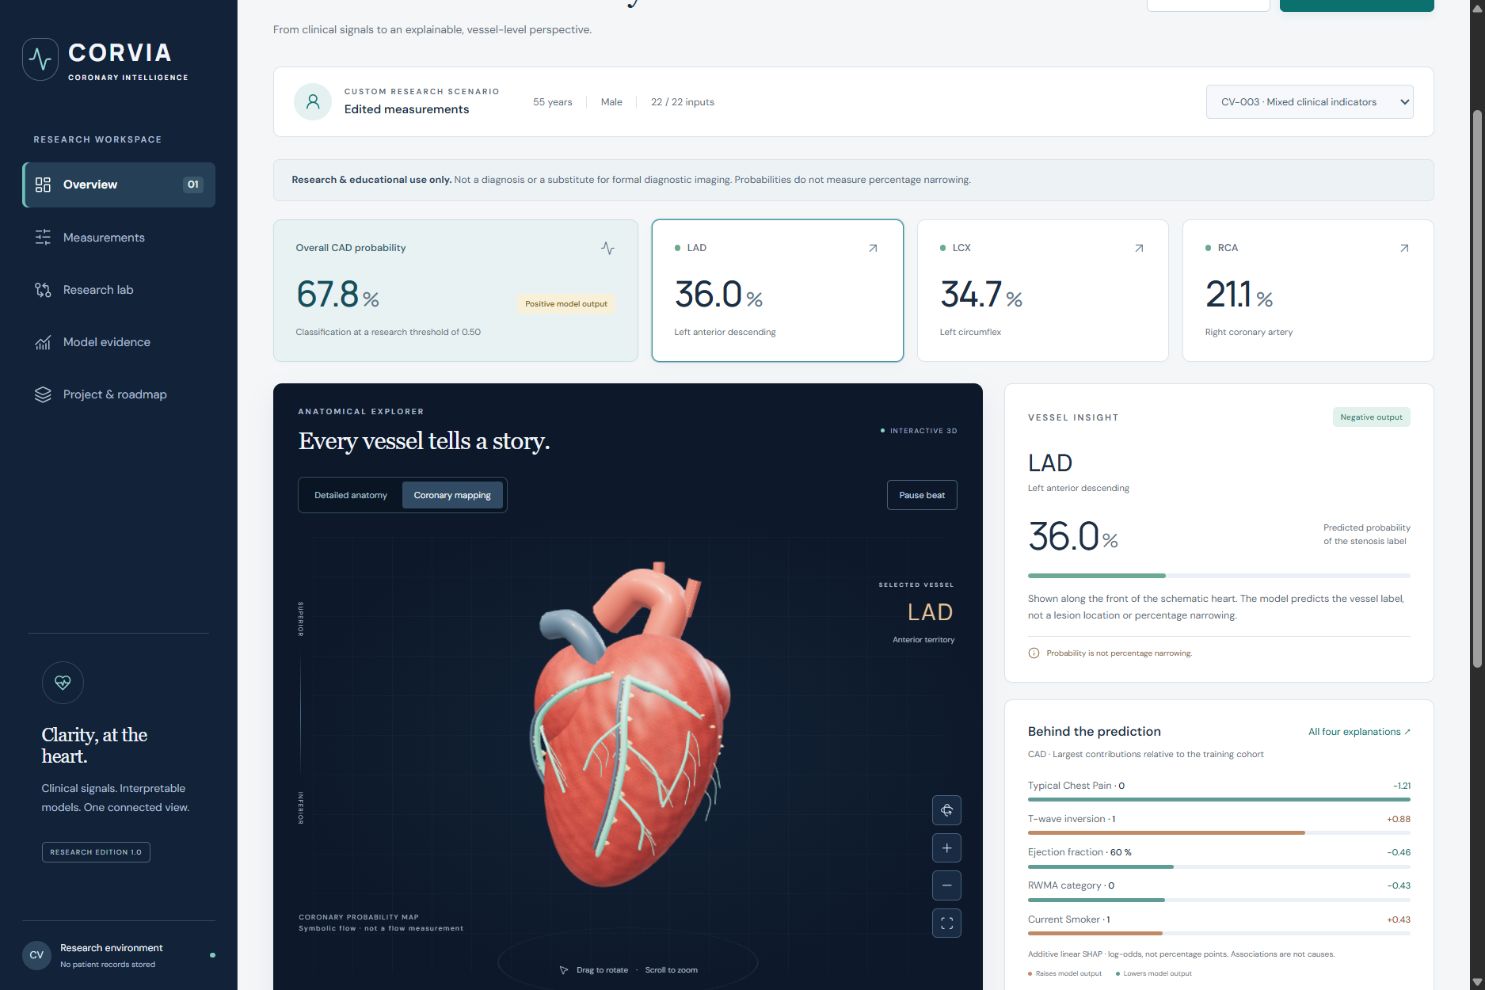
We wanted to build something that puts the measurement, its contribution to the model, the vessel-level output, and the model's known limits in one connected view. Not a black-box score, but a workspace where every prediction can be traced back to the inputs that produced it.
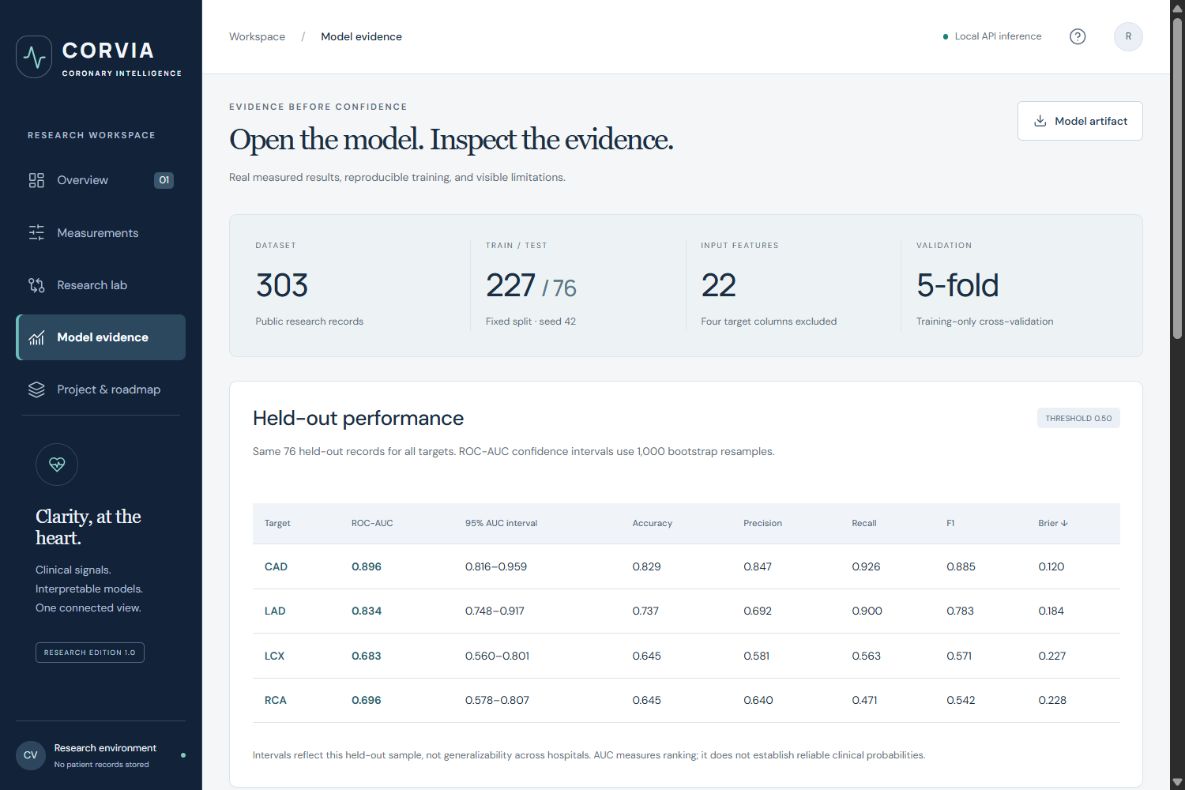
The publicly available UCI Z-Alizadeh Sani dataset (303 patient records, CC BY 4.0) gave us real clinical structure to work with — demographics, ECG findings, lab values, and echo measurements alongside angiographic labels for CAD, LAD, LCX, and RCA.
WHAT IT DOES ────────────
CORVIA takes 22 structured clinical measurements and runs them through four independent L2 logistic classifiers (one each for overall CAD, LAD, LCX, and RCA stenosis). For each prediction it produces:
- A probability and threshold classification
- Exact additive SHAP explanations in log-odds — contributions that sum to the model output to machine precision, not approximations
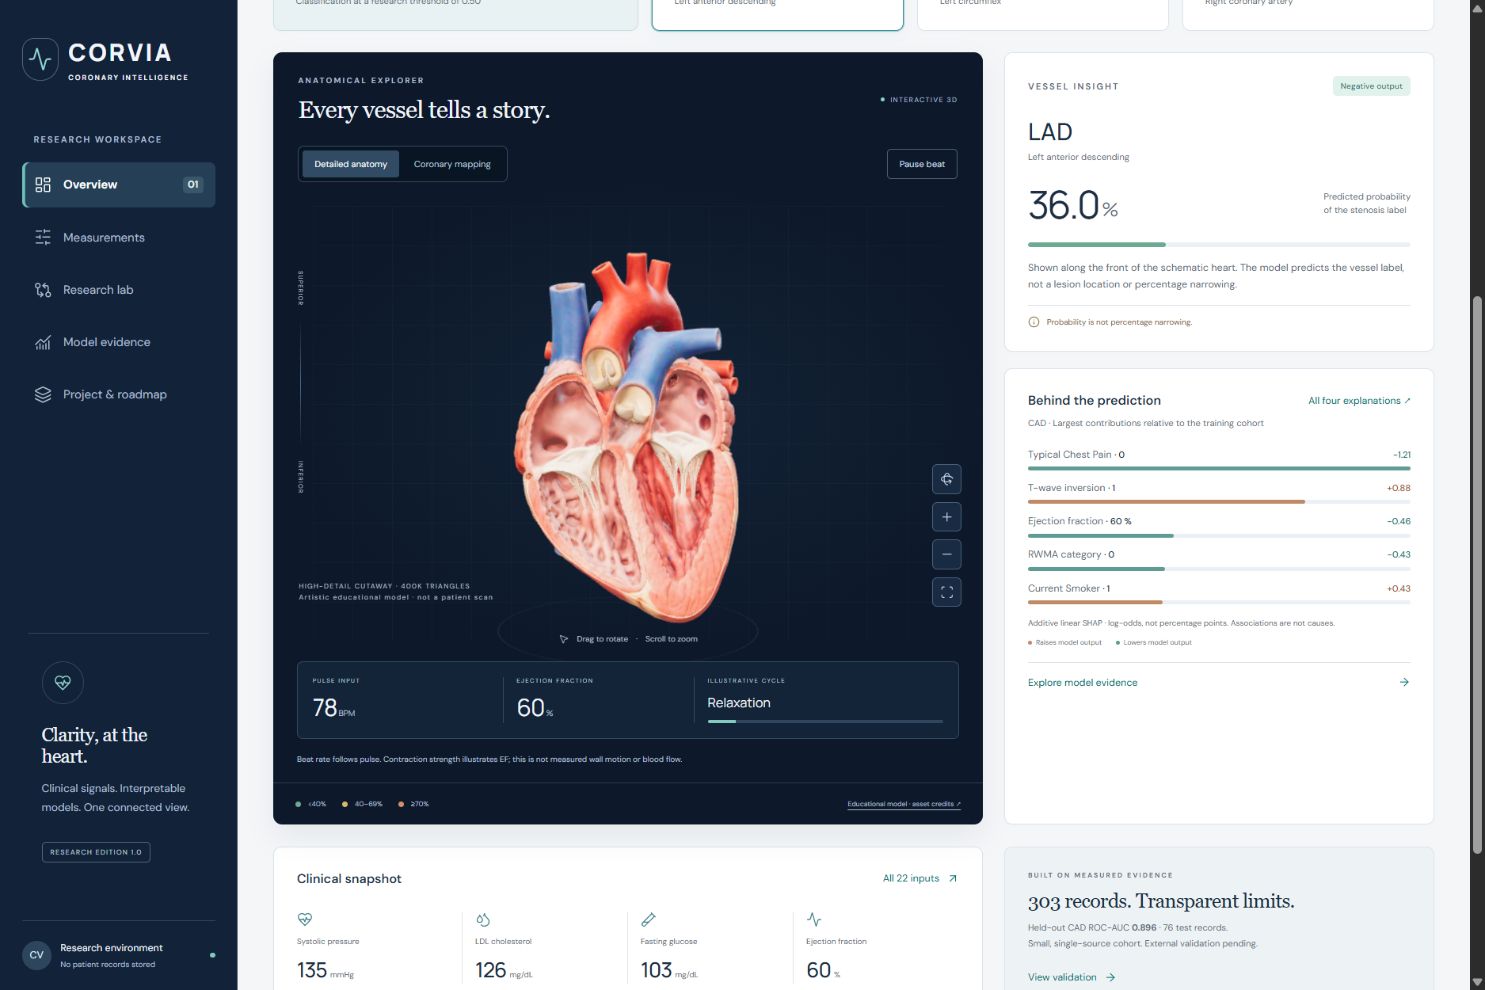
- An interactive 3D heart with two modes: a 400K-triangle textured cutaway with pulse-driven beat animation, and a procedural coronary schematic where vessel colors map directly to probabilities
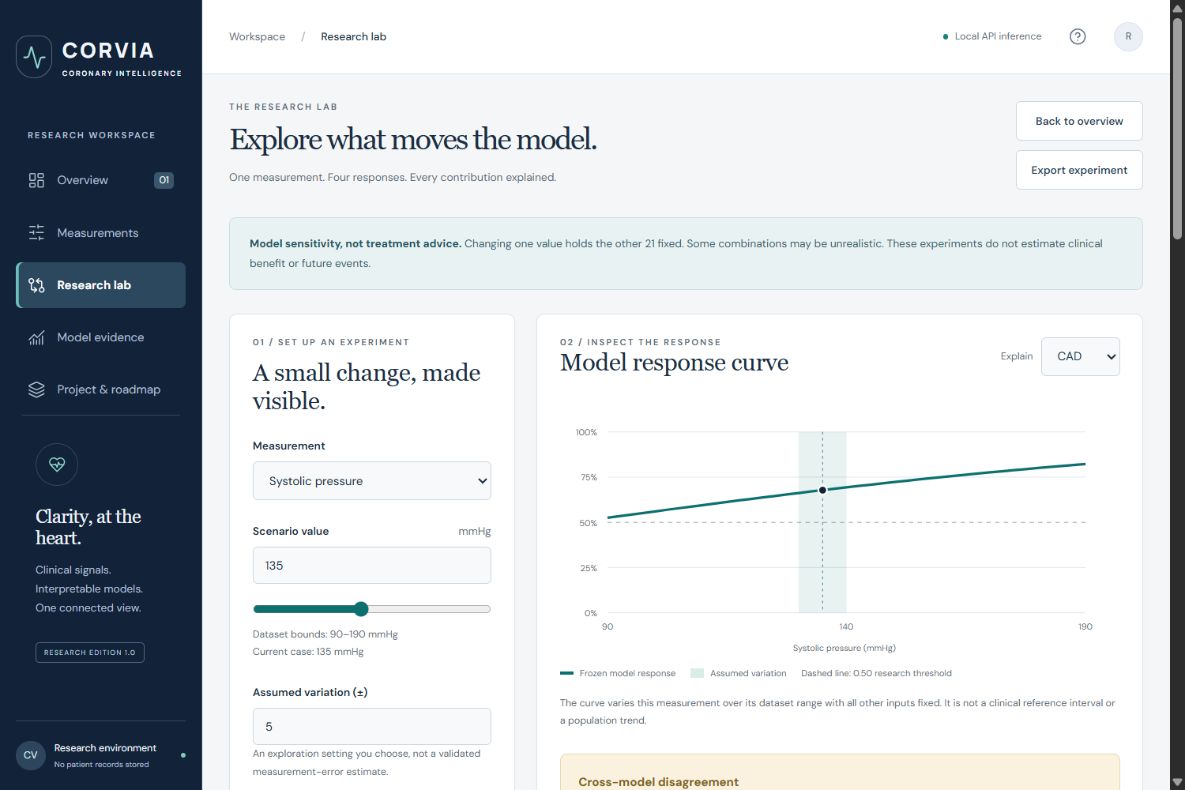
The Research Lab lets you vary one measurement across the full dataset range and see:
- Response curves for all four models simultaneously
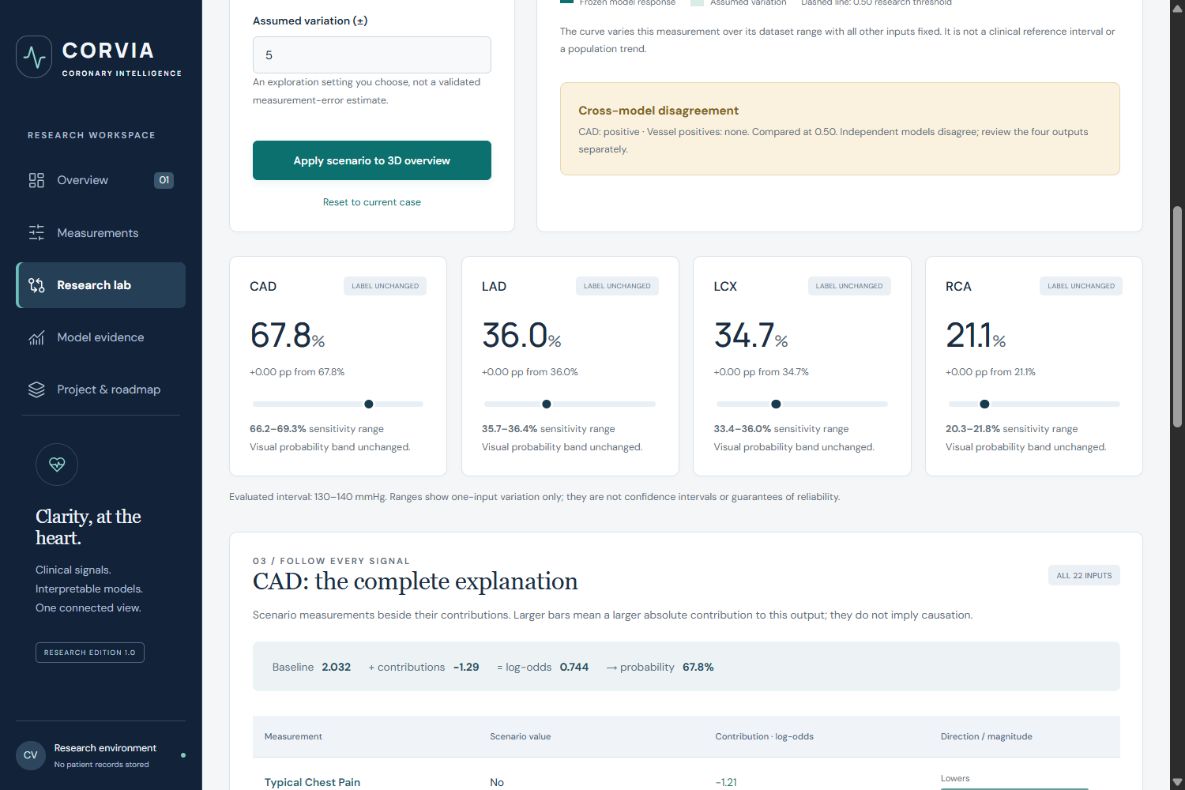
- Exact sensitivity envelopes (probability bounds) for an assumed measurement variation
- Threshold-flip and color-band-change flags
- Cross-model disagreement detection (when CAD and vessel labels contradict)
- A complete 22-row attribution table with reconciliation: baseline + Σ contributions = log-odds
Pin any scenario as a baseline, edit measurements, and compare probability deltas across all four targets — then hand off the scenario to the 3D overview with one click.
Everything runs deterministically with no external AI calls. Browser mode keeps inputs in tab memory. The local Node API serves identical predictions with rate limiting and security headers but stores nothing.
HOW WE BUILT IT ───────────────
Training pipeline — ml/train.py fits four independent LogisticRegression(C=0.2) models using scikit-learn. Preprocessing (StandardScaler + OneHotEncoder) is fitted inside each cross-validation fold. The dataset is split 227/76 stratified by CAD status with seed 42. All four target columns (LAD, LCX, RCA, Cath) are excluded from every feature matrix. The final frozen model — coefficients, intercepts, background means, schema, and holdout metrics — is exported to a single model.json artifact.
Shared inference — src/inference.js reimplements the exact sklearn pipeline in JavaScript: standardize numerics, one-hot encode categoricals, dot product with frozen coefficients, sigmoid. SHAP contributions are computed as (xᵢ − x̄ᵢ) · wᵢ in the transformed space, grouped by original feature. The same predict() function runs in the browser and on the Node server.
Cross-runtime verification — 12 held-out records × 4 targets = 48 probability values are checked against sklearn to 10⁻¹² tolerance. Contribution reconciliation, target exclusion, input validation, and API behavior are covered by 15 automated tests.
3D visualization — Three.js renders two heart modes. The detailed cutaway loads a CC0 GLTF model with GPU-driven ventricular contraction (vertex shader displaces geometry based on cardiac phase). Beat rate follows the Pulse Rate input; contraction amplitude follows Ejection Fraction. The coronary mapping mode uses procedural CatmullRomCurve3 tubes with instanced particle flow.
Sensitivity analysis — For a frozen additive logistic model, each feature's effect is monotonic. This means the probability bounds over any measurement interval are exactly the endpoint values — no Monte Carlo needed. src/research.js exploits this for instant, exact envelopes.
Production server — server.mjs is a zero-dependency Node.js HTTP server that serves the Vite-built static app and exposes POST /api/predict with CSP headers, CORS rejection, request size caps (16 KB), and per-IP rate limiting.
CHALLENGES WE RAN INTO ──────────────────────
Floating-point parity across Python and JavaScript — Reproducing sklearn's StandardScaler → OneHotEncoder → LogisticRegression pipeline in JavaScript required matching the exact encoding order of categorical features and ensuring no intermediate rounding. We set the parity tolerance at 10⁻¹² and run 48 cross-runtime checks on every test run. A single reordering of one-hot columns broke parity silently until we added the reconciliation assertion.
Explanation integrity — Additive SHAP contributions must sum exactly to the log-odds for the explanation to be trustworthy. Grouped contributions (multiple one-hot columns mapping back to one categorical feature) introduced rounding accumulation. We verify |baseline + Σcᵢ − logit| < 10⁻¹² for every prediction.
3D performance on integrated GPUs — The 400K-triangle GLTF cutaway looks great on dedicated GPUs but is a real risk on integrated hardware. We capped devicePixelRatio at 1.5, added the lightweight procedural coronary mode as a fallback, and made the cutaway load asynchronously so the app remains usable while it streams.
Sensitivity bounds without Monte Carlo — Realizing that a frozen linear logistic model is monotonic per feature was the key insight. But clipping at dataset boundaries (to avoid extrapolation beyond the training cohort) and handling edge cases where the tolerance interval extends past [min, max] required careful boundary logic.
ACCOMPLISHMENTS THAT WE'RE PROUD OF ────────────────────────────────────
- Exact explanations — not approximate, not sampled. Every SHAP bar reconciles to the model output to 10⁻¹².
- 48 cross-runtime parity checks passing between sklearn and JavaScript on every test run.
- Two 3D modes — a visually rich textured cutaway with cardiac animation and a clinically grounded coronary map with probability-driven colors, sharing a single selection and color system.
- Deterministic sensitivity analysis without Monte Carlo — instant exact bounds by exploiting model monotonicity.
- Cross-model disagreement detection — the app flags when CAD says positive but no vessel does (or vice versa), instead of hiding the inconsistency.
- Honest scope — every page states "Research & educational use only." The evidence page shows real metrics including the weaker LCX (AUC 0.683) and RCA (AUC 0.696) performance. Nothing is hidden.
WHAT WE LEARNED ───────────────
- Faithful cross-runtime model reproduction is harder than training the model. The verification infrastructure (parity fixtures, reconciliation assertions) took as much effort as the inference code itself.
- Monotonicity of individual features in linear logistic models is a powerful property that eliminates entire classes of computation — but only if you're disciplined about staying within the training distribution.
- Responsible ML communication is a design problem: showing confidence intervals, stating what the model cannot claim, and flagging disagreements matter as much as the predictions themselves.
- A 400K-triangle GLTF with embedded textures is ~13 MB — manageable over broadband but worth lazy-loading behind a lighter fallback view.
WHAT'S NEXT FOR CORVIA ──────────────────────
- Record the demo video — a six-minute walkthrough script is written (docs/DEMO-SCRIPT.md); recording and upload remain.
- External validation — evaluate on data from outside the current 303-record single-source cohort to test generalization.
- Probability calibration — add Platt scaling or isotonic regression; the current 0.50 threshold is a research convention, not a clinical cutoff.
- Institutional access controls — the app is currently stateless with no authentication; clinical pilot use needs role-based access, audit logging, and data governance.
- Integrated-GPU benchmarking — verify the detailed anatomy on target hardware and add a reduced-geometry fallback path if needed.


Log in or sign up for Devpost to join the conversation.