Inspiration
Our motivation for developing this project came from the need to make cardiovascular risk prediction more interpretable and visually meaningful. Coronary Artery Disease (CAD) involves the narrowing of coronary arteries, and understanding both overall disease risk and individual artery involvement can provide valuable insights for further medical evaluation.
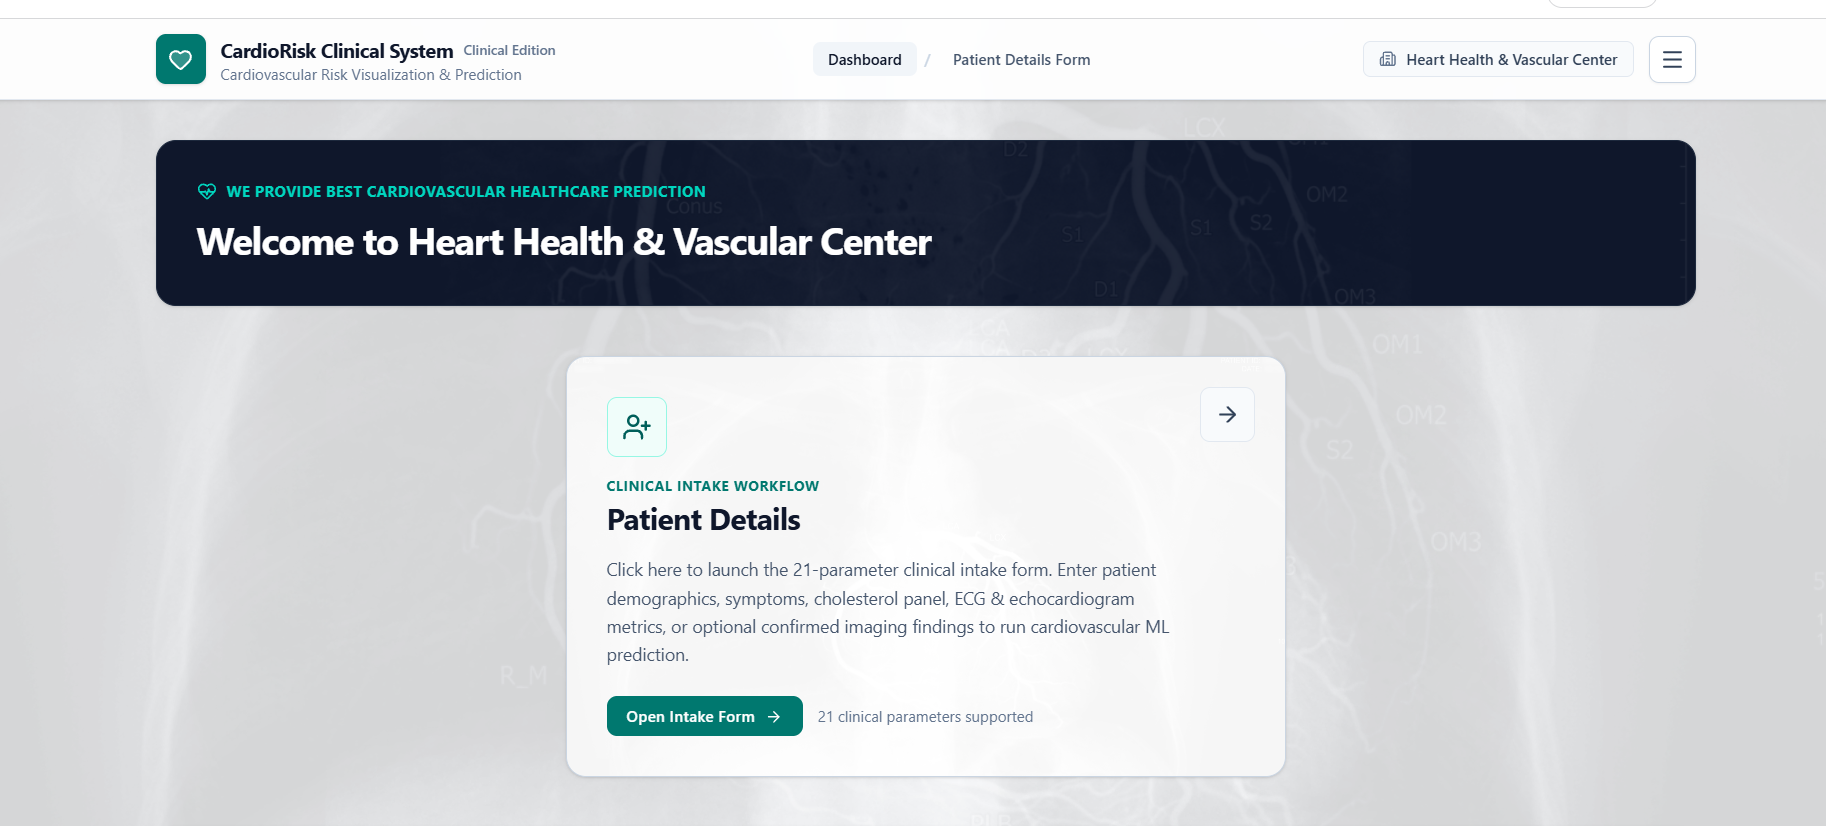
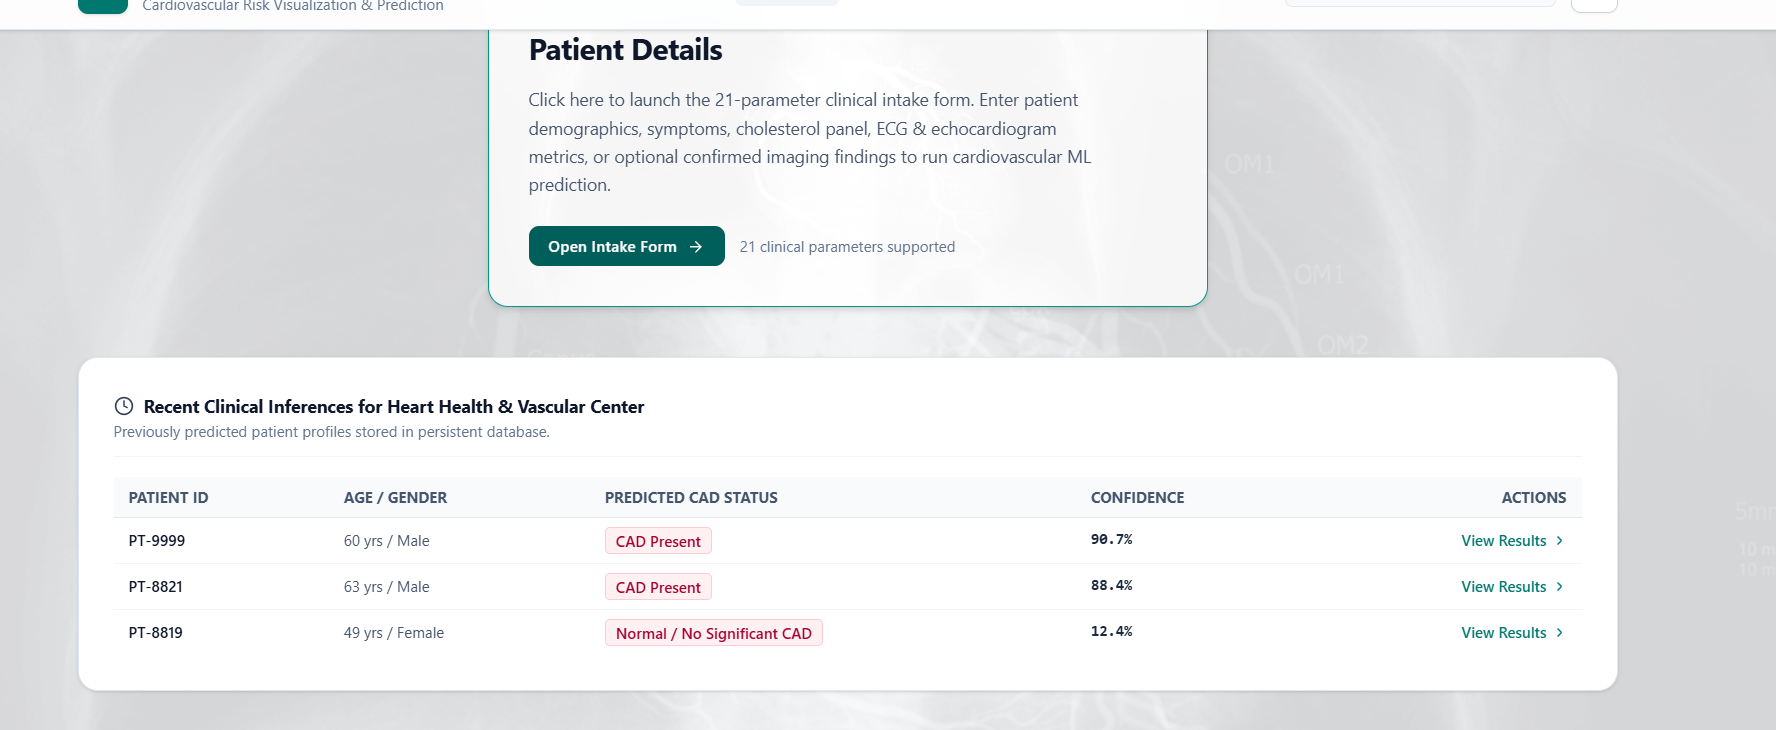
We wanted to explore how Machine Learning, Explainable AI, and 3D visualization could work together in a single platform. Instead of displaying only a prediction label or probability score, our goal is to connect clinical data with model predictions, feature-level explanations, and an interactive 3D representation of the heart.
What We Learned
During this project, we explored the complete machine learning workflow, including clinical data preprocessing, feature encoding, model training, cross-validation, and performance evaluation. We investigated gradient-boosting algorithms such as XGBoost, CatBoost, and LightGBM, along with Neural Networks, to identify suitable approaches for structured cardiovascular data.
We also learned the importance of preventing data leakage, maintaining proper train-test separation, and evaluating models using accuracy, precision, recall, F1-score, and ROC-AUC rather than relying on accuracy alone.
Another important learning experience was Explainable AI. We selected LIME (Local Interpretable Model-Agnostic Explanations) to investigate how individual clinical features contribute to a model's prediction. On the development side, we explored REST API integration with FastAPI, frontend development using React, and interactive 3D rendering using Three.js and React Three Fiber.
How We Built the Project
We designed a modular AI pipeline that connects machine learning predictions with an interactive clinical dashboard.
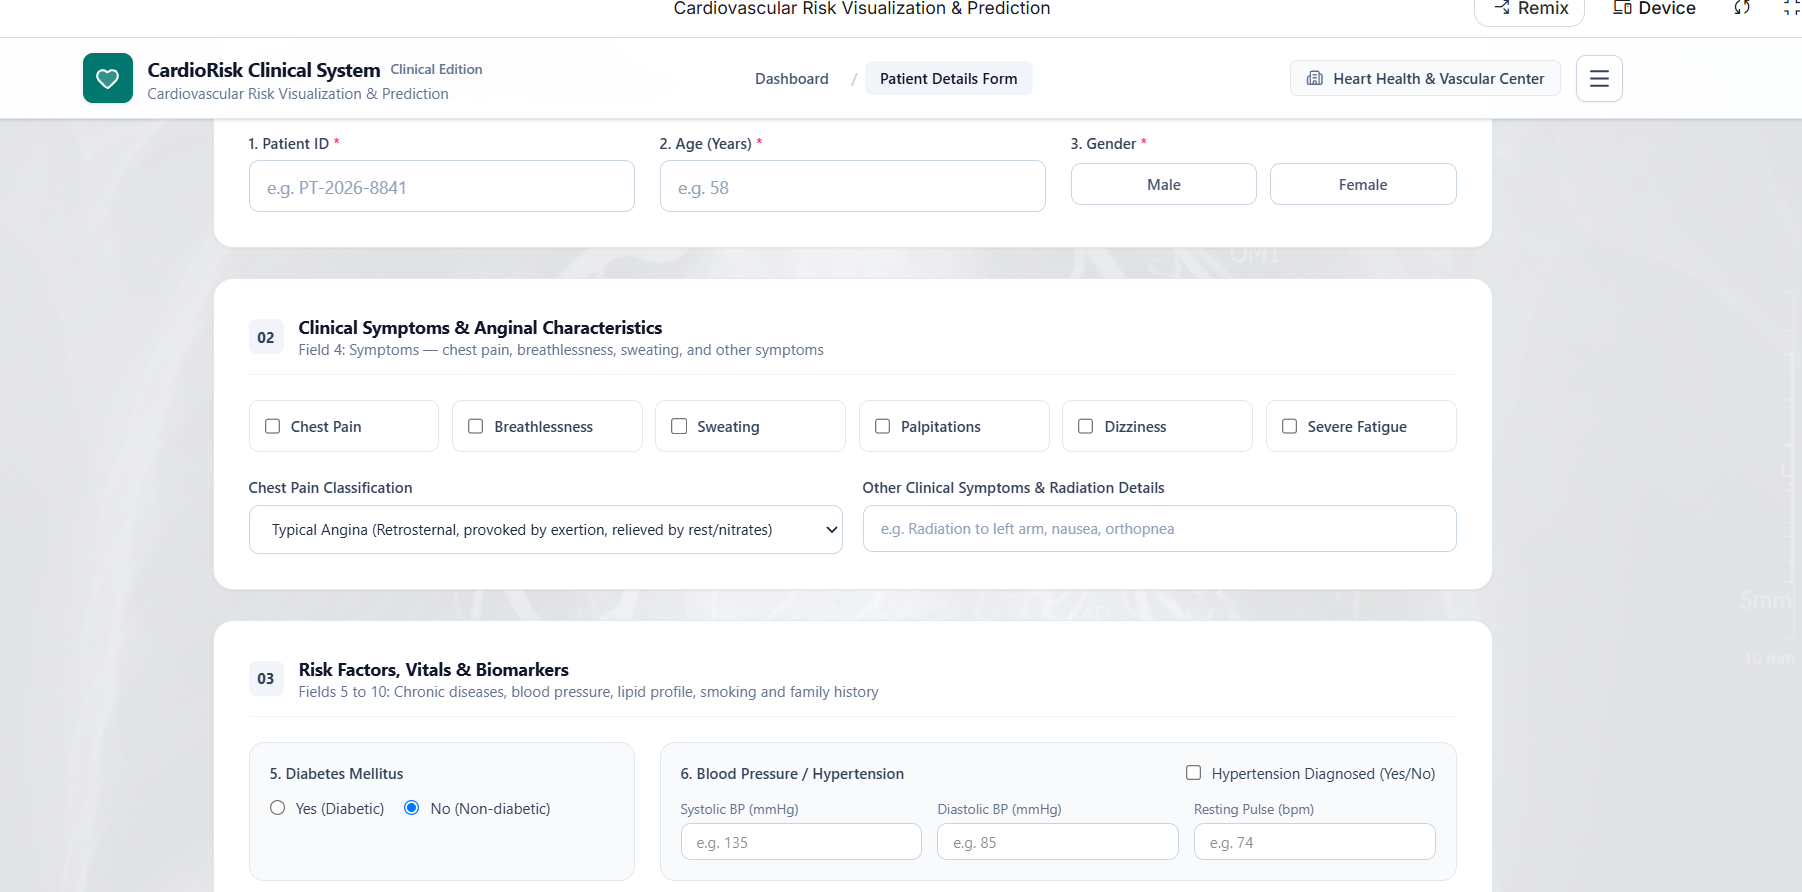
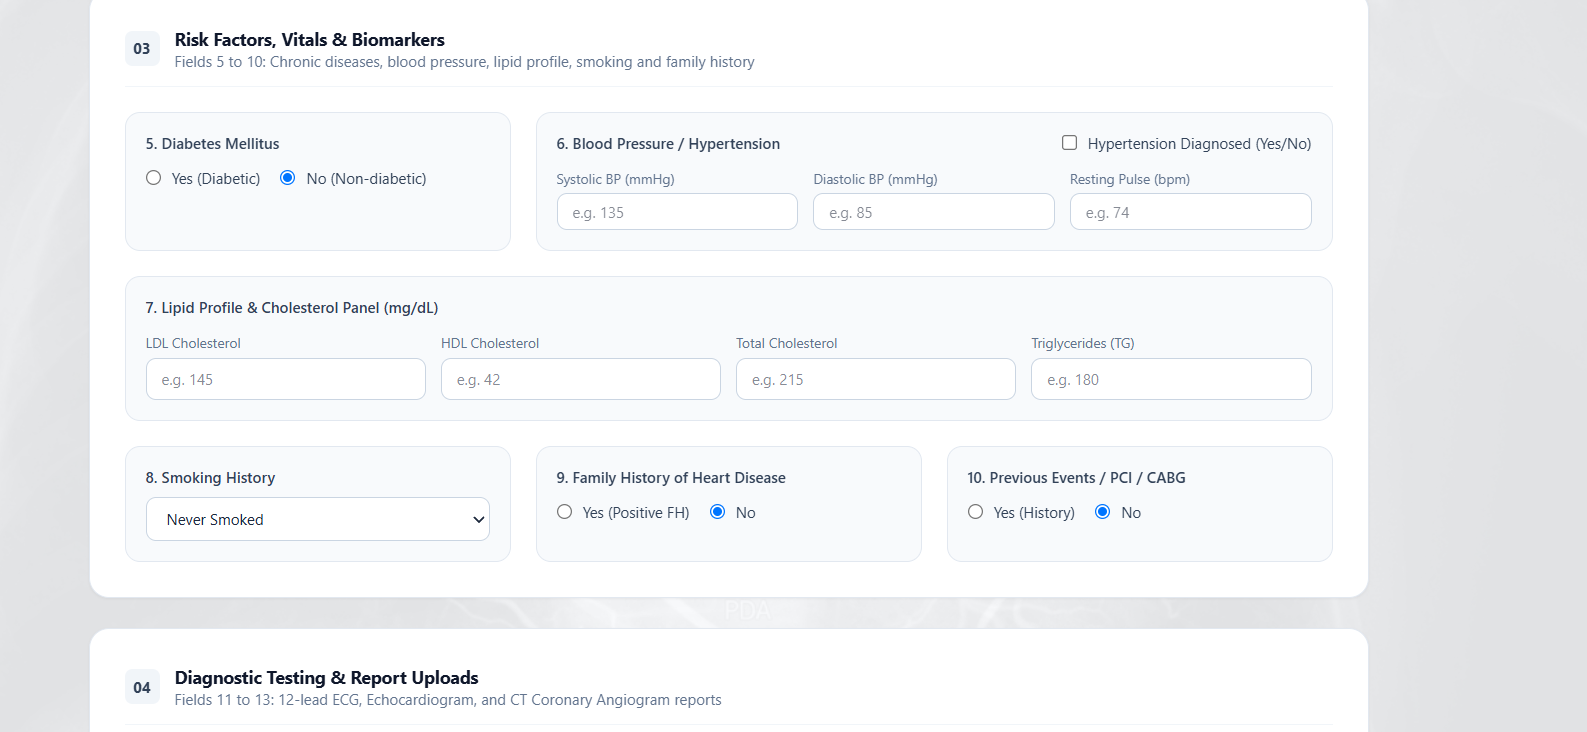
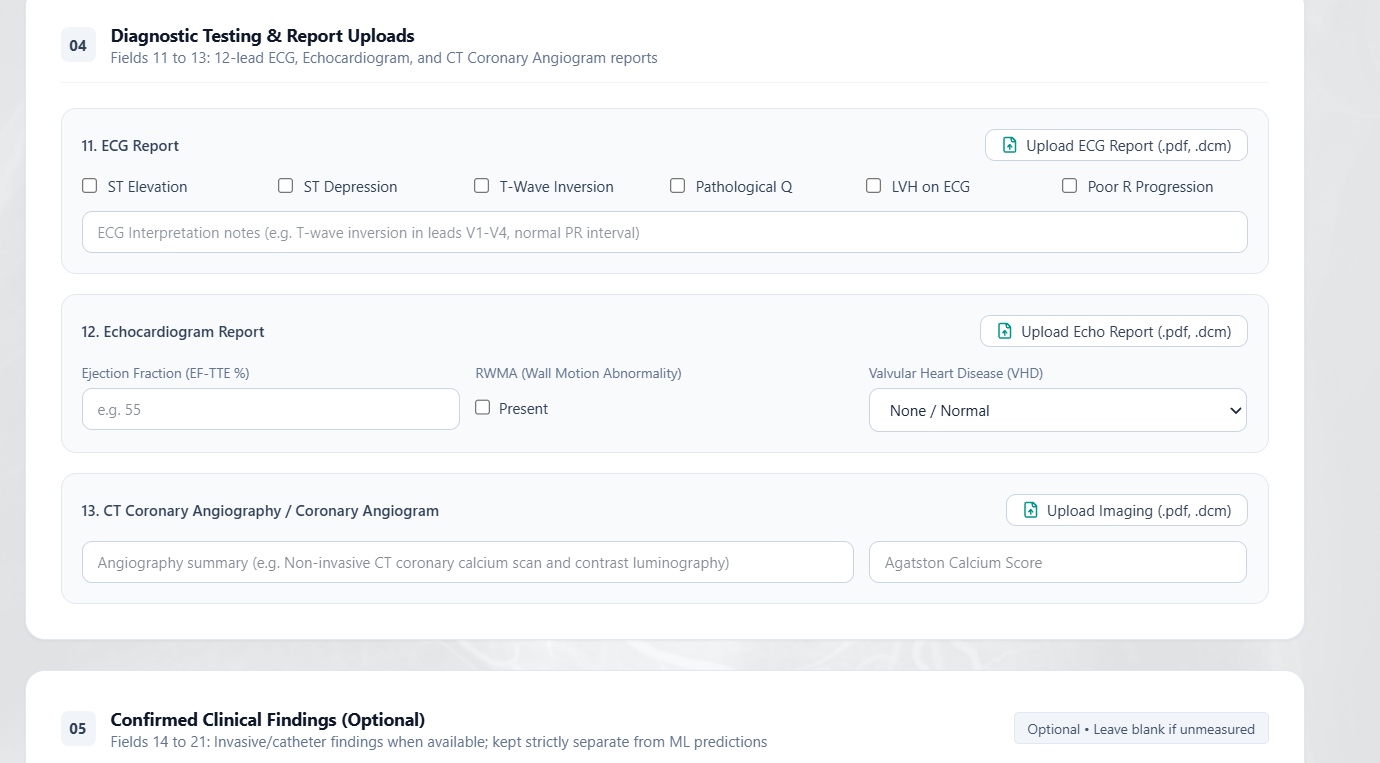
1. Clinical Data Processing: We use the Z-Alizadeh Sani dataset as the basis for cardiovascular risk modelling. The preprocessing stage focuses on data quality, missing values, feature preparation, and appropriate handling of categorical and numerical variables.
2. Machine Learning Models: We explore XGBoost, CatBoost, LightGBM, and Neural Networks to model patterns in the clinical features. We use appropriate validation strategies and comparative evaluation to assess model performance.
3. Multi-Task Risk Prediction: The system is designed around four prediction tasks: overall CAD, Left Anterior Descending (LAD), Left Circumflex (LCX), and Right Coronary Artery (RCA). This structure allows us to investigate overall CAD classification alongside artery-specific predictions, subject to the availability and validity of the corresponding labels.
4. Explainable AI: We incorporate LIME to generate local explanations for individual predictions. These explanations help identify the input features that influence the model output, making the results easier to inspect rather than treating the model as a black box.
5. Interactive 3D Visualization: We use React Three Fiber and Three.js to build an interactive 3D heart interface. The visualization is intended to connect model outputs with the relevant coronary artery regions and present risk information in a more intuitive format.
6. Full-Stack Integration: FastAPI serves as the backend layer for processing requests and connecting the prediction pipeline to the React frontend. The clinical dashboard brings together prediction probabilities, model explanations, and 3D visualization within a unified interface.
Challenges We Faced
One of our main technical challenges was designing a reliable evaluation pipeline for clinical data. Data leakage can lead to misleading performance estimates, so preprocessing and feature selection must be handled carefully within the validation workflow.
Another challenge was designing separate prediction tasks for CAD, LAD, LCX, and RCA. Overall CAD labels do not automatically provide valid artery-specific labels, so the availability and quality of target labels are important considerations. We also needed to consider class imbalance, model generalization, and the limitations of evaluating models on a single dataset.
Integrating Explainable AI with 3D visualization presented a different challenge. Model explanations, predicted probabilities, and anatomical regions need to remain consistent so that the visualization does not imply more clinical certainty than the model can support.
Finally, connecting the ML pipeline, FastAPI services, React components, and 3D rendering required a modular architecture that would make the application easier to test, maintain, and extend.
Future Scope
We plan to improve the system through external validation on independent clinical datasets, calibration of predicted probabilities, and more detailed artery-level modelling where suitable labelled data are available. Additional improvements could include uncertainty estimation, improved anatomical visualization, and more detailed explanations of individual predictions.
Our long-term objective is to develop an interpretable cardiovascular risk visualization prototype that combines predictive modelling, explainability, and interactive anatomical representation. The platform is intended to support research and clinical understanding, not to replace professional diagnosis or medical decision-making.

Log in or sign up for Devpost to join the conversation.