
Perfect — here’s a clean, polished version you can paste directly into a Datathon submission form.
Inspiration
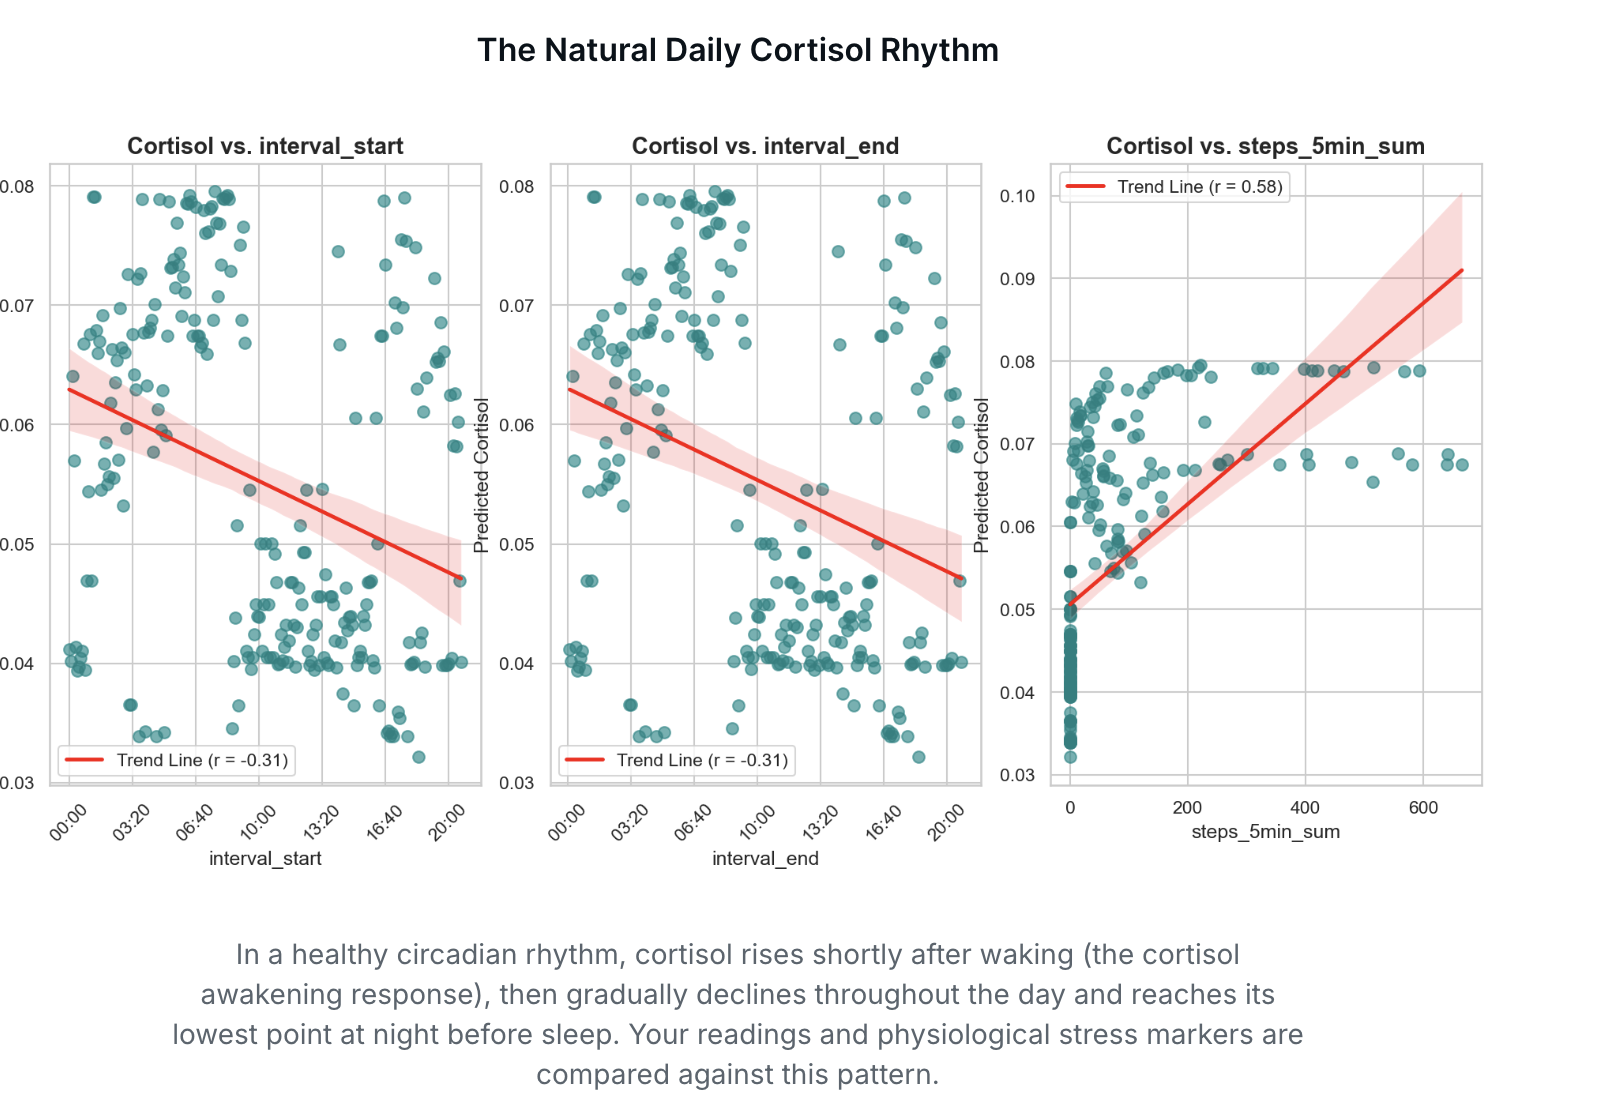
Stress is one of the most measurable yet least understood drivers of long-term health. Cortisol follows a daily rhythm that reflects sleep quality, recovery, and physiological load — but most people don’t have access to continuous cortisol measurements.
We were inspired by the question:
Can we estimate meaningful cortisol trends using consumer wearable data like heart rate, steps, and sleep?
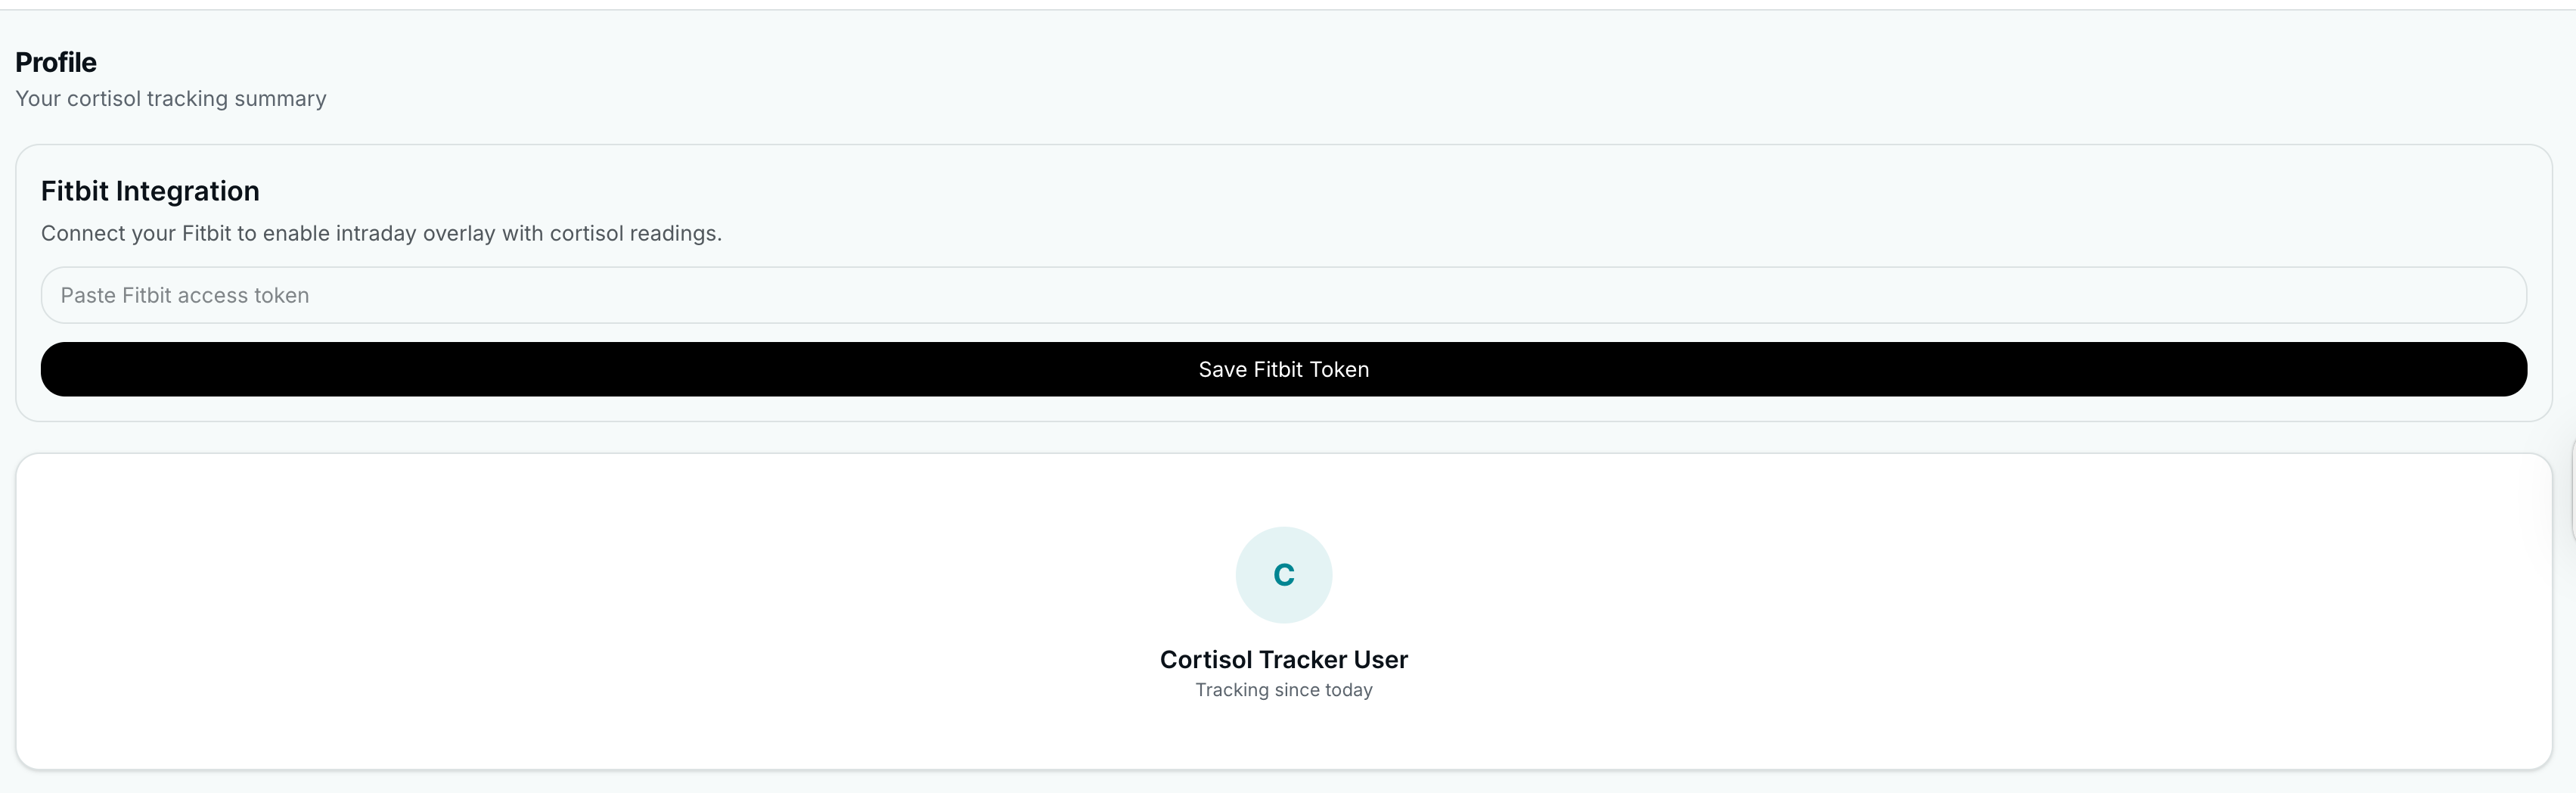
CortisolTracker explores whether everyday Fitbit data can be transformed into a real-time physiological signal that helps people understand their stress patterns.
What It Does
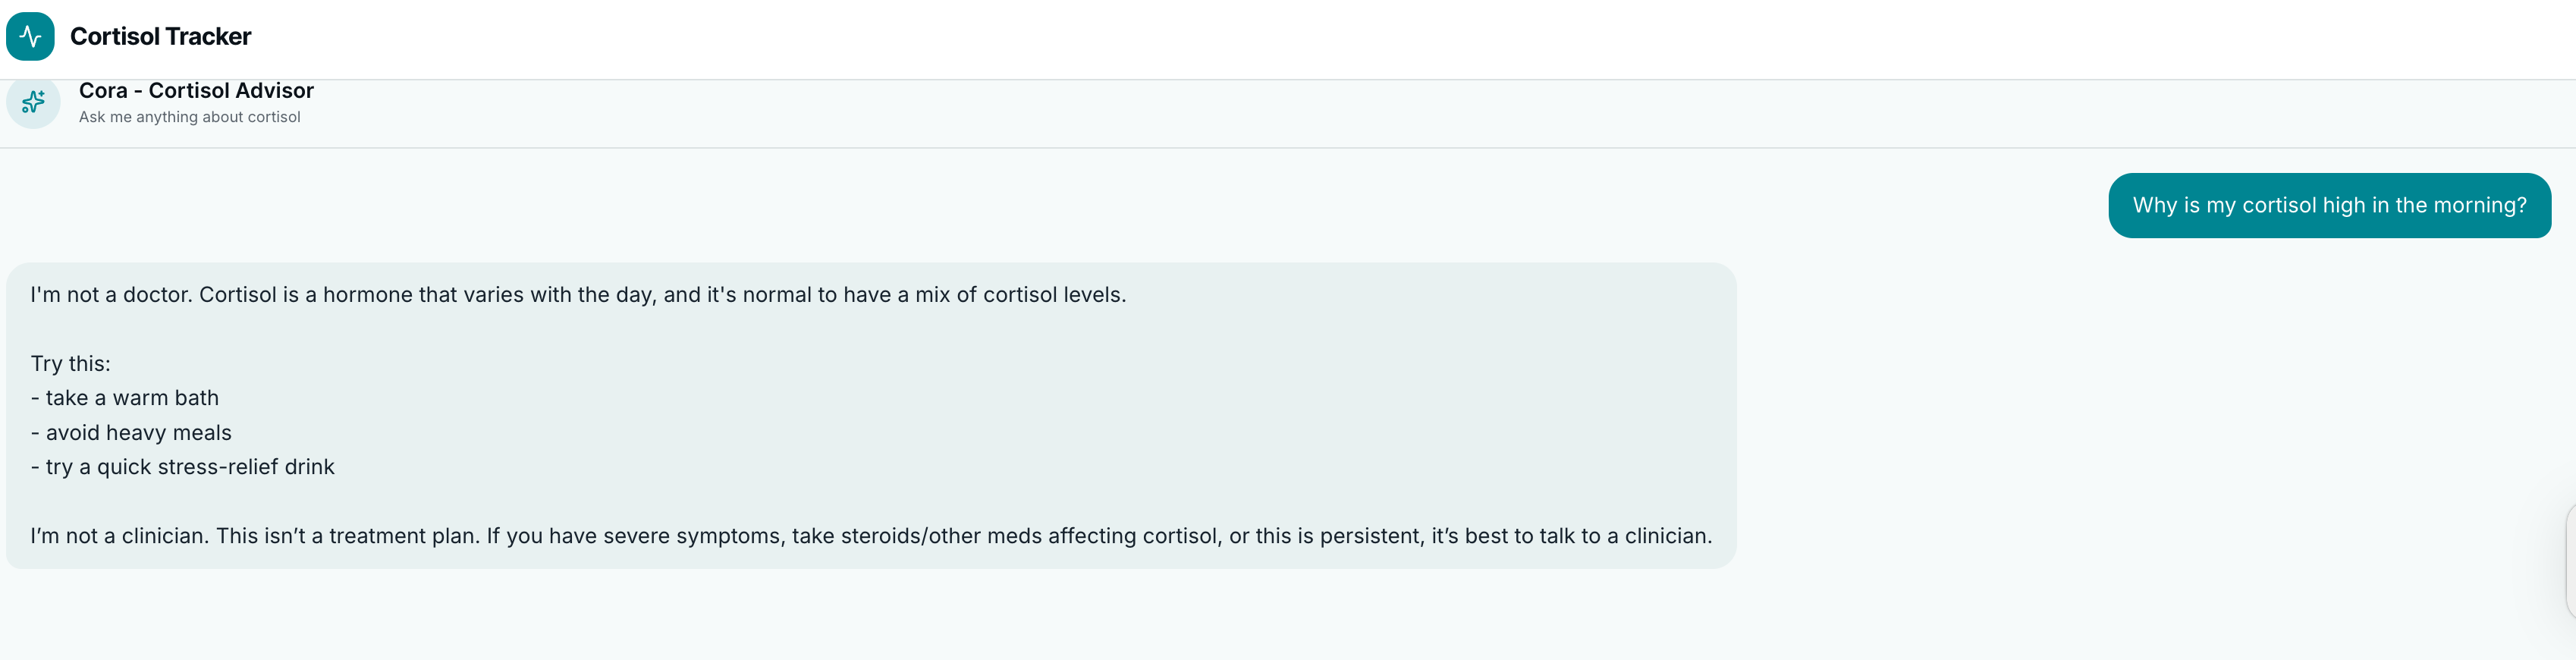
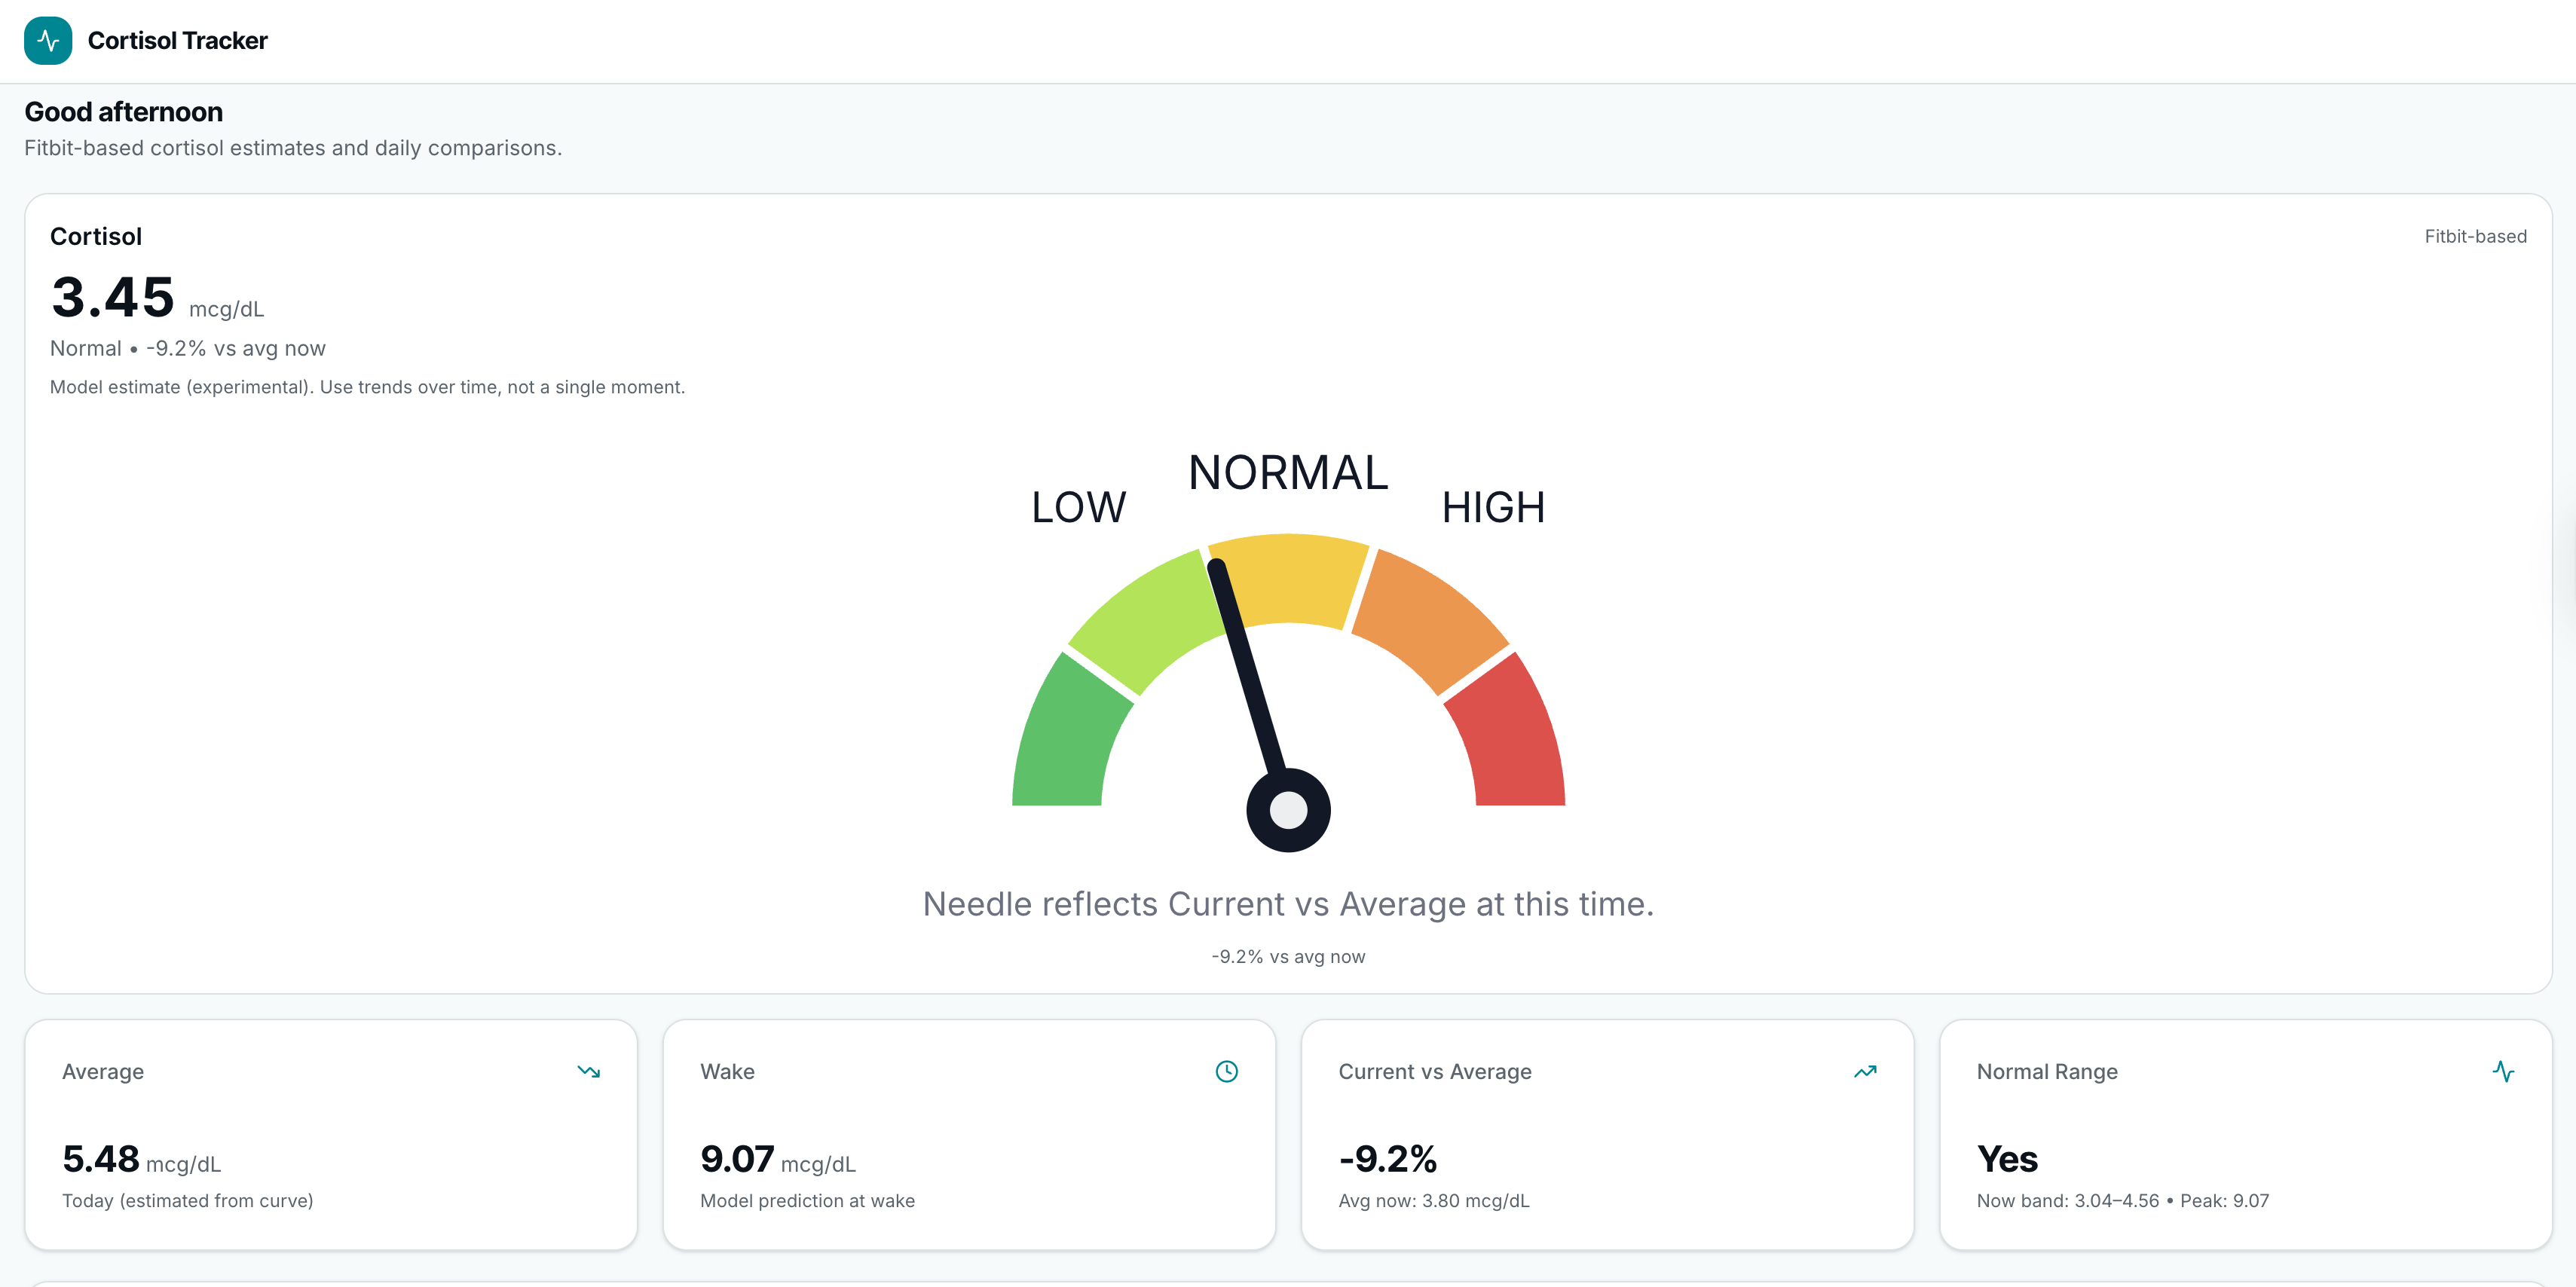
CortisolTracker predicts and visualizes an individual’s estimated cortisol levels using wearable data.
Specifically, it:
- Uses heart rate intensity, steps, and sleep metrics
- Feeds engineered features into a trained Ridge regression model
- Predicts wake cortisol (normalized and converted to µg/dL)
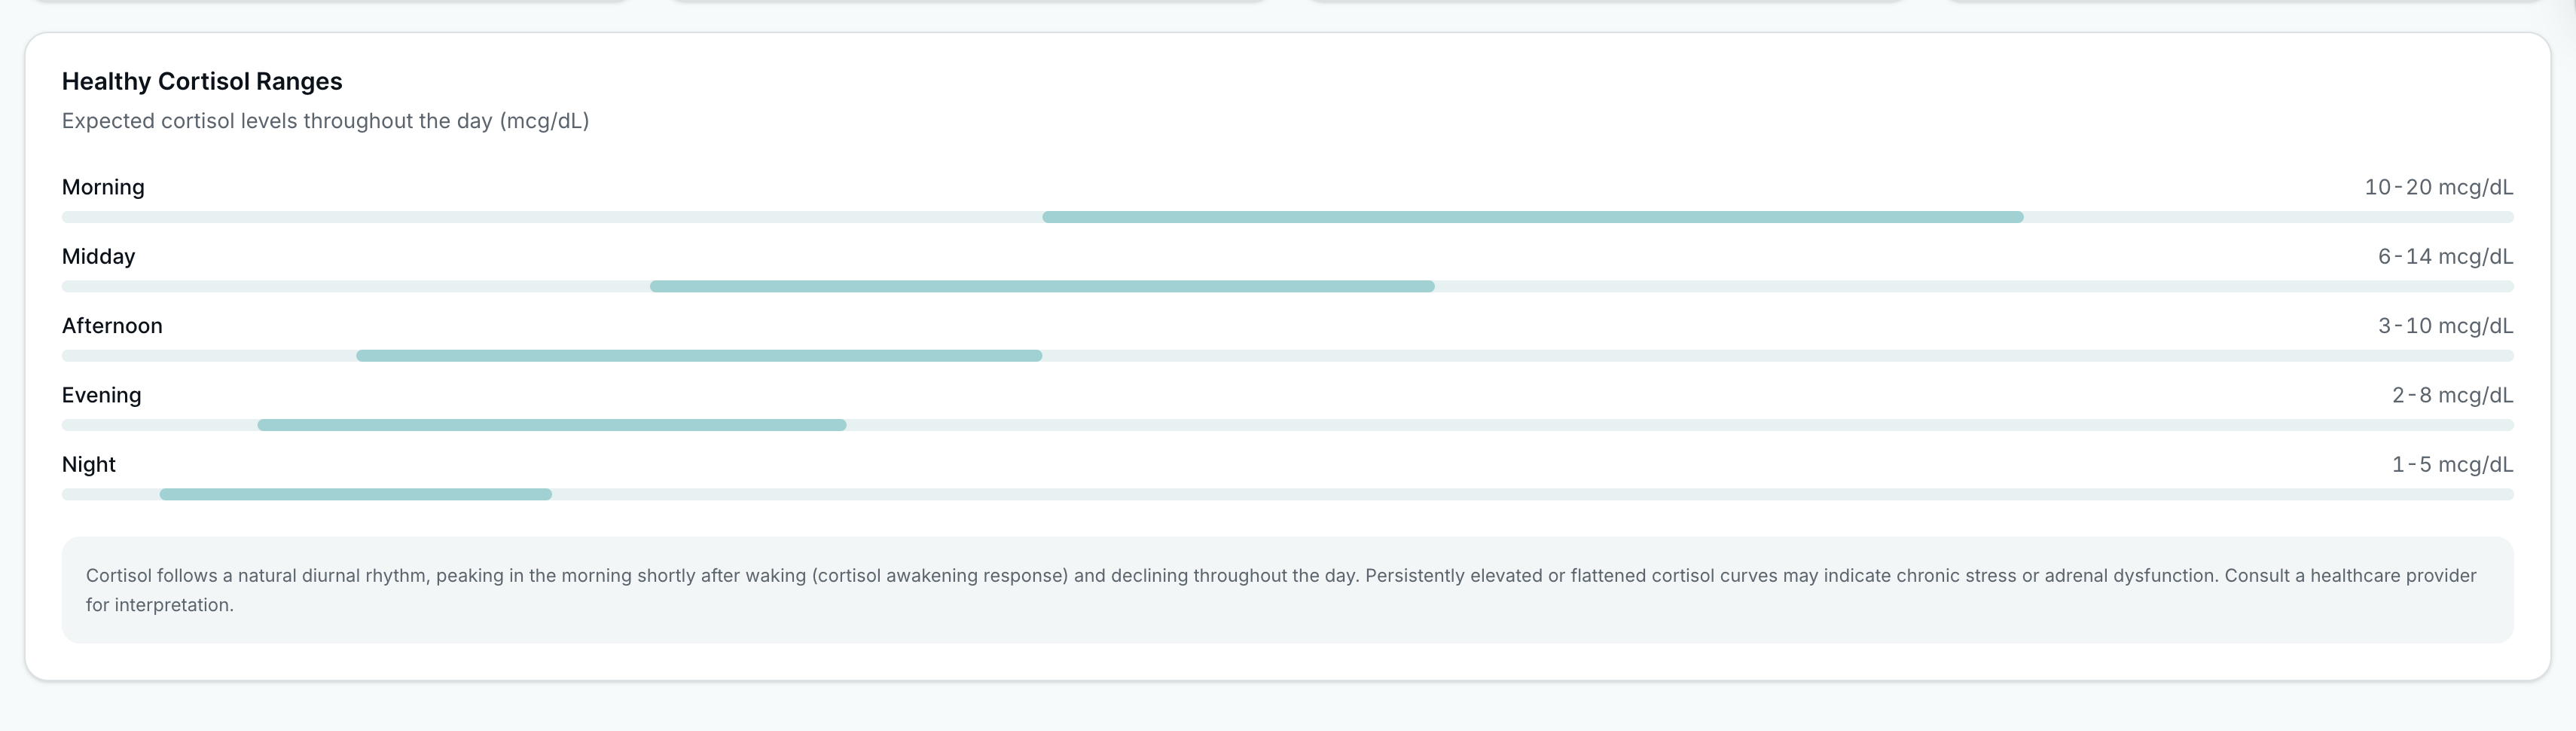
- Models a realistic daily decay curve
Computes:
- Current cortisol estimate
- Average cortisol for today
- Peak cortisol
- Current vs national average
- Whether the user is within a time-adjusted normal range
Visualizes results with an interactive gauge and dashboard
It turns raw wearable data into an interpretable physiological stress profile.
How We Built It
Data
- MMASH dataset (multi-modal wearable + salivary cortisol data)
- 22 users
- Actigraph HR
- Steps
- Sleep metrics
- Saliva-based wake cortisol
Feature Engineering
For each day:
- Avg heart rate intensity (z-score vs baseline)
- Previous-day steps
- Previous-night sleep duration
- Sleep efficiency
Model
- Ridge regression
- Trained on normalized wake cortisol
- MAE ≈ 0.076 (normalized scale)
- Converted to µg/dL using assumed population parameters
Backend
- Python model inference via joblib
- Next.js API route for prediction
- Parallel Fitbit data fetching
- Real-time curve modeling
Frontend
- React + Next.js
- Dynamic dashboard
- Custom-built SVG cortisol gauge
- Real-time percent-vs-average visualization
Challenges We Ran Into
- Data sparsity: Only 16 valid training rows after filtering.
- Small dataset modeling: Risk of overfitting with limited samples.
- Time alignment: Matching previous-day wearable features to next-morning cortisol.
- Real-time inference speed: Spawning Python processes inside a Next.js API route required optimization.
- Visualization math: Building a properly oriented semi-circular gauge required careful SVG arc geometry.
We also had to make decisions about assumed national averages and daily decay modeling in the absence of continuous cortisol data.
Accomplishments We're Proud Of
- Successfully trained a working physiological prediction model.
- Built a full-stack pipeline from wearable data → ML inference → real-time UI.
- Designed a biologically realistic cortisol decay curve.
- Created a dynamic gauge reflecting current vs time-adjusted average.
- Optimized backend performance to reduce 40s inference times to near-real-time.
Most importantly, we translated complex physiological modeling into an intuitive consumer-facing dashboard.
What We Learned
- Wearable signals can approximate physiological markers when engineered thoughtfully.
- Even simple models (Ridge regression) can perform well with meaningful features.
- Visualization clarity is just as important as model accuracy.
- Full-stack ML integration introduces engineering challenges beyond training the model.
- Small datasets require careful normalization and interpretation.
We also learned how to move from static ML experiments to real-time production-style deployment.
What’s Next for CortisolTracker
- Personal baseline modeling instead of population assumptions.
- Bayesian updating to refine predictions per user over time.
- Incorporating HRV and resting heart rate trends.
- Adaptive national averages by time-of-day distribution.
- Cross-validation across larger multi-user datasets.
- Mobile integration for real-time notifications.
- Clinical validation against longitudinal cortisol sampling.
Long-term, we envision CortisolTracker as a continuous stress biomarker platform powered entirely by consumer wearables.
Built With
- next.js
- node.jsreact
- pandasnext.js
- python
- rapidfire
- scikit-learn
- tailwind
- typescript
- vercel

Log in or sign up for Devpost to join the conversation.