-
-
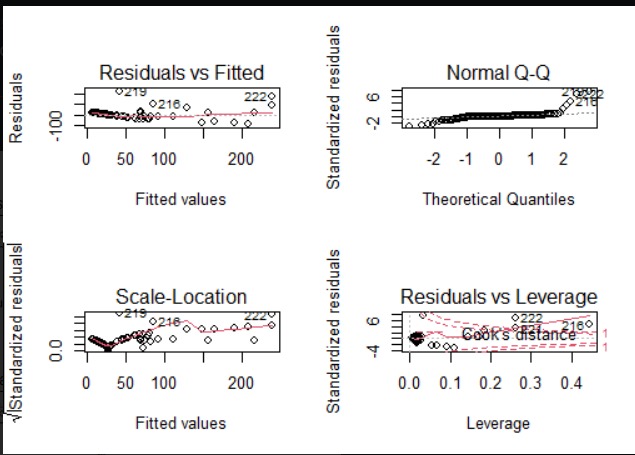
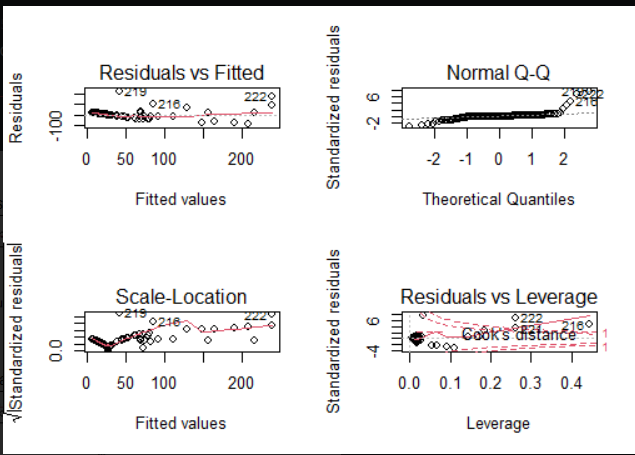
Diagnostic Plot
Inspiration
- Increase in Greenhouse Gas Emissions
- Inflation
- Rising Stock Prices in the US Stock Market
What it does
Finds a correlation between Carbon Dioxide Emission levels from USA, China and the US Stock Market Indexes
How we built it
- Queried Data from Snowflake into CSV Files
- Loaded data into Pandas dataframes
- Filtered environment data for US, China
- Joined Stock Price, company and symbol tables from database
- Visualized the CO2 Emission Levels and US Stock Market Indexes data over years
- Built a Linear Regression model with 60% R-square score to find the correlation between the two variables
- Predicted US Stock Market Index based on Carbon Dioxide emissions from China and USA
Challenges we ran into
- Understanding and using the snowflake platform
- Merging different tables from the database
- Handling large volume of data
Accomplishments that we're proud of
- Finding a correlation between Carbon Dioxide Emission levels from USA, China and the US Stock Market Indexes
- Working on and learning about new platforms like Snowflake
- Learning more about data wrangling
What we learned
- Operating Snowflake Platform
- Implementing Machine Learning algorithms
- Data Wrangling
What's next for Correlation Between CO2 Emission Levels and US Stock Market
- Further Analysis: finding more such correlations between environmental activities and the US Stock Markets

Log in or sign up for Devpost to join the conversation.