Inspiration
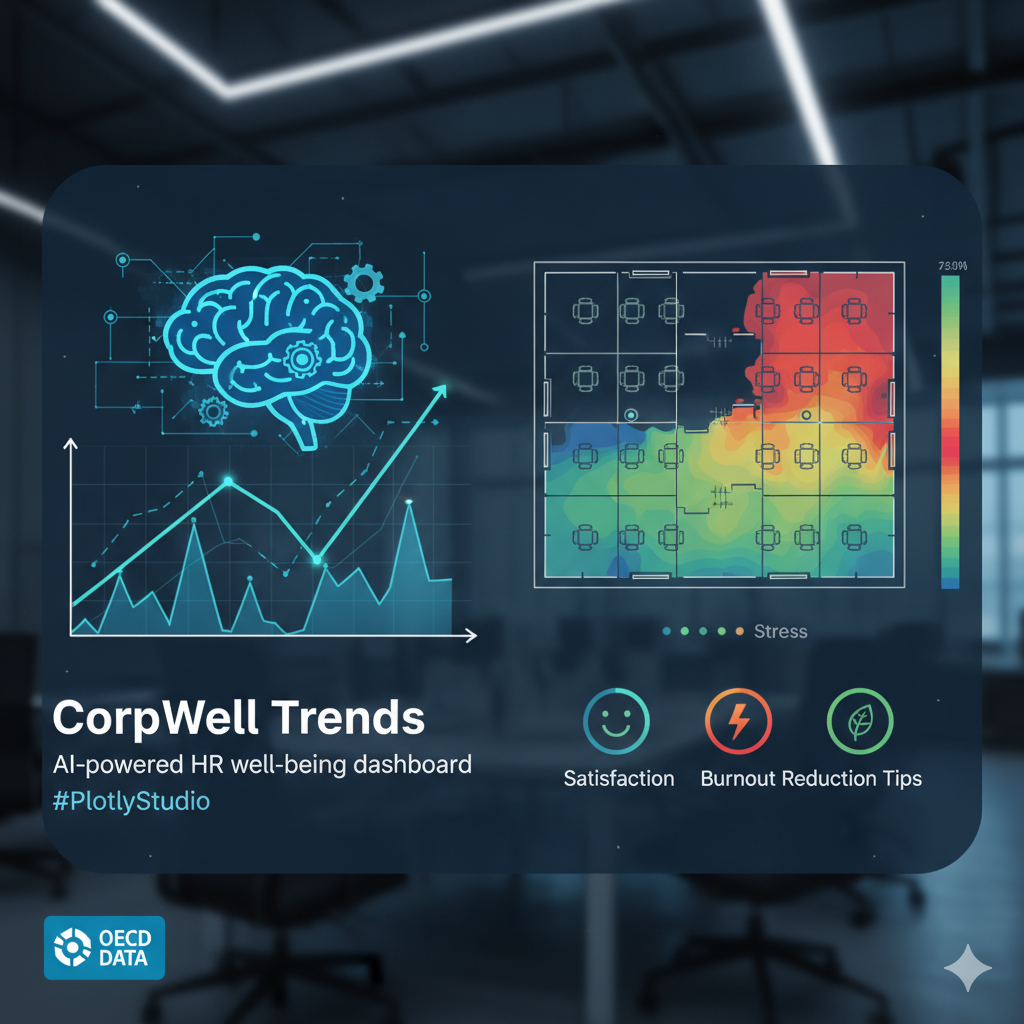
With 2025’s 15-20% employee turnover crisis costing industries billions, we crafted CorpWell Trends to empower HR with actionable well-being insights. Inspired by OECD’s Better Life Index, our app personalizes trends to cut burnout and boost retention, using Plotly Studio’s AI for rapid, no-code development.
What We Learned
Plotly Studio’s AI crafts complex dashboards via precise prompts like “build a time-series app with filters.”
Merging datasets (OECD + mock HR) needs clean columns.
HR analytics tie well-being to ROI, like correlating stress with productivity.
How We Built It
We strategically designed the app:
Data: Curated OECD well-being CSV (~2 MB) and crafted a 500-row mock HR dataset for personalization.
Build: Uploaded to Plotly Studio, prompted “create an HR dashboard with line charts, role filters, and OECD benchmarks” .
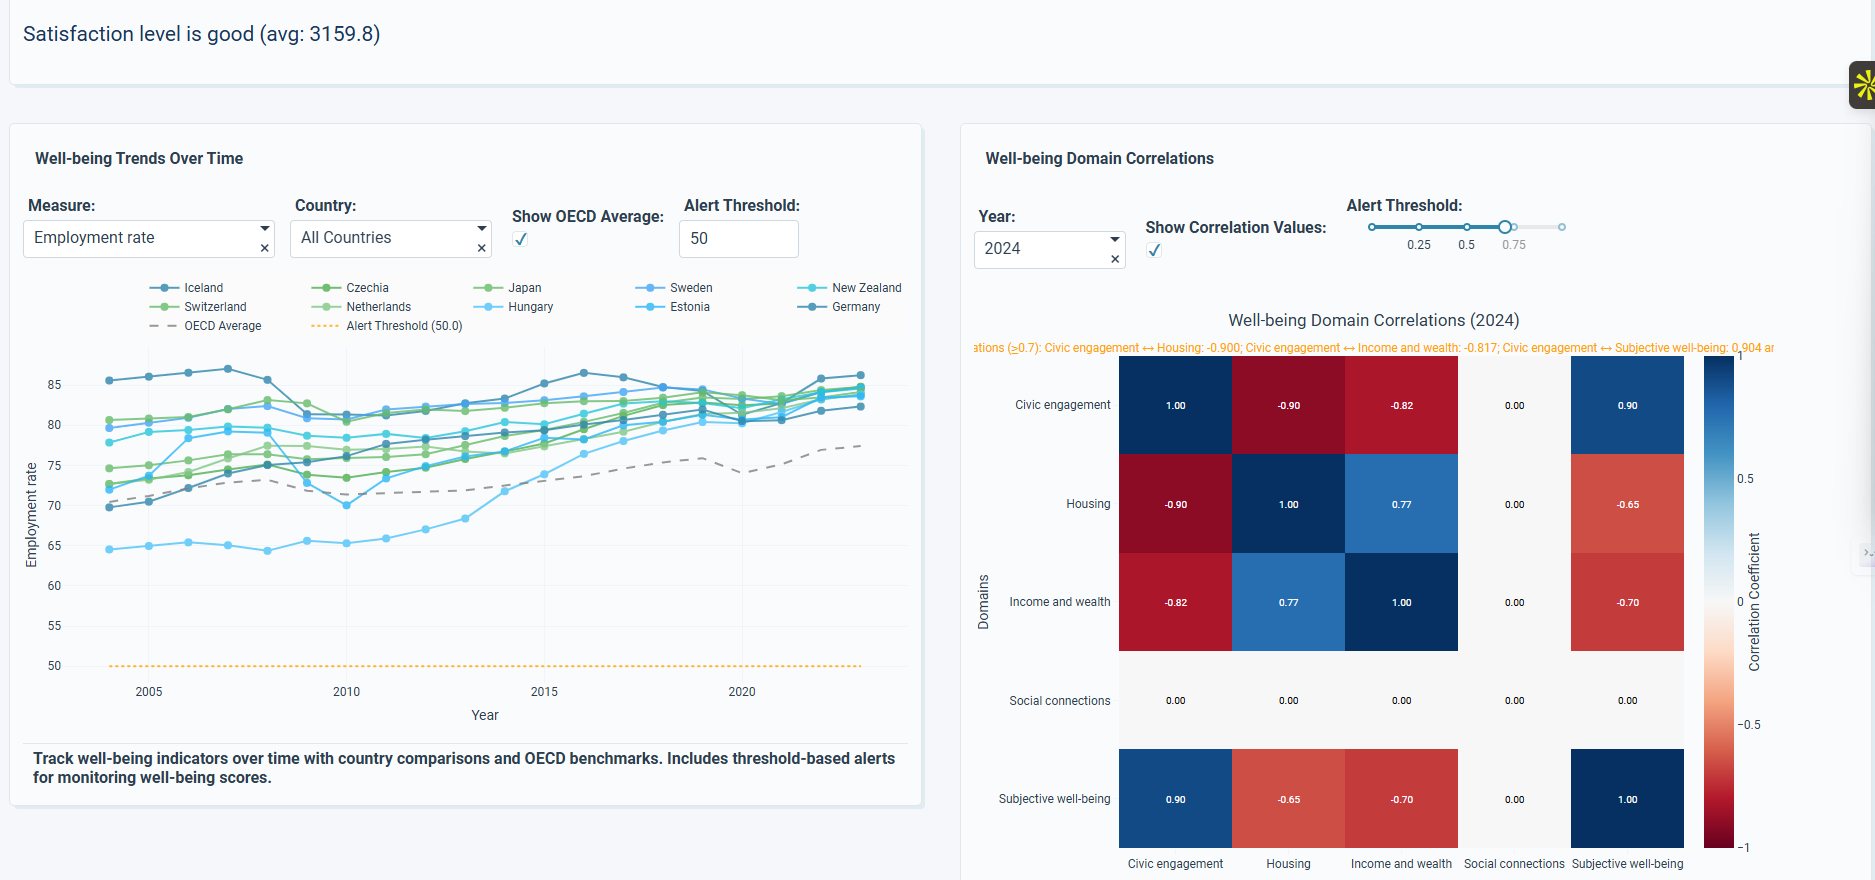
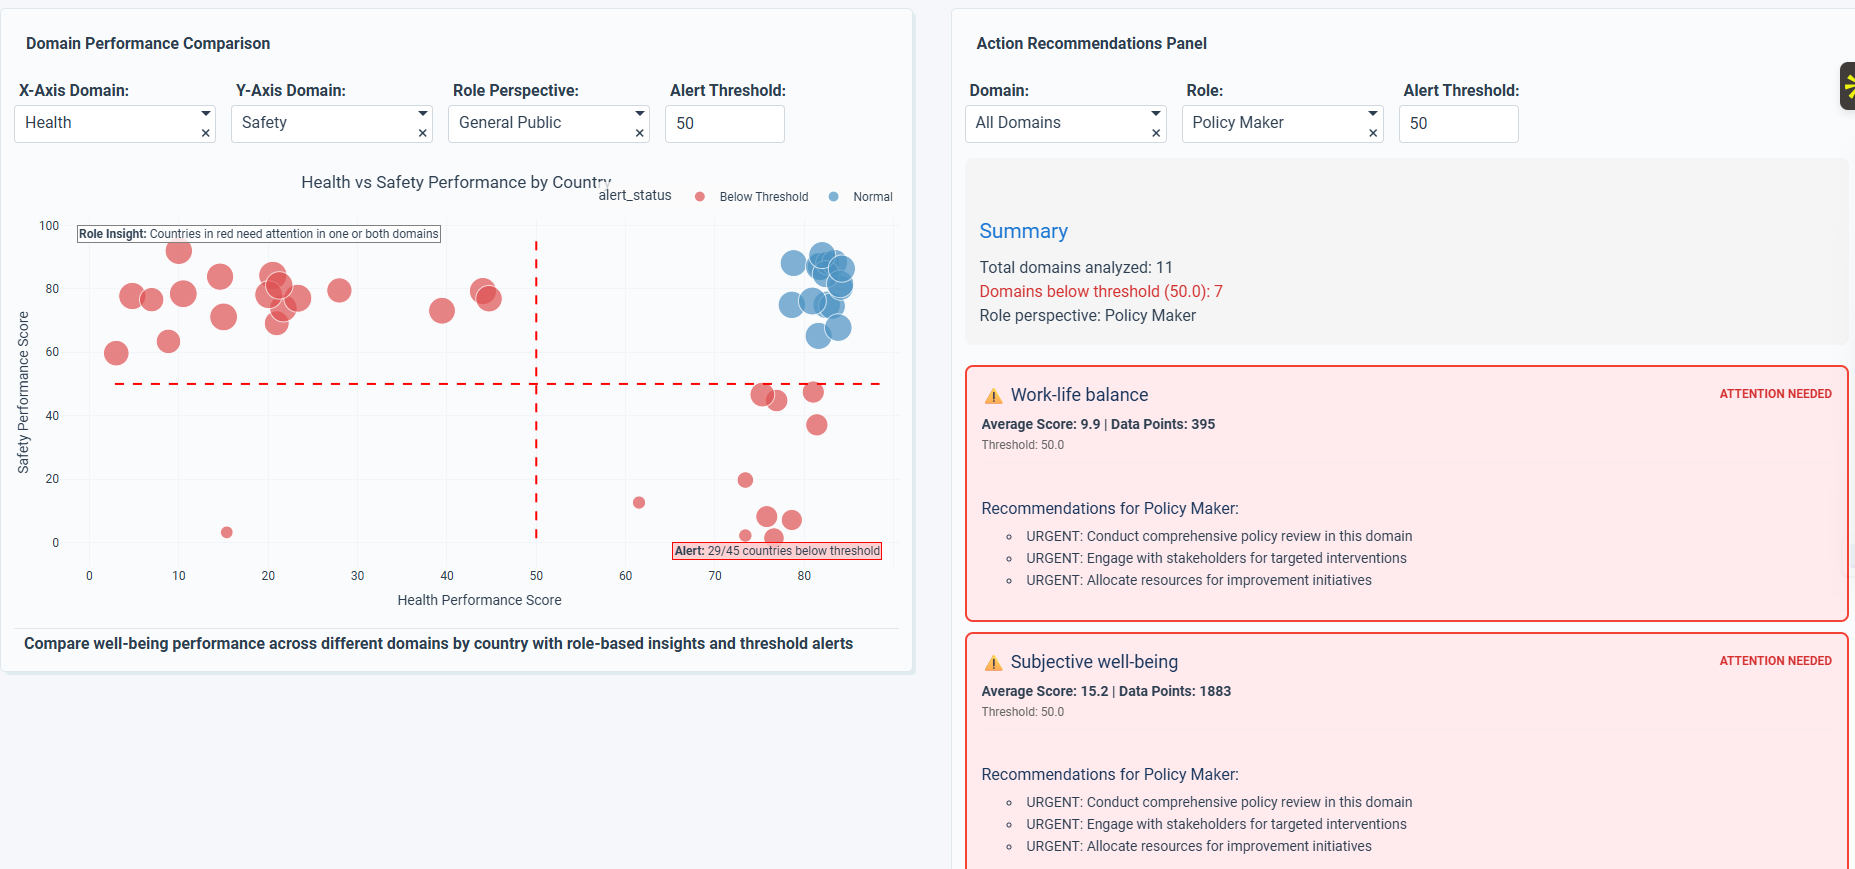
Polish: Iterated : added area charts, sliders, correlation heatmaps, and action text like “suggest wellness if scores <7.”
Deploy: Published to Plotly Cloud with public access.
Challenges
Optimized token use by favoring edits over regenerations.
Aligned datasets manually for seamless merging.
Refined vague AI outputs with specific prompts for clarity.
Built With
- csv
- index
- life
- oecd
- plotly
- studio


Log in or sign up for Devpost to join the conversation.