

Inspiration
Heart disease kills about 17.9 million people a year (WHO). Yet most risk tools turn a whole person into one percentage. That number doesn't tell you which artery might be narrowed, why the model thinks so, or what to do next. Most of them also ask for things a normal person doesn't know, like ejection fraction or ECG findings.
I wanted a tool where anyone can answer a few simple questions and actually see where their heart may be at risk, explained in plain words.
What it does
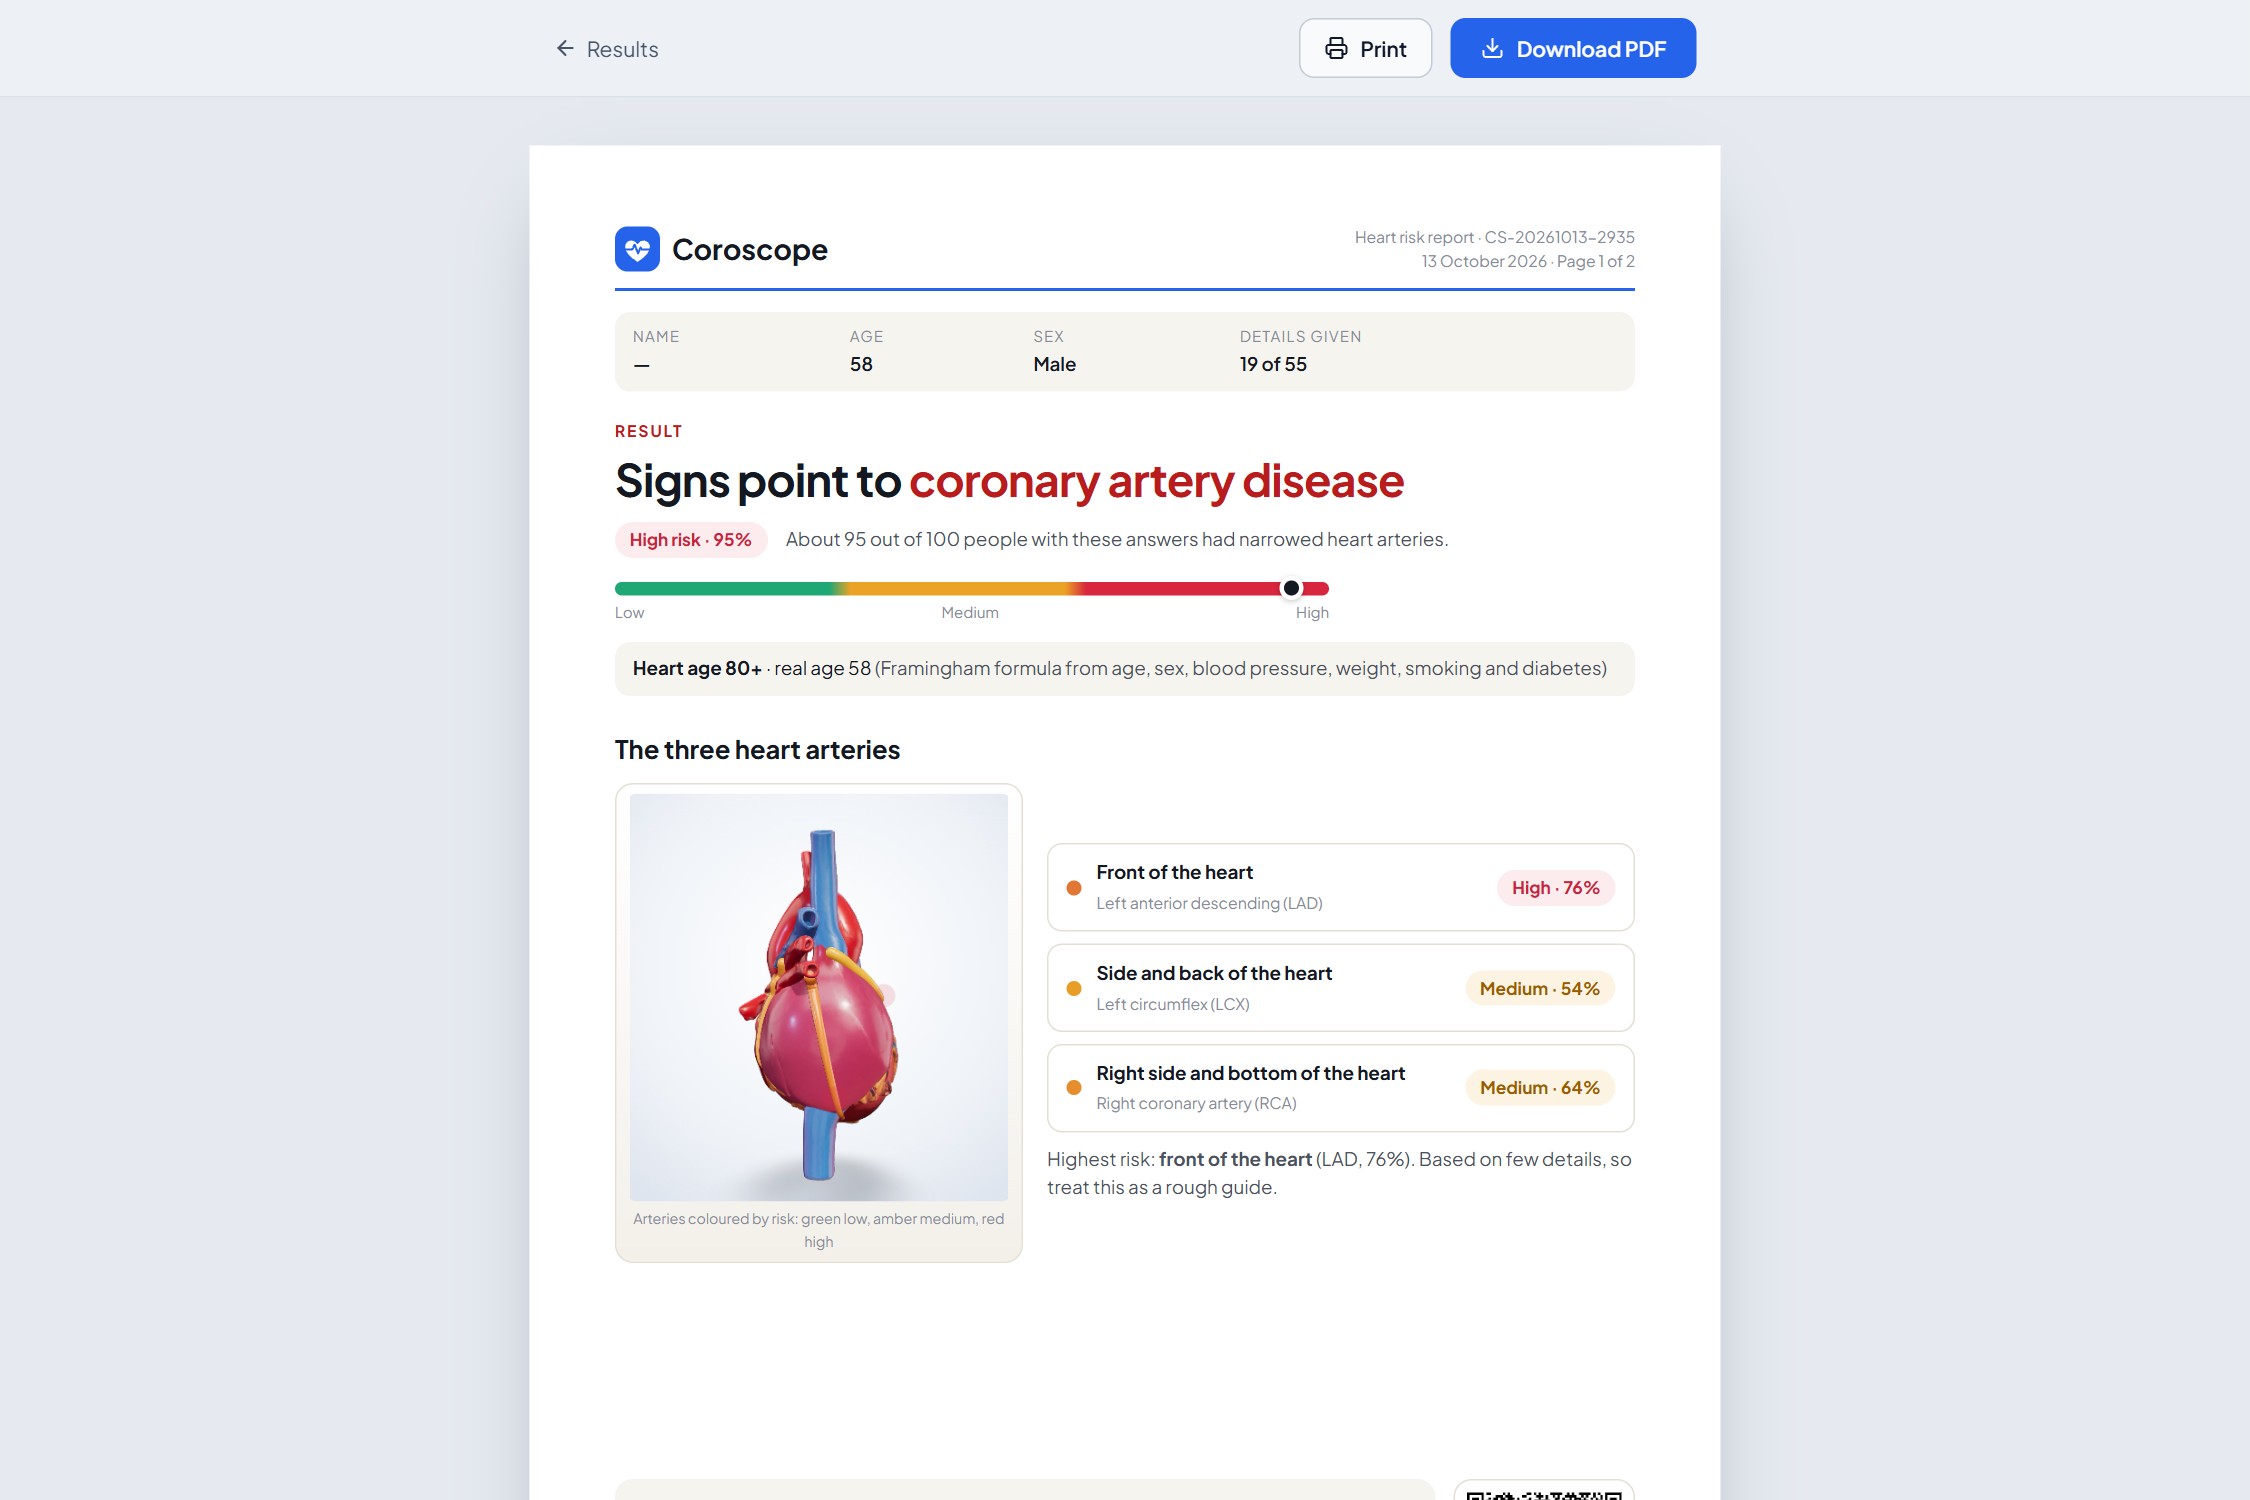
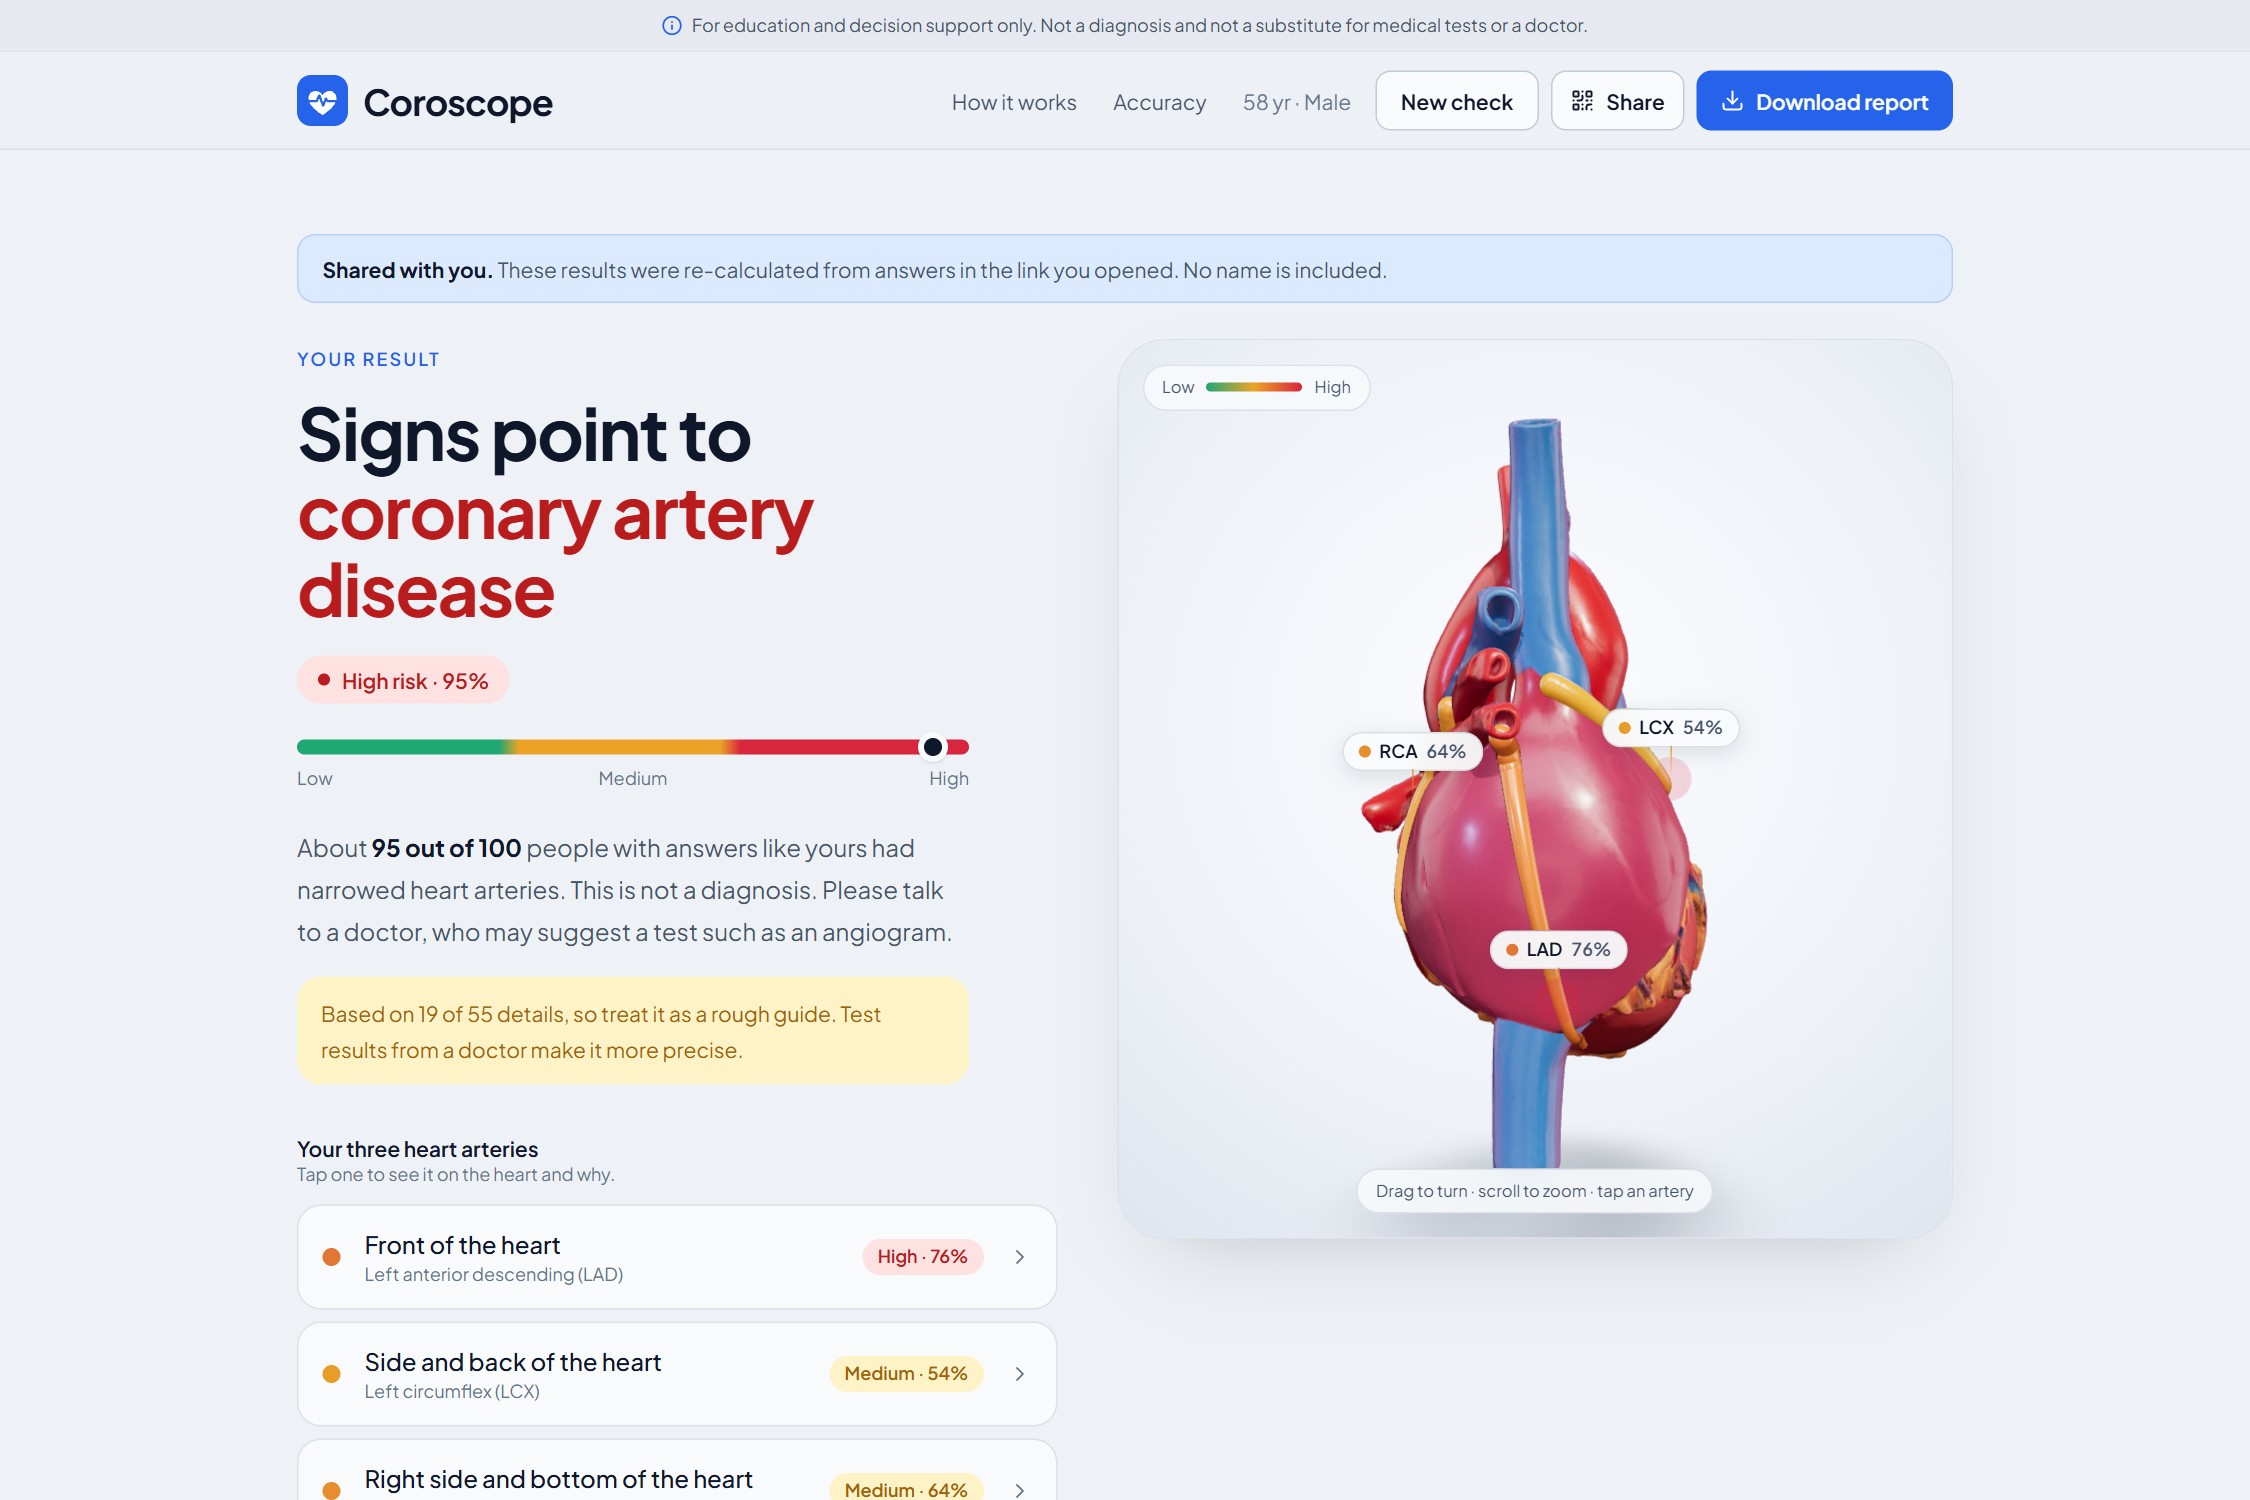
Coroscope predicts coronary artery disease (CAD) and the chance of narrowing in each of the three main heart arteries: LAD (front), LCX (side and back) and RCA (right side and bottom).
- Six-question quick check: age, sex, diabetes, blood pressure, smoking and chest pain, in everyday words. Anything you don't know is "Not sure".
- Full clinical form for doctors: all 55 inputs (history, ECG, labs, echo).
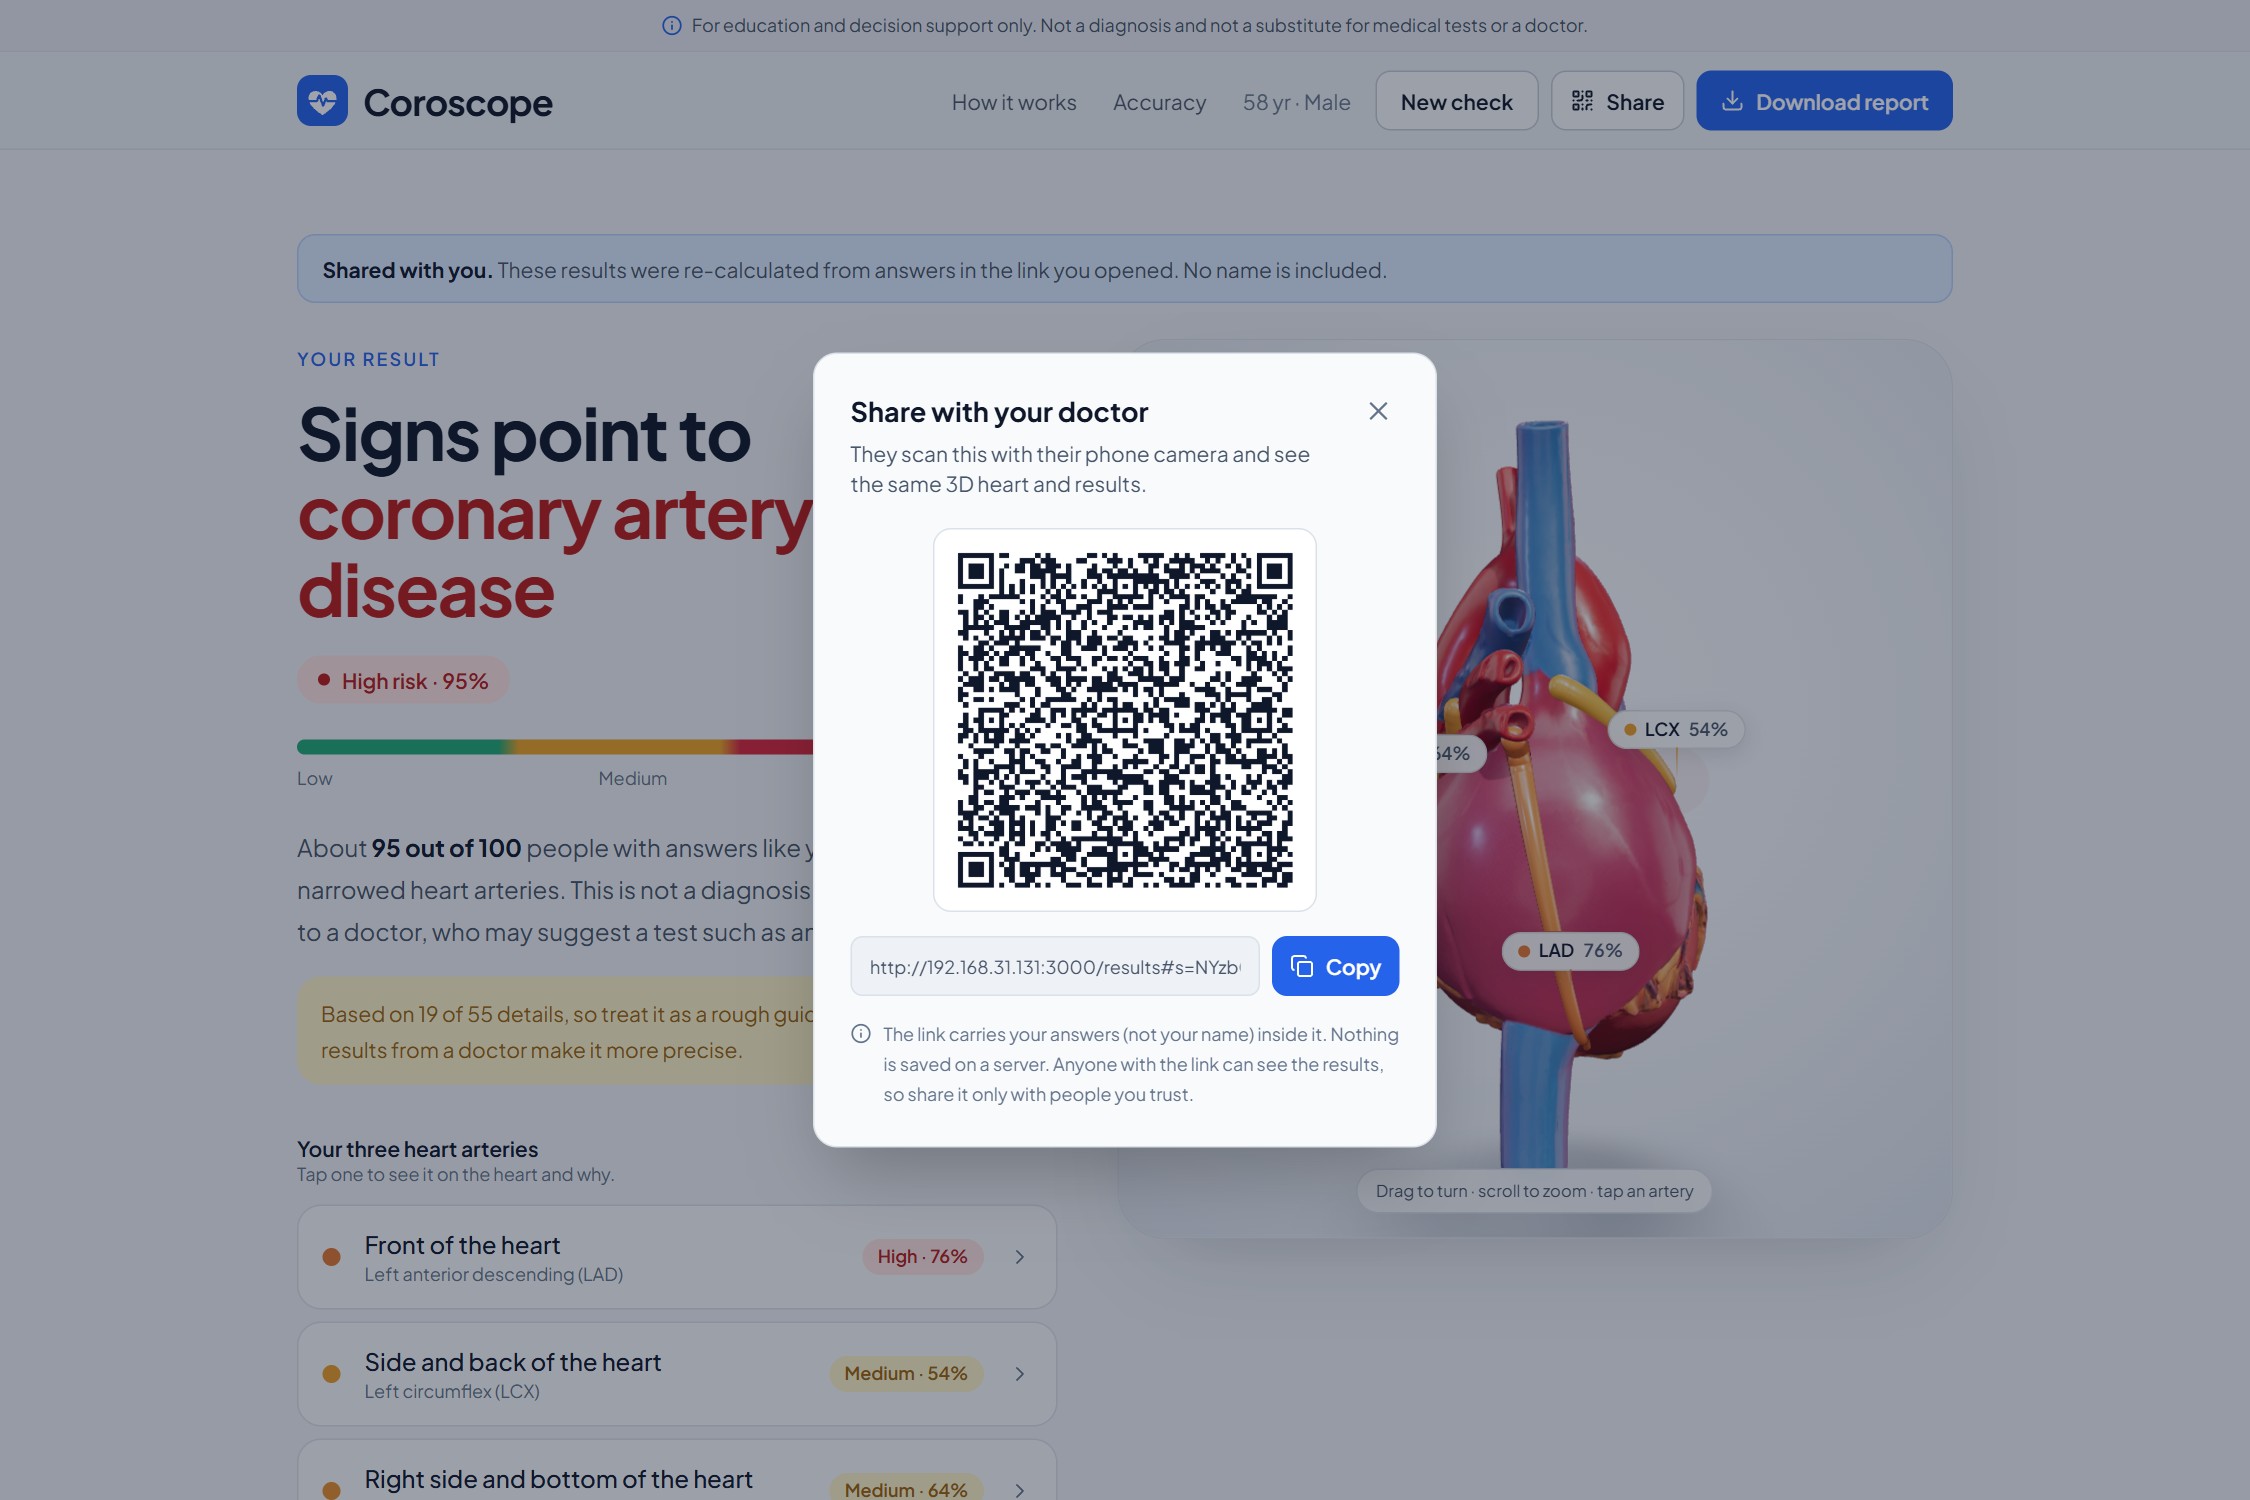
- Interactive 3D heart: each artery is coloured green, amber or red by its own model. Blood flow visibly slows in arteries that are likely narrowed. Tap an artery to focus on it.
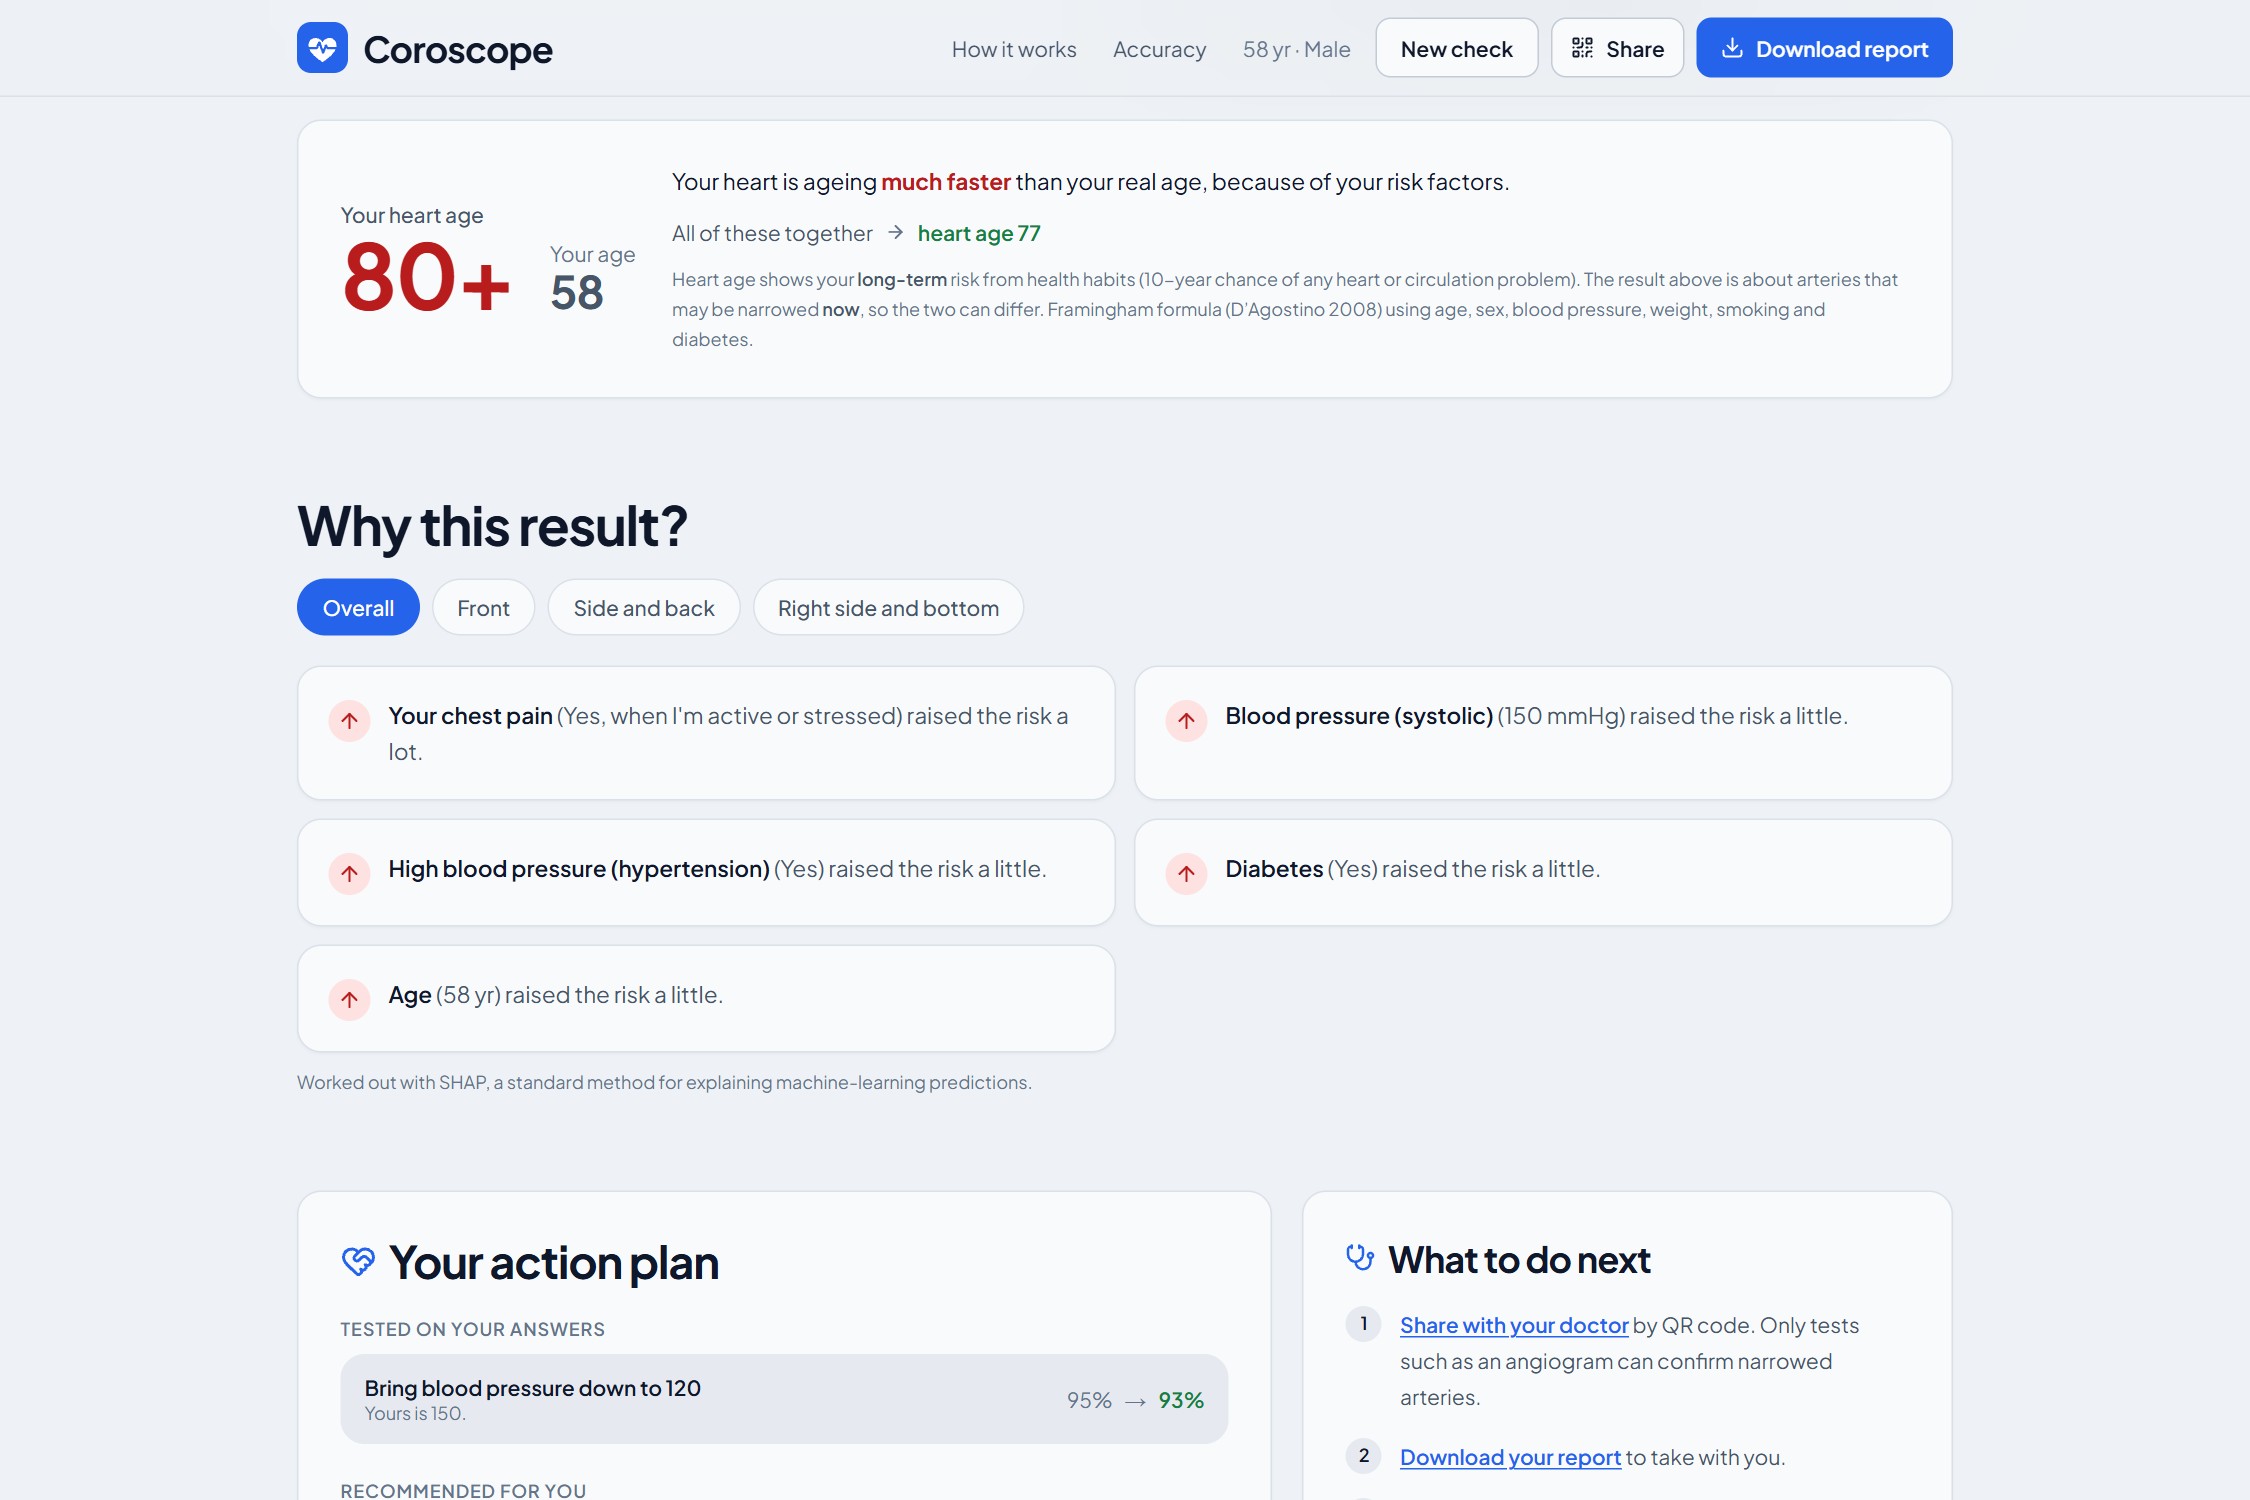
- Plain-language reasons: SHAP explanations turned into sentences like "Your chest pain raised the risk a lot".
- Heart age: "You're 58, but your heart is like an 80-year-old's", from the published Framingham formula, with what would bring it down.
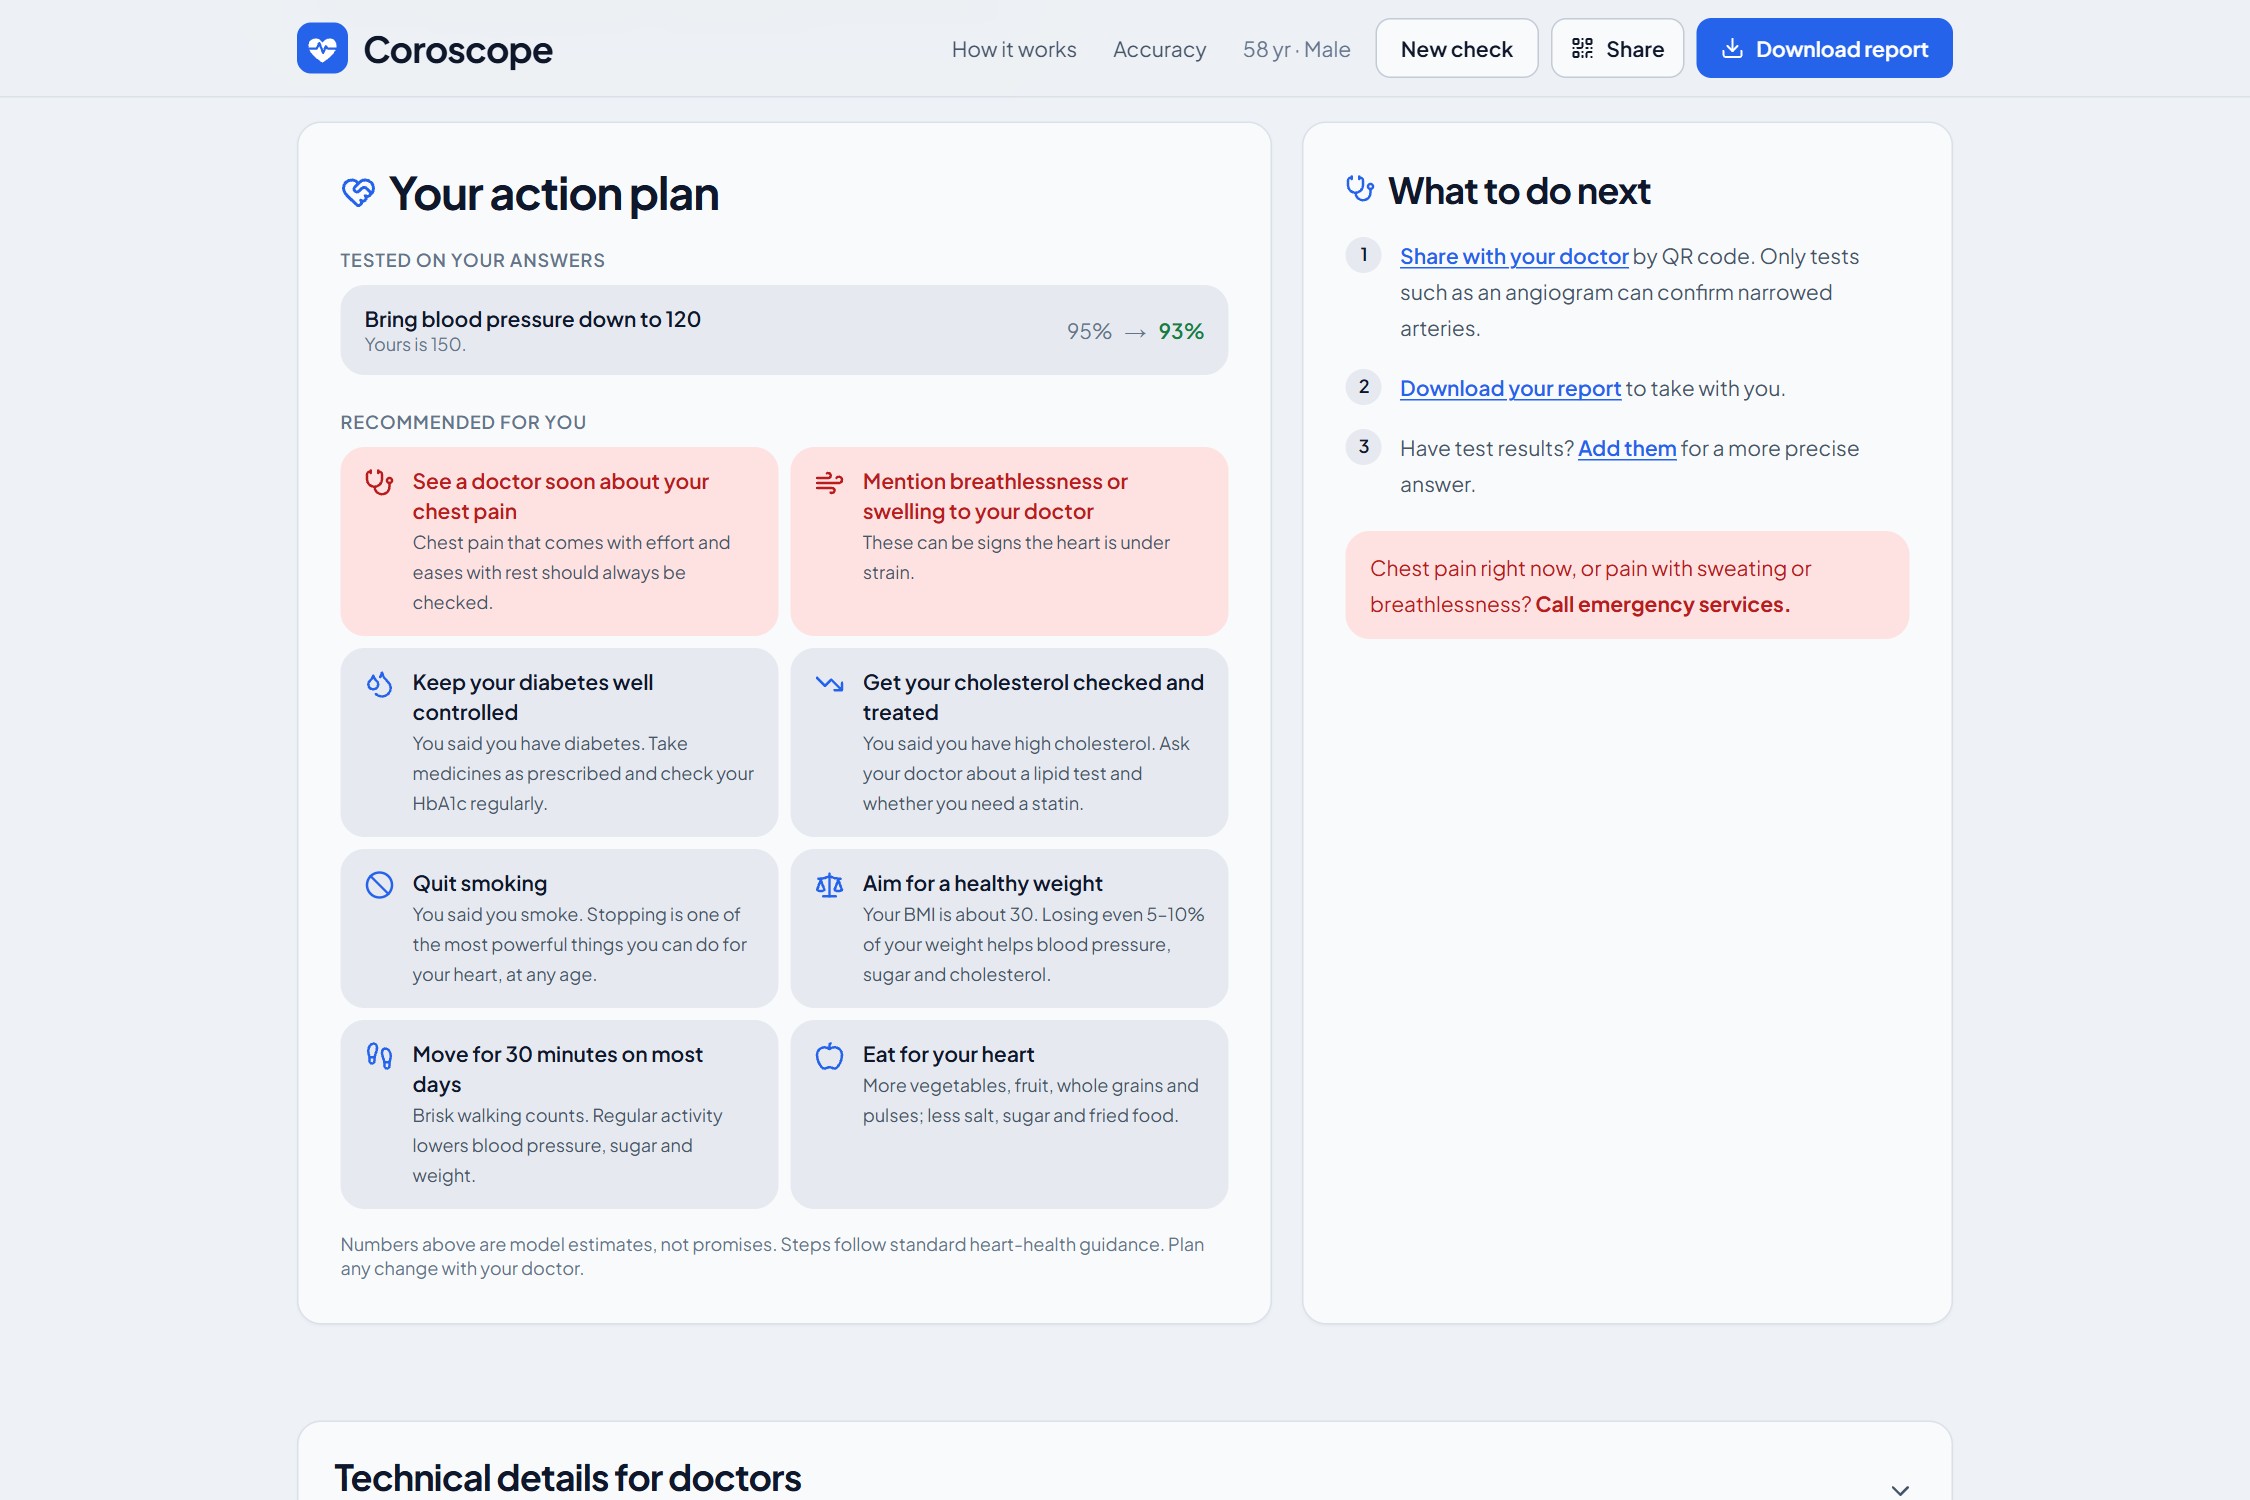
- Action plan: changes re-tested on your own answers (before → after), plus tailored next steps.
- Share with your doctor: a QR code opens the same results on their phone. Your answers travel inside the link; your name never does, and nothing is stored on a server.
- Two-page PDF report: one page for the patient, one for the doctor.
How I built it
Data. I used the extended Z-Alizadeh Sani dataset: 303 patients, 55 clinical features, with per-artery labels from angiography. The artery results (LAD, LCX, RCA, Cath) are never used as inputs. This is enforced in code and checked by tests.
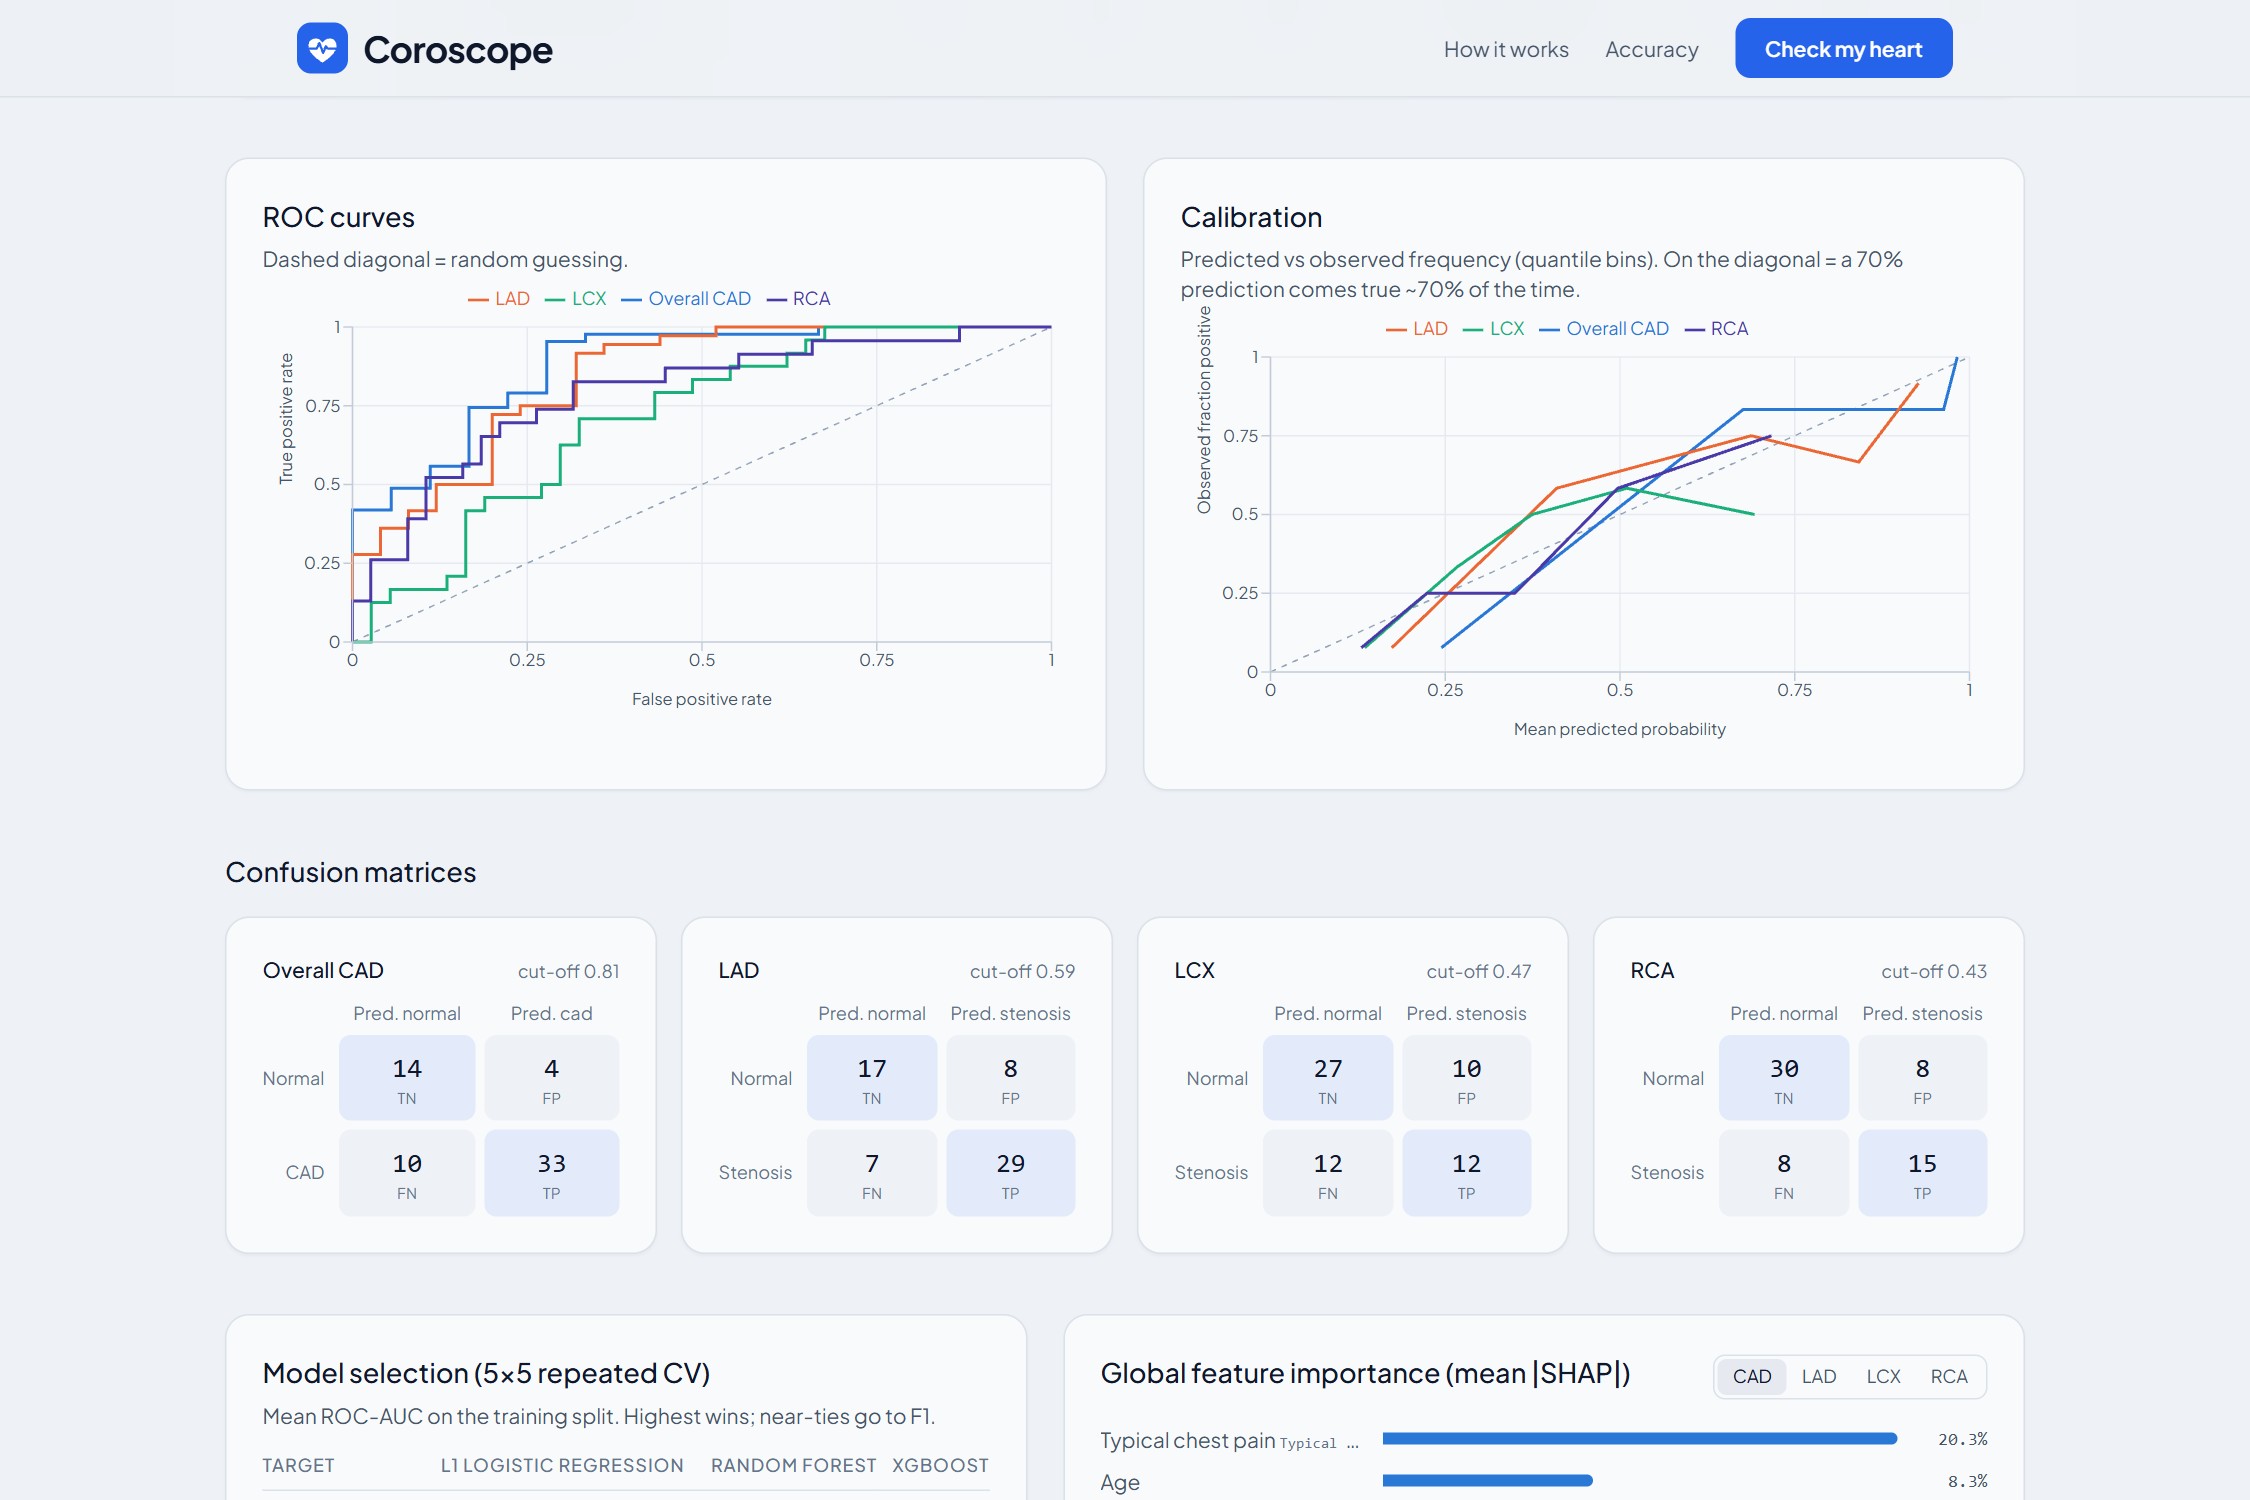
Models. For each of the 4 targets, I compared L1 logistic regression, random forest and XGBoost with 5×5 repeated stratified cross-validation, with all preprocessing inside each fold. 20% of patients were locked away before anything else and used only once, at the very end.
Calibration and cut-offs. Each winning model is calibrated, so "70%" really means about 70 in 100. Decision cut-offs are chosen on out-of-fold data with Youden's J:
$$J = \text{sensitivity} + \text{specificity} - 1$$
Explanations. SHAP (TreeExplainer / LinearExplainer) for every target and every patient. The three chest-pain columns are merged into one plain answer.
Heart age. This uses the Framingham office-based (BMI) formula from D'Agostino et al., 2008, not my models, because heart age needs a risk that grows smoothly with age.
Stack. Next.js 16 + React 19 + React Three Fiber on the front end. FastAPI + scikit-learn + XGBoost + SHAP on the back end. One docker compose up runs everything, and the trained models are in the repo, so it works straight after cloning.
Results (on the 61 held-out patients)
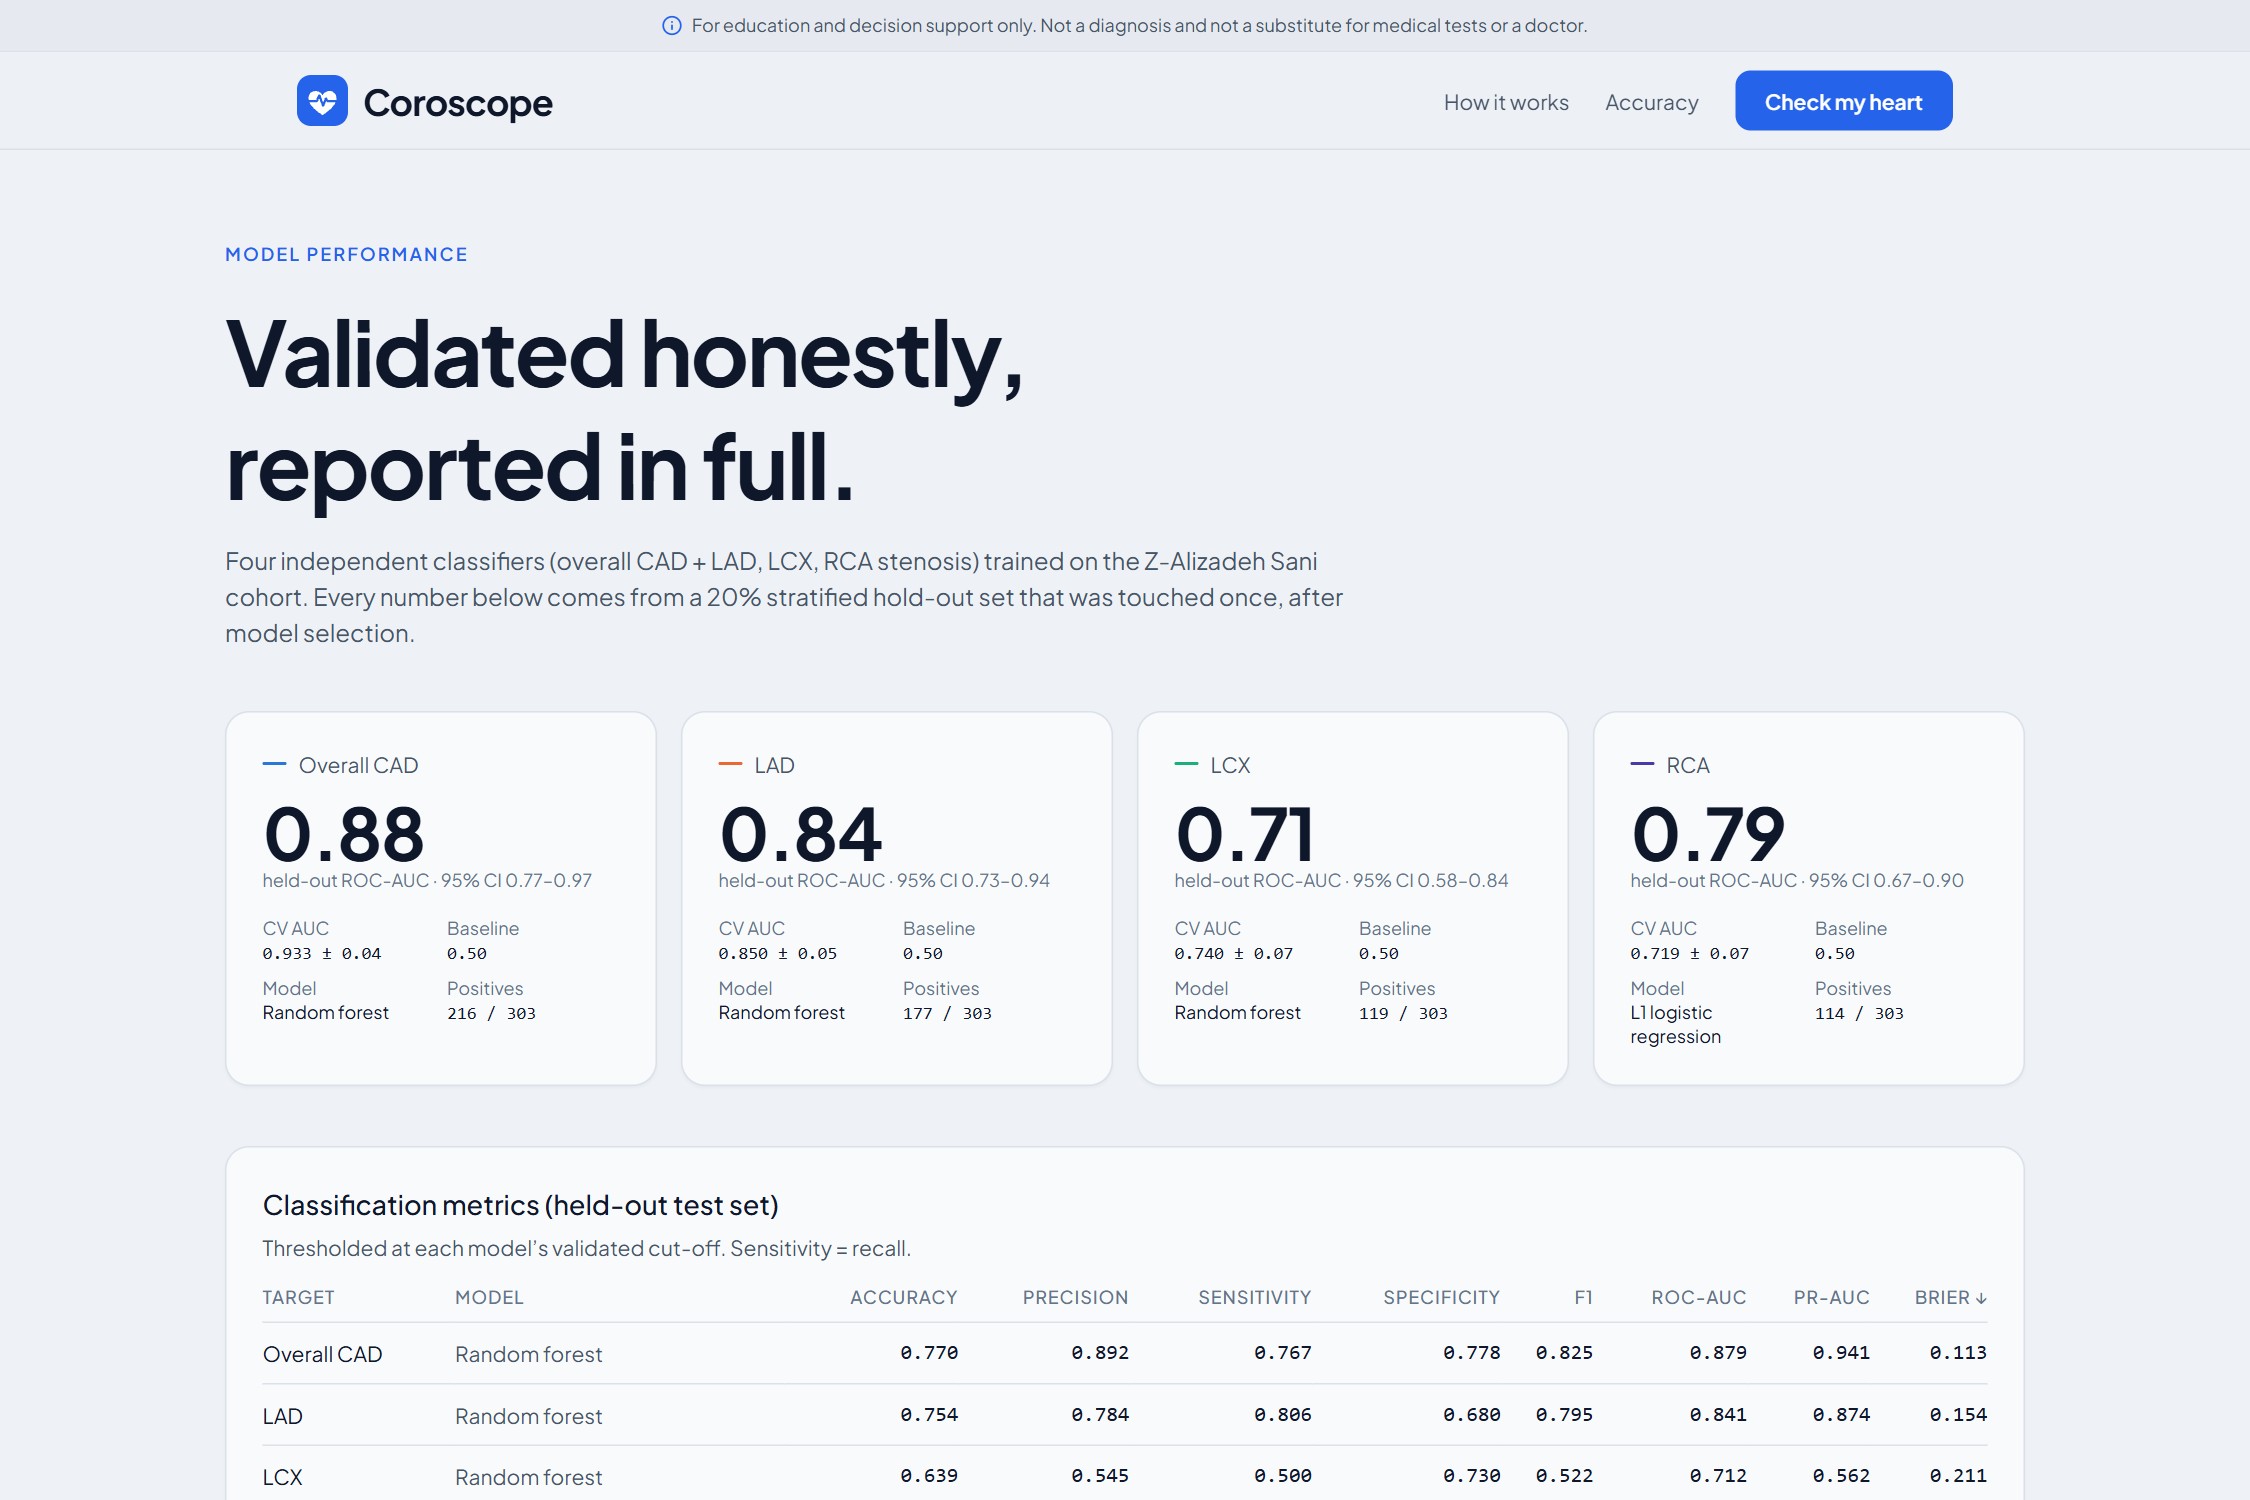
| Target | Model | ROC-AUC (95% CI) | CV ROC-AUC |
|---|---|---|---|
| Overall CAD | Random forest | 0.88 (0.77–0.97) | 0.93 |
| LAD (front) | Random forest | 0.84 (0.73–0.94) | 0.85 |
| LCX (side and back) | Random forest | 0.71 (0.58–0.84) | 0.74 |
| RCA (right, bottom) | L1 logistic regression | 0.79 (0.67–0.90) | 0.72 |
A prior-only baseline scores 0.50 on every target. Retraining from scratch reproduces exactly the same numbers.
Challenges I faced
- Normal people can't fill a 55-field medical form. I built a six-question quick check. Anything not answered is filled with a typical value, and the results page clearly says so.
- Making SHAP readable. Raw SHAP values mean nothing to a patient. I turned them into short sentences ("raised the risk a lot / a little") and kept the raw numbers in a collapsible section for doctors.
- Small data, honest numbers. With 303 patients it's easy to fool yourself. The locked test set, cross-validation, bootstrap confidence intervals and a leakage guard keep the numbers honest.
- The 3D heart. I placed coronary artery paths on a real anatomical model, made blood flow speed react to risk, and kept it smooth on laptops and phones.
- Heart age. My models aren't smooth in age, so I used the published Framingham formula, checked its coefficients against a reference implementation, and capped the display at "80+".
What I learned
- Validation design matters more than the model: a locked test set and leakage checks changed my numbers more than any tuning did.
- Explainability is a UX problem as much as a maths problem.
- Calibration is what makes a percentage trustworthy to show to a real person.
What's next
- Fill the form from a photo of a lab or echo report
- Answer the questions by voice, in English and Hindi
- Validate on a larger, multi-centre cohort
- A live hosted version
Built With
- docker
- fastapi
- jspdf
- machine-learning
- next
- numpy
- pandas
- python
- react-three-fiber
- recharts
- scikit-learn
- shap
- tailwindcss
- three
- typescript
- xgboost


Log in or sign up for Devpost to join the conversation.