-
-

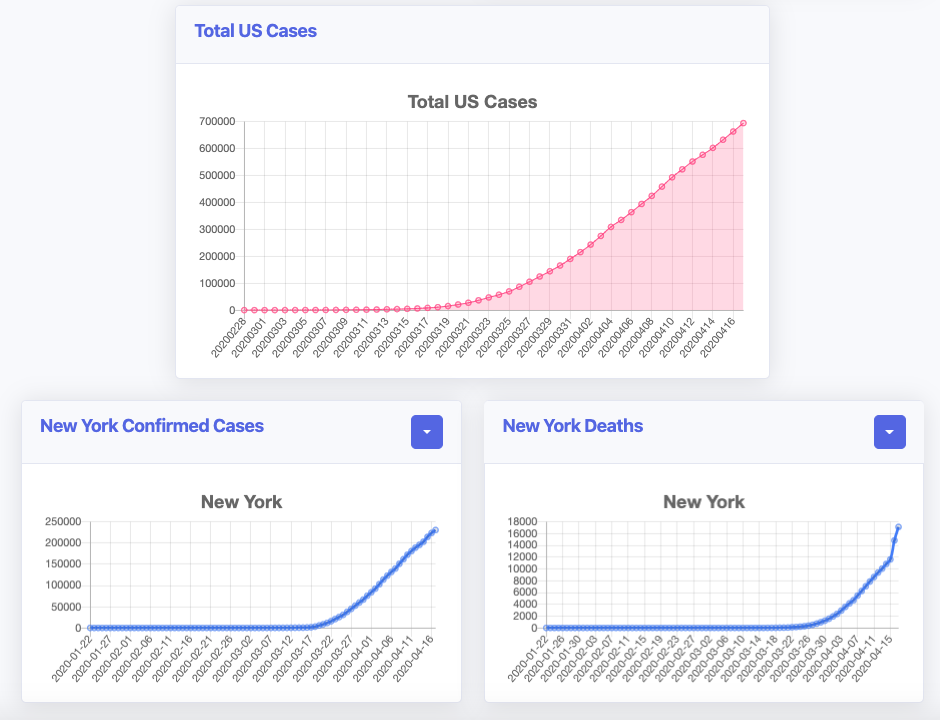
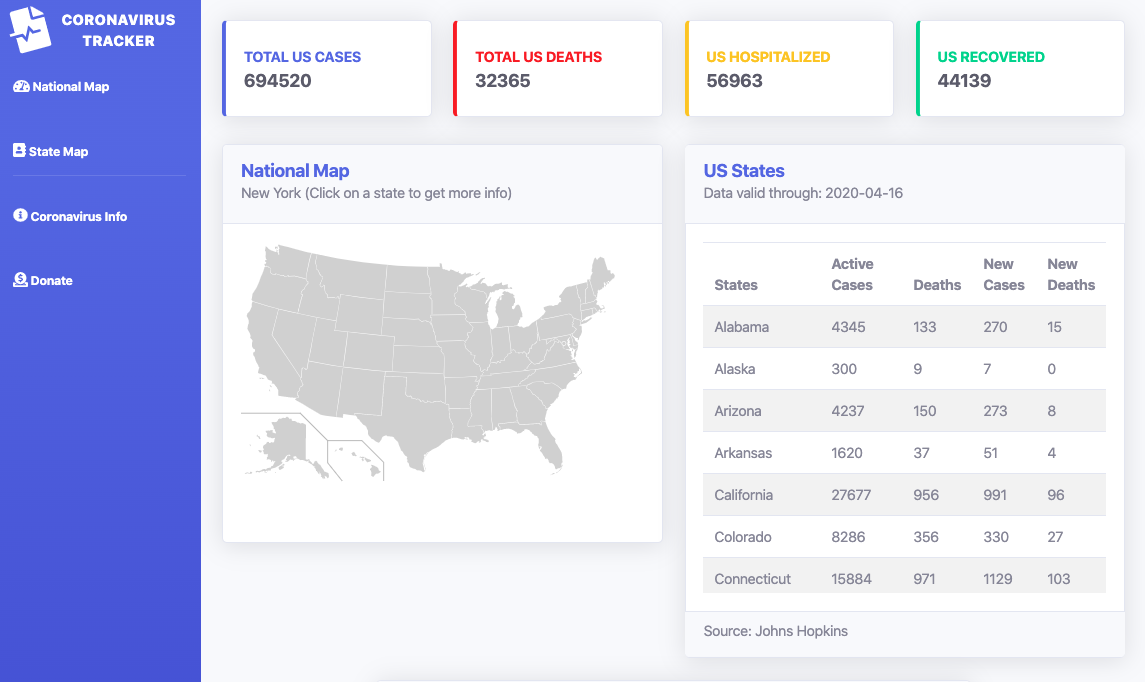
Example Graphs
-
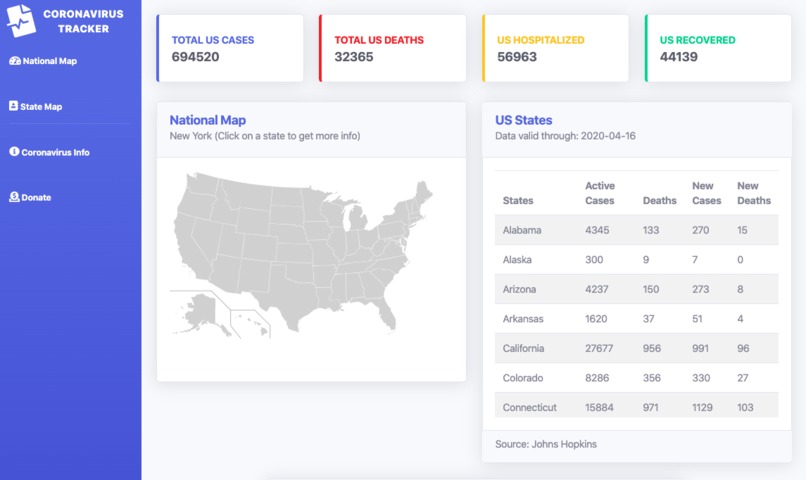
Map View
Inspiration
- Other websites provide nationwide visualizations of coronavirus data, but it is difficult to find county-specific information about the prevalence of the virus. ## What it does
- Allows users to visualize a variety of coronavirus statistics at both the county and state level.
- Users can view an interactive map and table of case, death, new case, and new death counts for a specific day, or can view a time series plot of a county or state over time. ## How I built it
- Frontend written in React with bootstrap for css
- Backend in Node.js to maintain an accurate and up-to-date Firestore database
- minor parsing scripts written in Python ## Challenges I ran into
- the repository got messed up at one point because we switched from class-based to functional React components ## What I learned
- React
- git push --force ## What's next for Coronavirus tracker
- Adding safety and prevention information so that users can get the most accurate information about how to protect themselves, their families, and their friends
- Running ads so we don't go broke from all the firebase queries

Log in or sign up for Devpost to join the conversation.