-
-

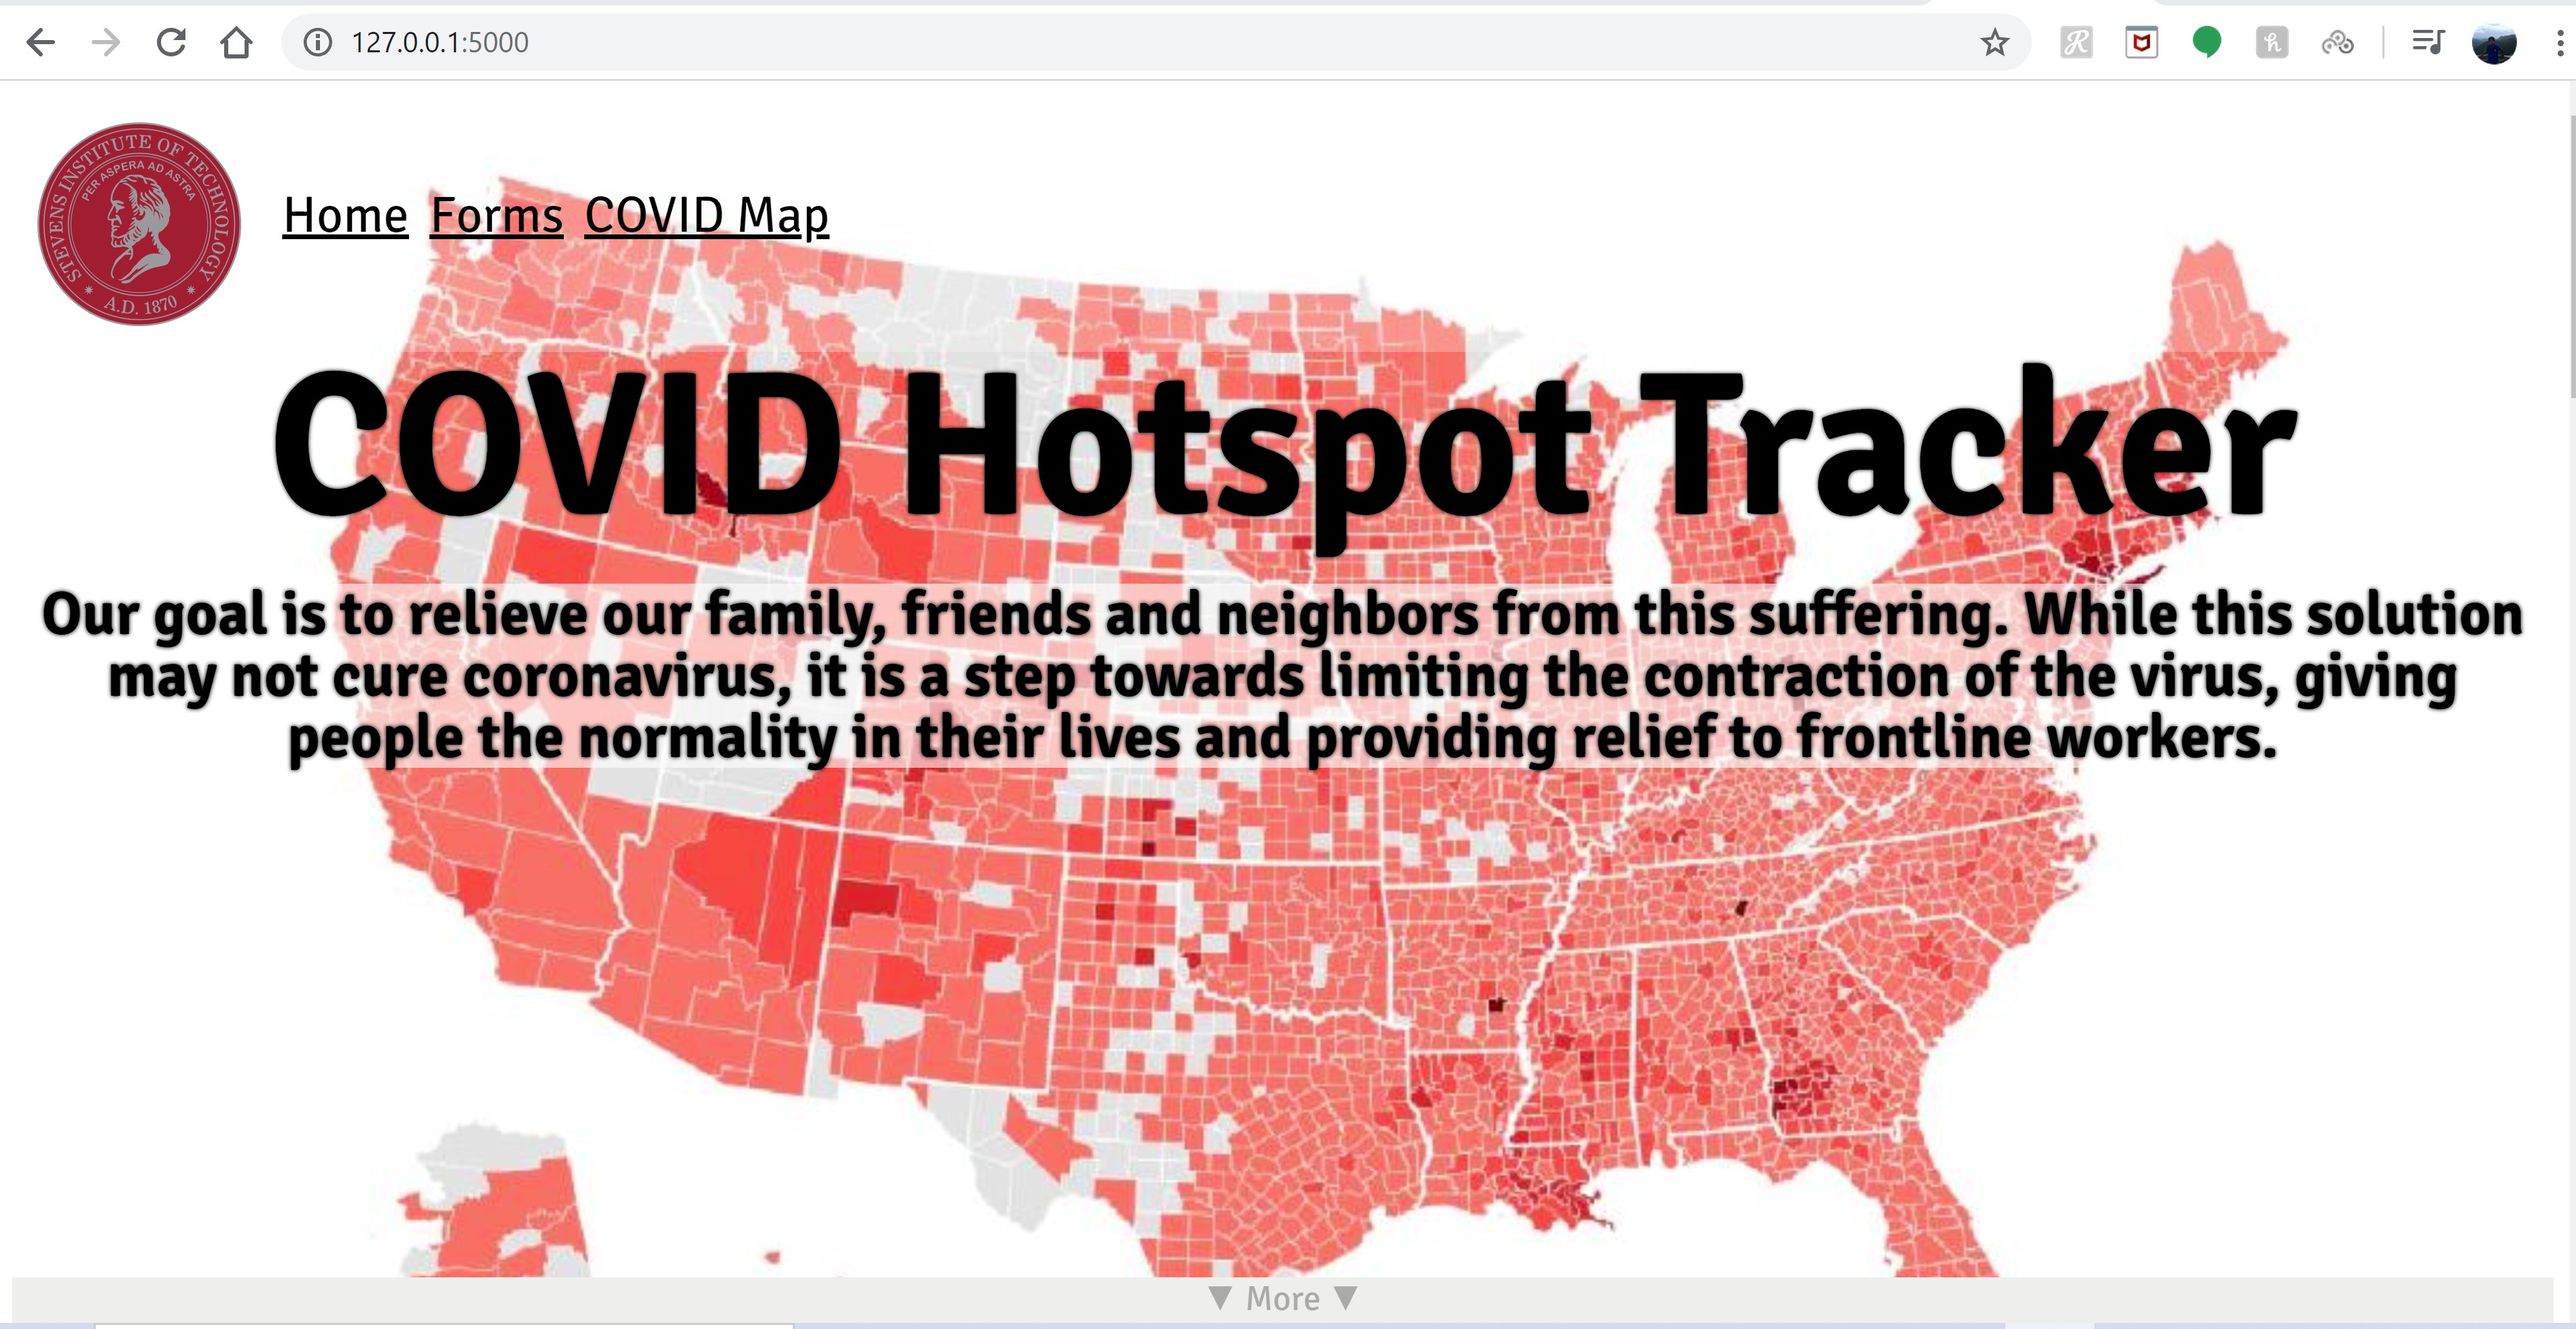
HomePage
-

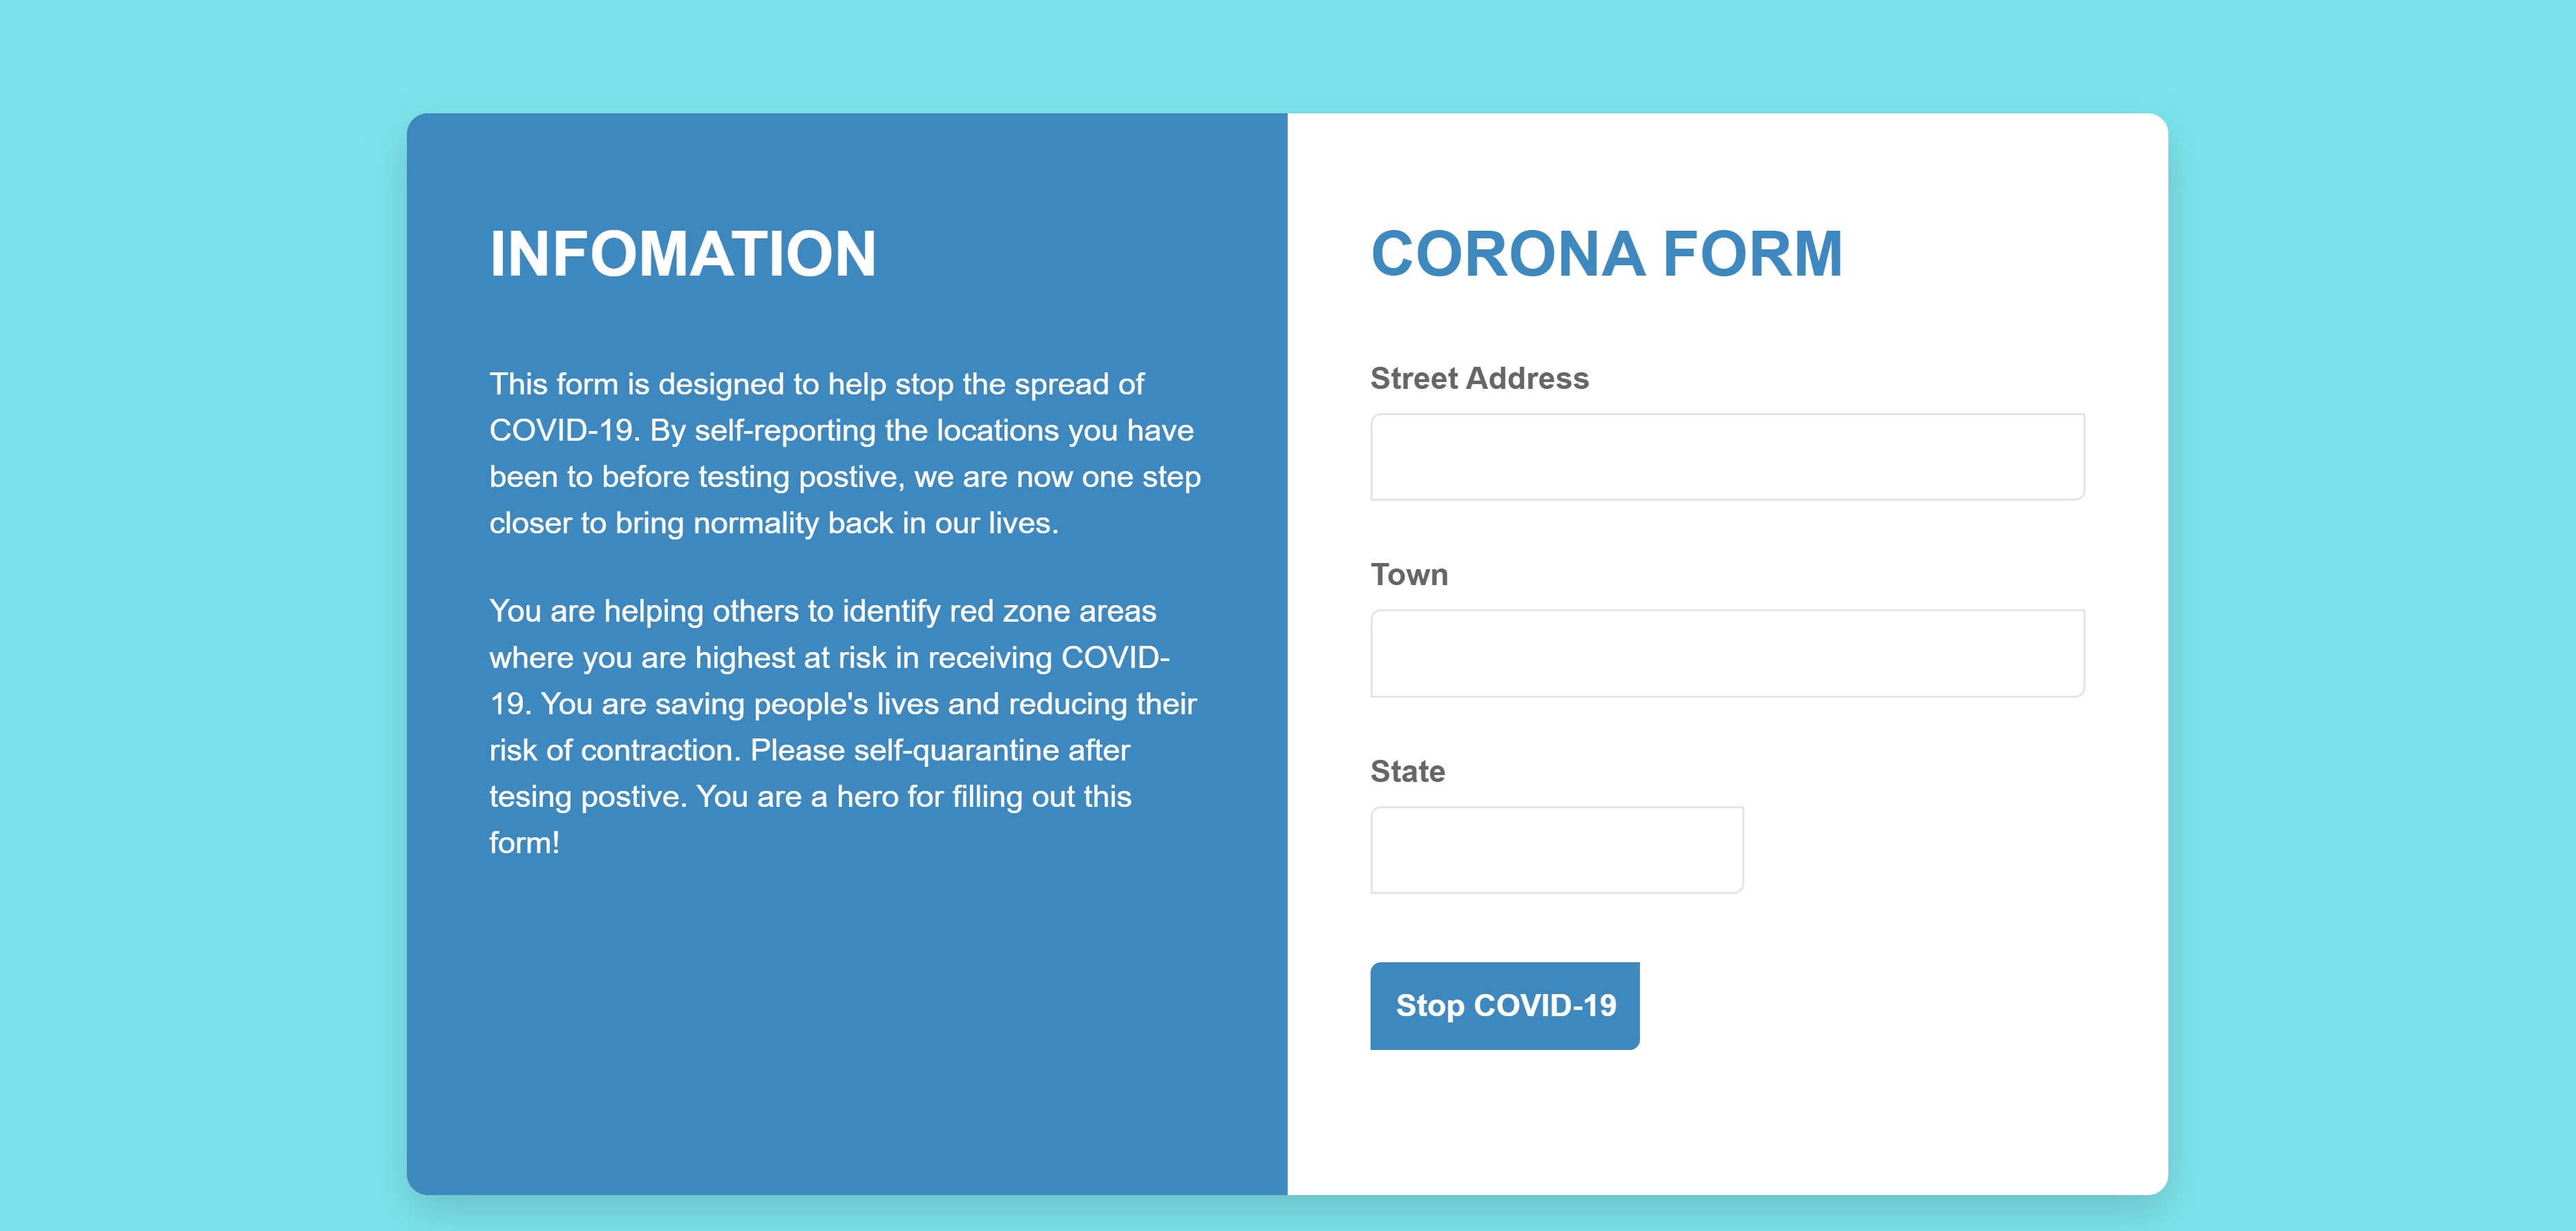
Corona Form
-
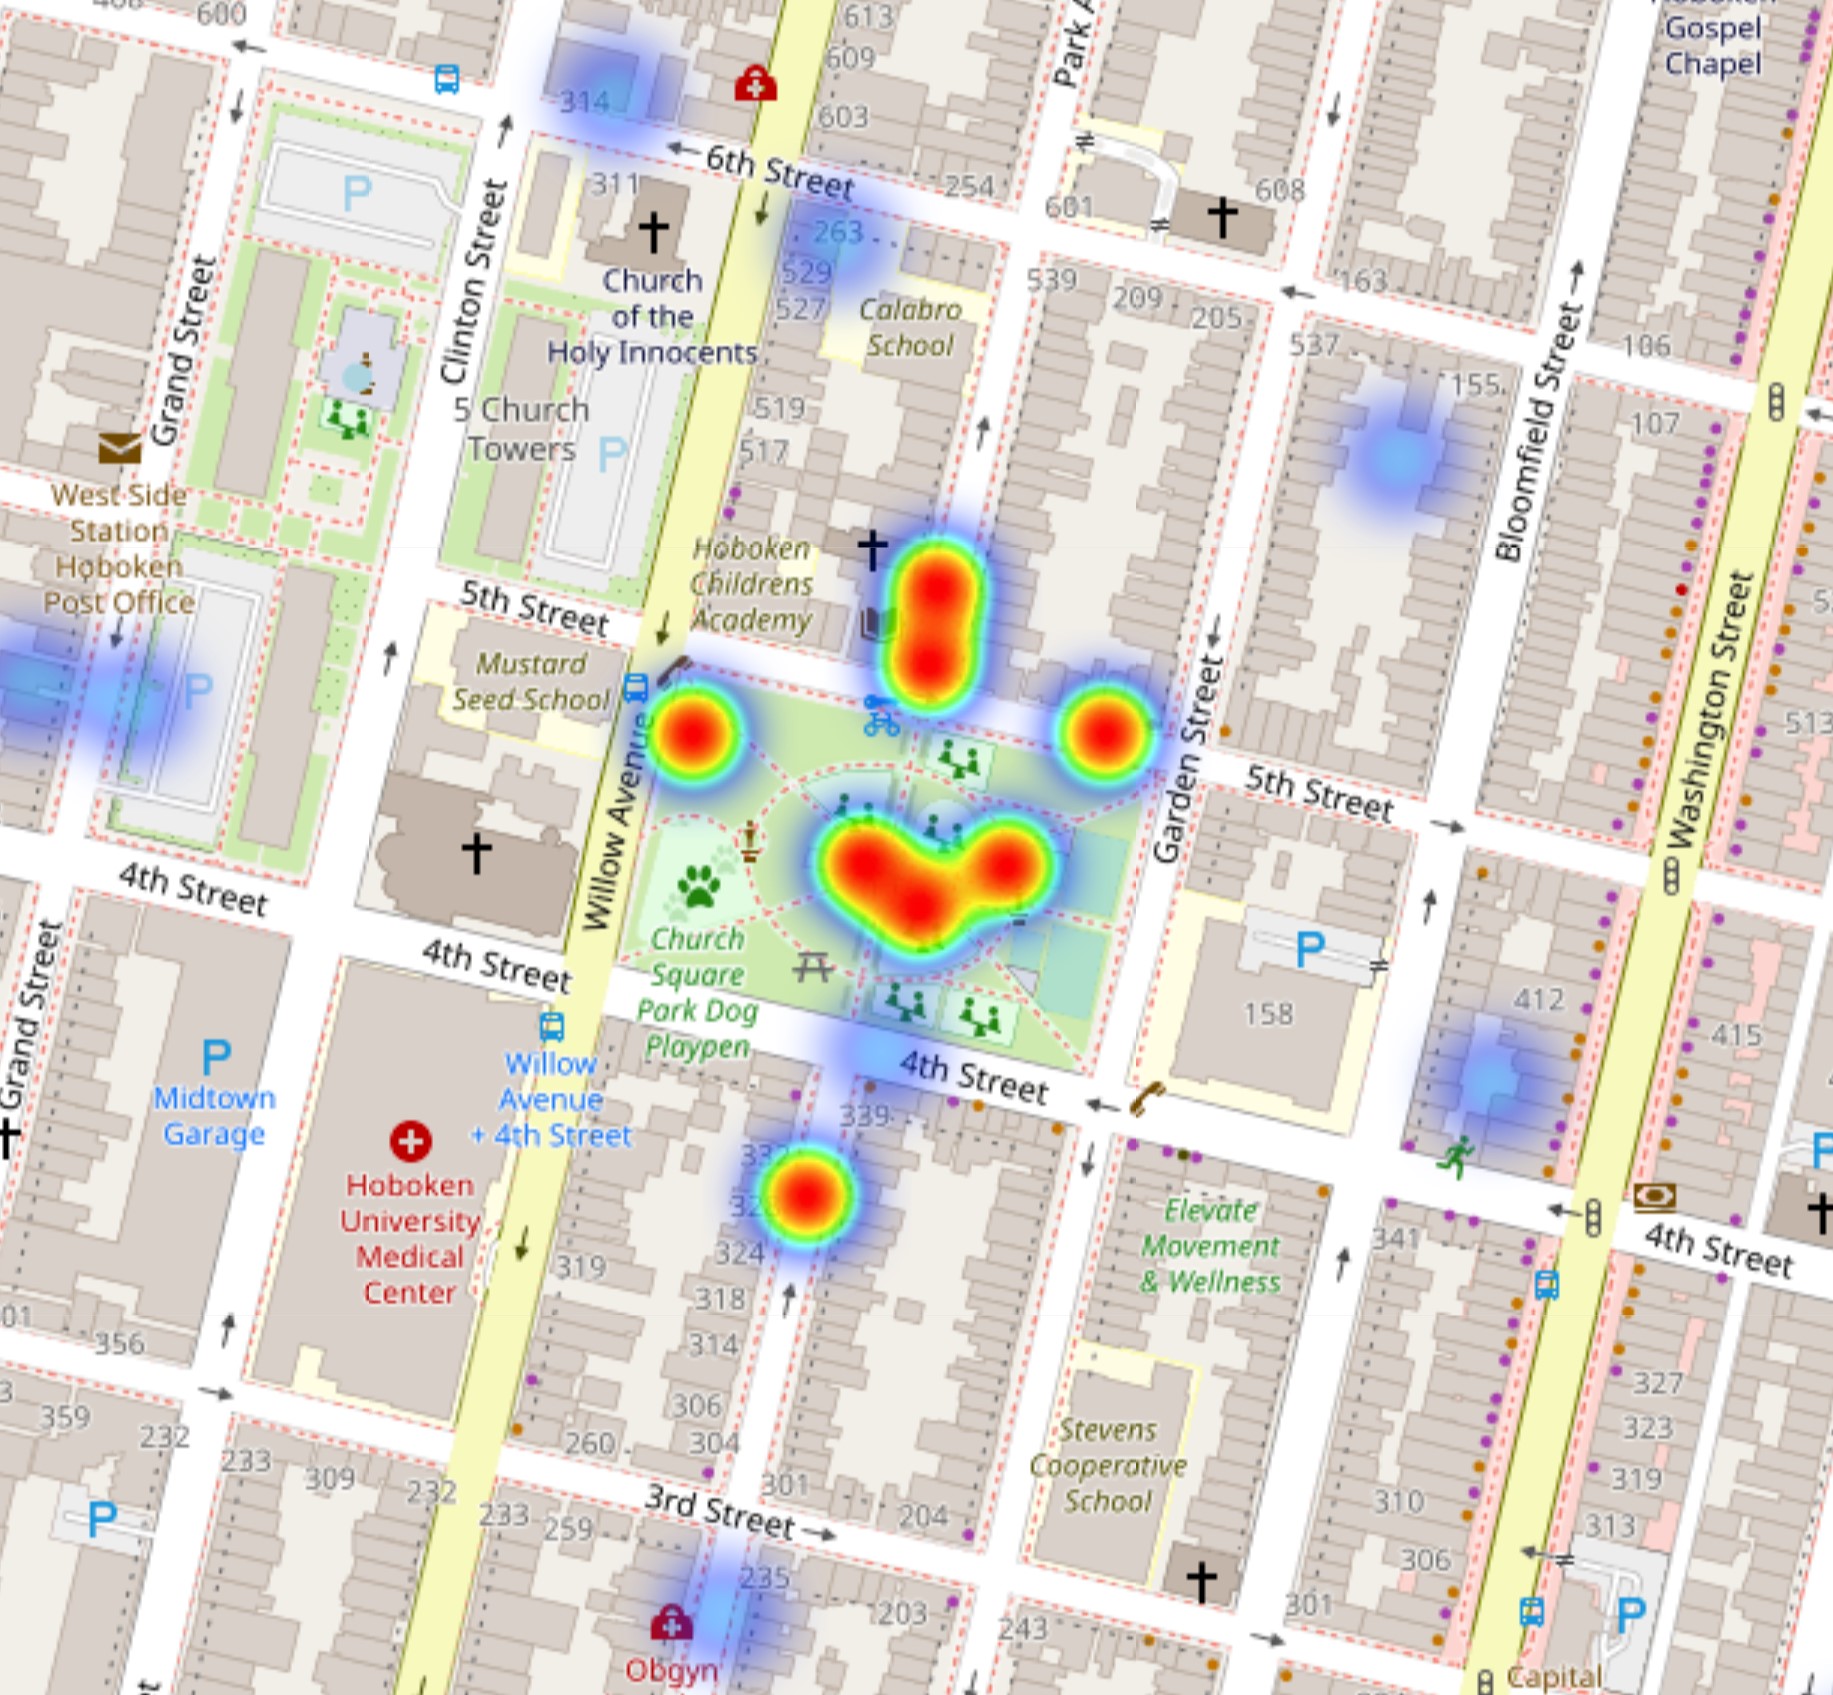
COVID Map
-
Background
-
Problem Page
-
Solution Page
-
Applications
Inspiration:
To combat the spread of corona-virus, many countries have imposed strict lockdowns. The goal was to limit how much people were traveling to reduce the spread of corona-virus. However, due to economic reasons many countries need to reopen business and ease restrictions. Currently many people track the amount of cases in each state and county, but we wanted a platform that could keep track and inform citizens of dangerous areas outside of their homes that they should avoid or take extra precautions around.
Problem:
COVID-19 is difficult to deal with because of how rapidly it can spread. The disease can be contracted either airborne or from surfaces. On surfaces, COVID-19 can last up to five to six days, which allows a person who has COVID-19 to spread it to others over a long period after they have left. So someone who is positive for coronavirus and has not identified it, can be traveling and touching surfaces at stores and restaurants leaving those who aren't infected to potentially touch the same surfaces and contract the virus. The problem we address is accounting for the travels of the person before they are confirmed as having COVID-19.
Solution:
We decided to build a platform that helps people visualize a more detailed view of where exactly the virus could be because the spread of the virus which occurs through air and surfaces, which makes public places like stores and restaurants danger zones. In the initial stages of this idea, we rely on everyone in the community to be doing their part and rely on the data coming from reliable sources, however with time, we plan to scale it to have only government officials report data, which we will talk about in a further section.
Goal:
Our goal is to give people the normality in their lives and provide relief to front line workers.
How are we Different?
We are different because our platform displays red zone areas and severity of the contraction of the virus, whereas other platforms notify someone if they were in contact with someone who tested positive. The ultimate goal of this platform is to make sure that people take proper precautions before going to a designated area or even avoid COVID red-zone area, thus promoting proper social distancing techniques and flattening the curve.
Security and Privacy:
Our platform complies with the HIPAA (Health Insurance Portability and Accountability Act) privacy policies as we do not store any health records, the individual’s name or address, and the individual’s IP address. The only data that is stored are the locations the individual has traveled to, which is self-reported. Finally, we added information on the self-reporting form to inform people the situation that is taking place.
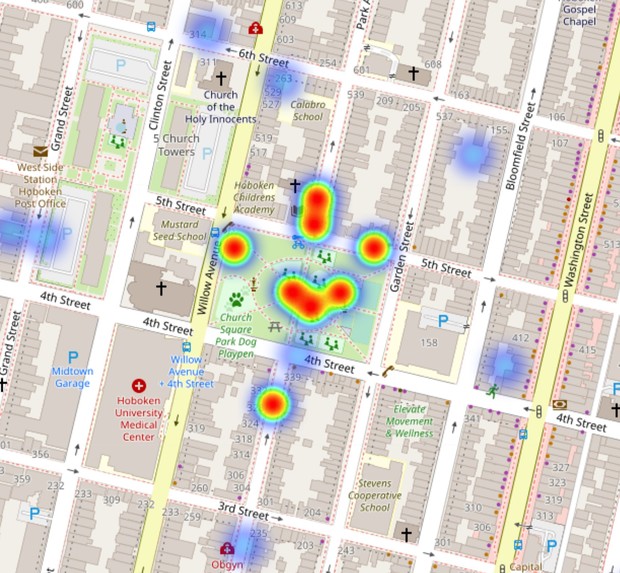
What it Does?
There would be two types of users that access our platform: those who have already contracted the virus, and those who haven’t. Those who have already contracted the virus would access the website, and fill out the form with information on where they travelled in the last five days, as the virus lasts for a maximum time for five days on surfaces. Then, by updating this on the map of our platform, this would help the second type of users, those who haven’t contracted the virus, to be extra precautious of where they choose to go during this pandemic. The heatmap locations will be updated with data that is not older than six days since the virus is proven to die within that time.
How we built it?
We used HTML and CSS to design the homepage, which discussed the background of COVID-19. On the click of the “STOP COVID Button”, we used Flask on python to retrieve data from the HTML form and store the data within our python file. We were able to do this by creating a localhost server that connected the HTML to our python file. The python file would send a request to HTML and the HTML would send the data through an HTTP supported method of transportation “POST”, which safely sends encrypted data over the web server to the python file.
We also used python to import certain packages such as the GeoCoder (translates Address to latitude and longitude), Pandas (to store data in a frame and to write to an Excel File), and Folium (to display the heatmap to represent the severity of COVID-19).
Challenges we ran into:
As the project progressed, we realized we had to constantly modify the initial project because of restraints we had. Due to the lack of time, we compromised certain features and focused solely on providing a fully working solution. In addition, we were not aware of how to implement many of our ideas, which required us to self teach many concepts using HTML, CSS, and Python.In Python, we had to research the most effective packages for parsing data and visualizing the map locations. We also had to learn how to create and implement a server that could secure an encrypted communication between the HTML and the python file.
Accomplishments we are proud of:
To create our project required more than learning about code, we had to learn to manage our time and work effectively with each other. We collaborated as a team to find a time that would work with all of us. In addition, we kept checks on each other to make sure each member was getting their deliverables completed on time.
What We Learned:
As a group, we learned there are so many resources out there and if we all work in unison, we can find solutions to any problem. We learned to create a working product, and that we must first identify a problem and then address it. The solution we create must be realistic and feasible. We learned the best approach is with agile principles and constantly modify the requirements to fit our goals and needs. Through this project, we learned the product we created can make a real impact on society and truly reduce the risk of contraction.
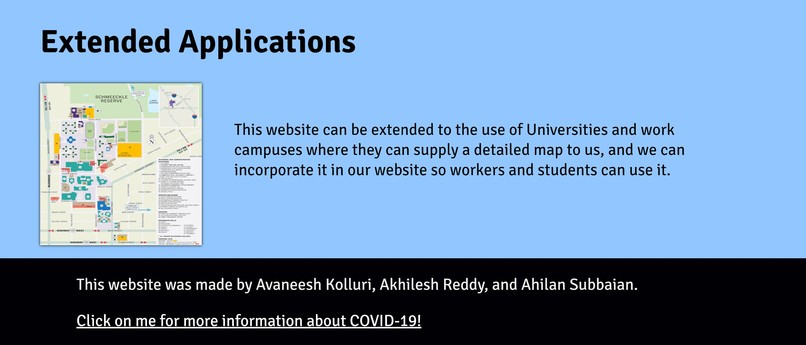
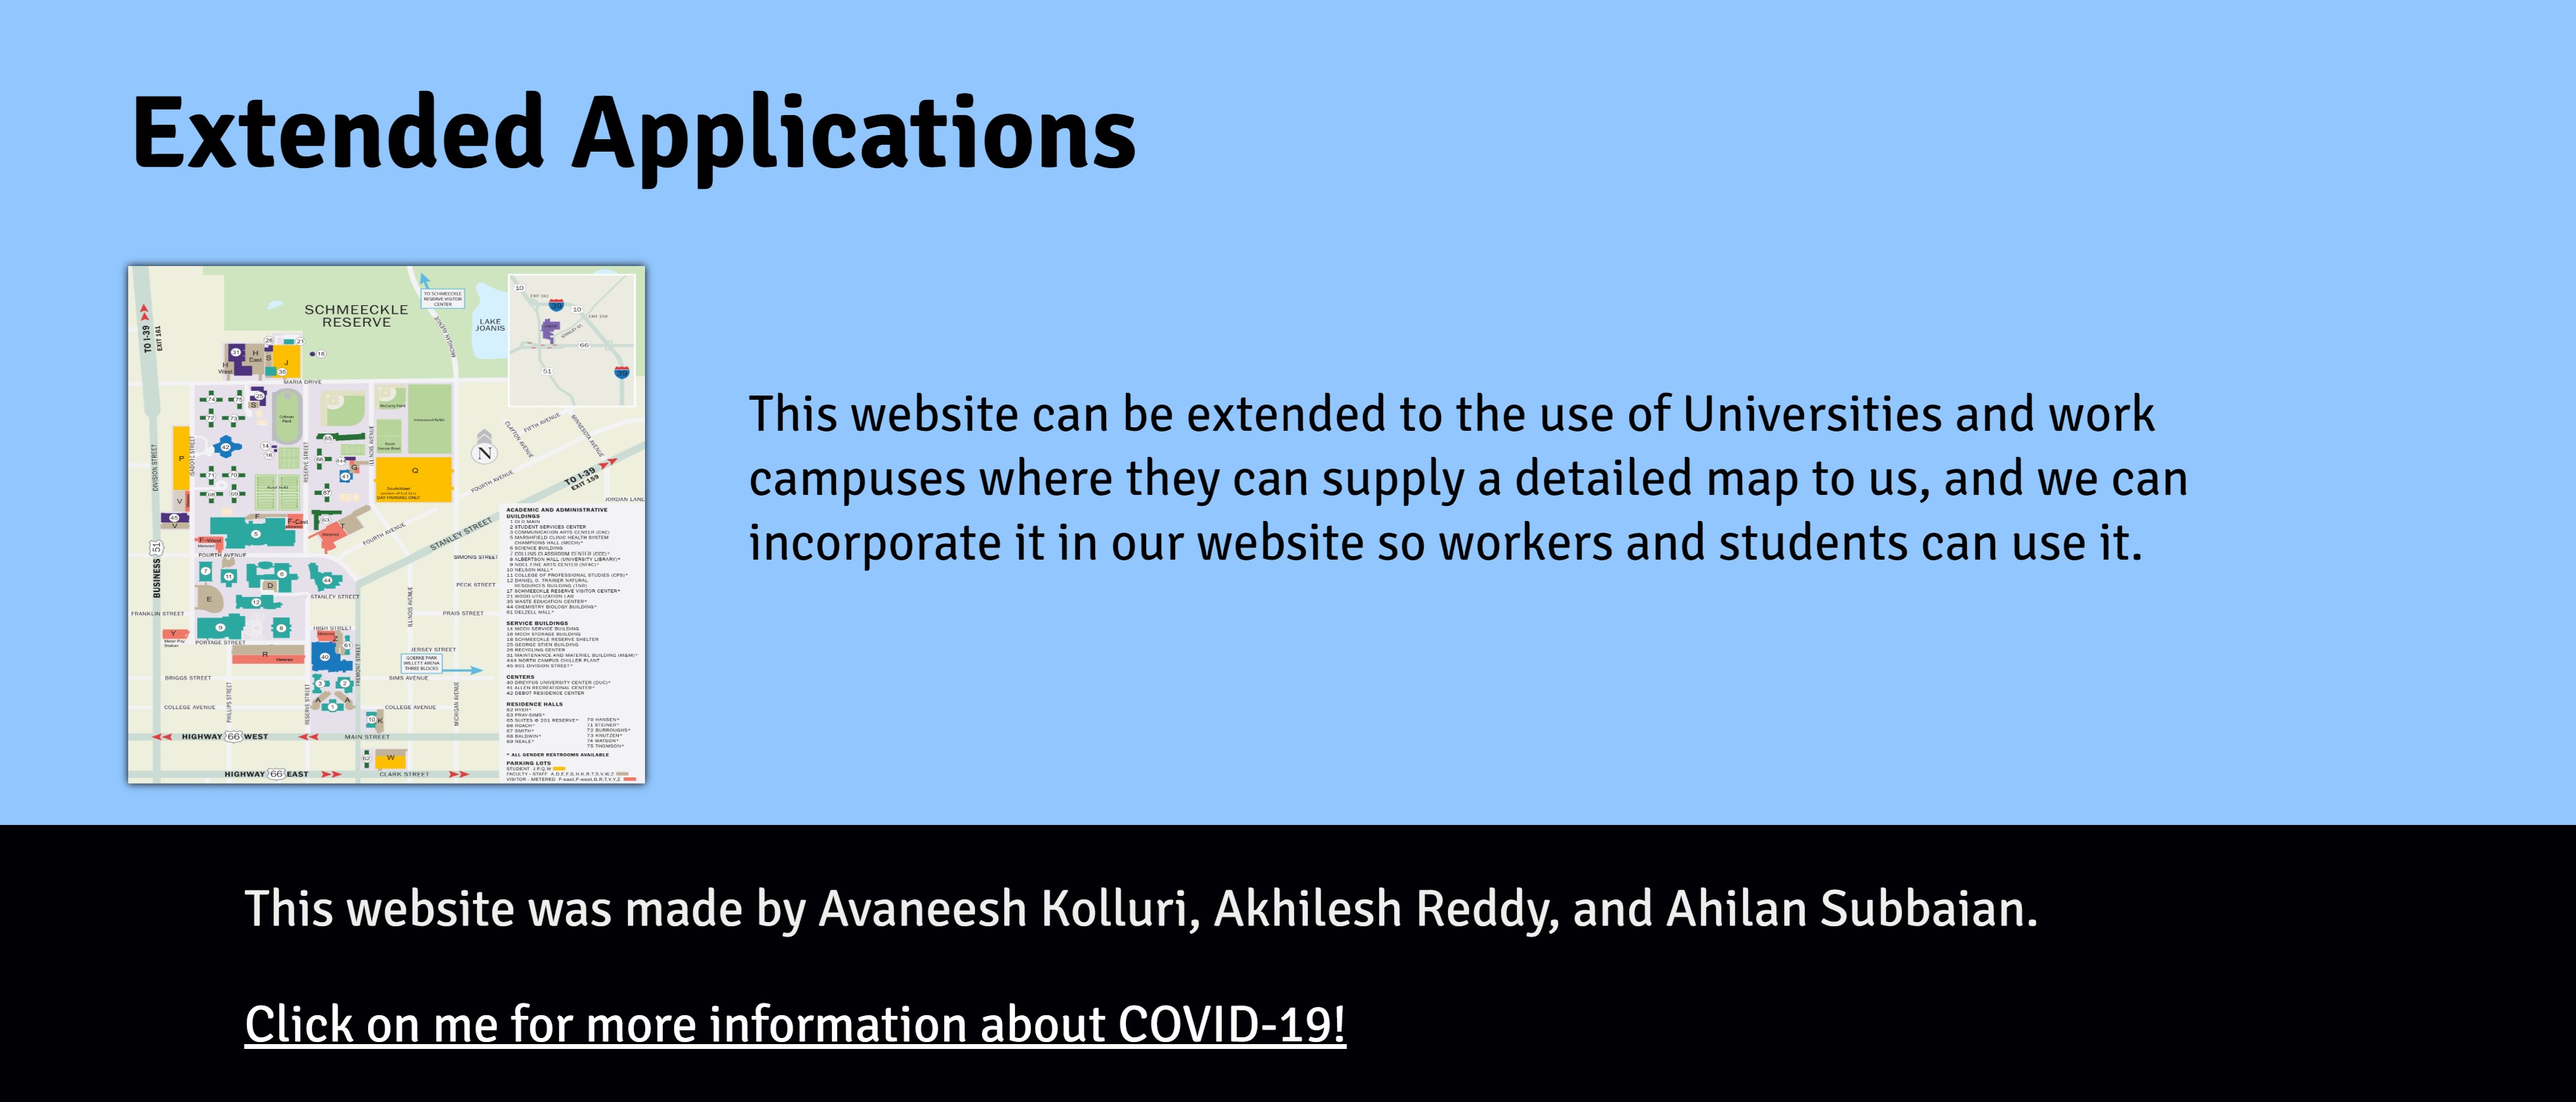
Scalable Opportunities:
Our project can be extended to be applied to University and Work campuses where they can supply a map of the campus and we show students and staff recent positive cases which cater to their location. For example, Stevens Institute of Technology would supply a detailed campus map to us, which in turn we would generate a heat map for them where their students and faculty can use for more specific information.
The government can also adapt our platform to provide more accurate data, rather than self-reporting, by using their contact tracing team to submit the locations where COVID patients have traveled to provide more accurate data.
What’s Next?
We will build this platform to a commodity that every community uses. The next immediate change that we plan to do is build a secure web database using Amazon Web Services (AWS) in order to securely store the user data. In this hackathon, we had to build an excel file full of data in order to simulate a database to present our platform, however that wouldn’t be used in the final implementation of the platform.
After we have a secure database for our platform, we will make the program more user-friendly. We will extend this idea to be an app for users to access so they can always check the COVID status of locations on the go easily, without having to go to the website every time. In addition, instead of the user inputting a street address, we will implement a drag and drop feature, where the user can click on the location they were at, which saves the user time to look up the street address of where they went.
"Even 15 reports can save 15 lives or more." - CoronaVirus HotSpot Tracker Team


Log in or sign up for Devpost to join the conversation.