Inspiration
The Novel Corona Virus had influenced each and every country, even the Countries with high hospitality are affected with it. So, I want to make a map to watch over it distribution.
What it does
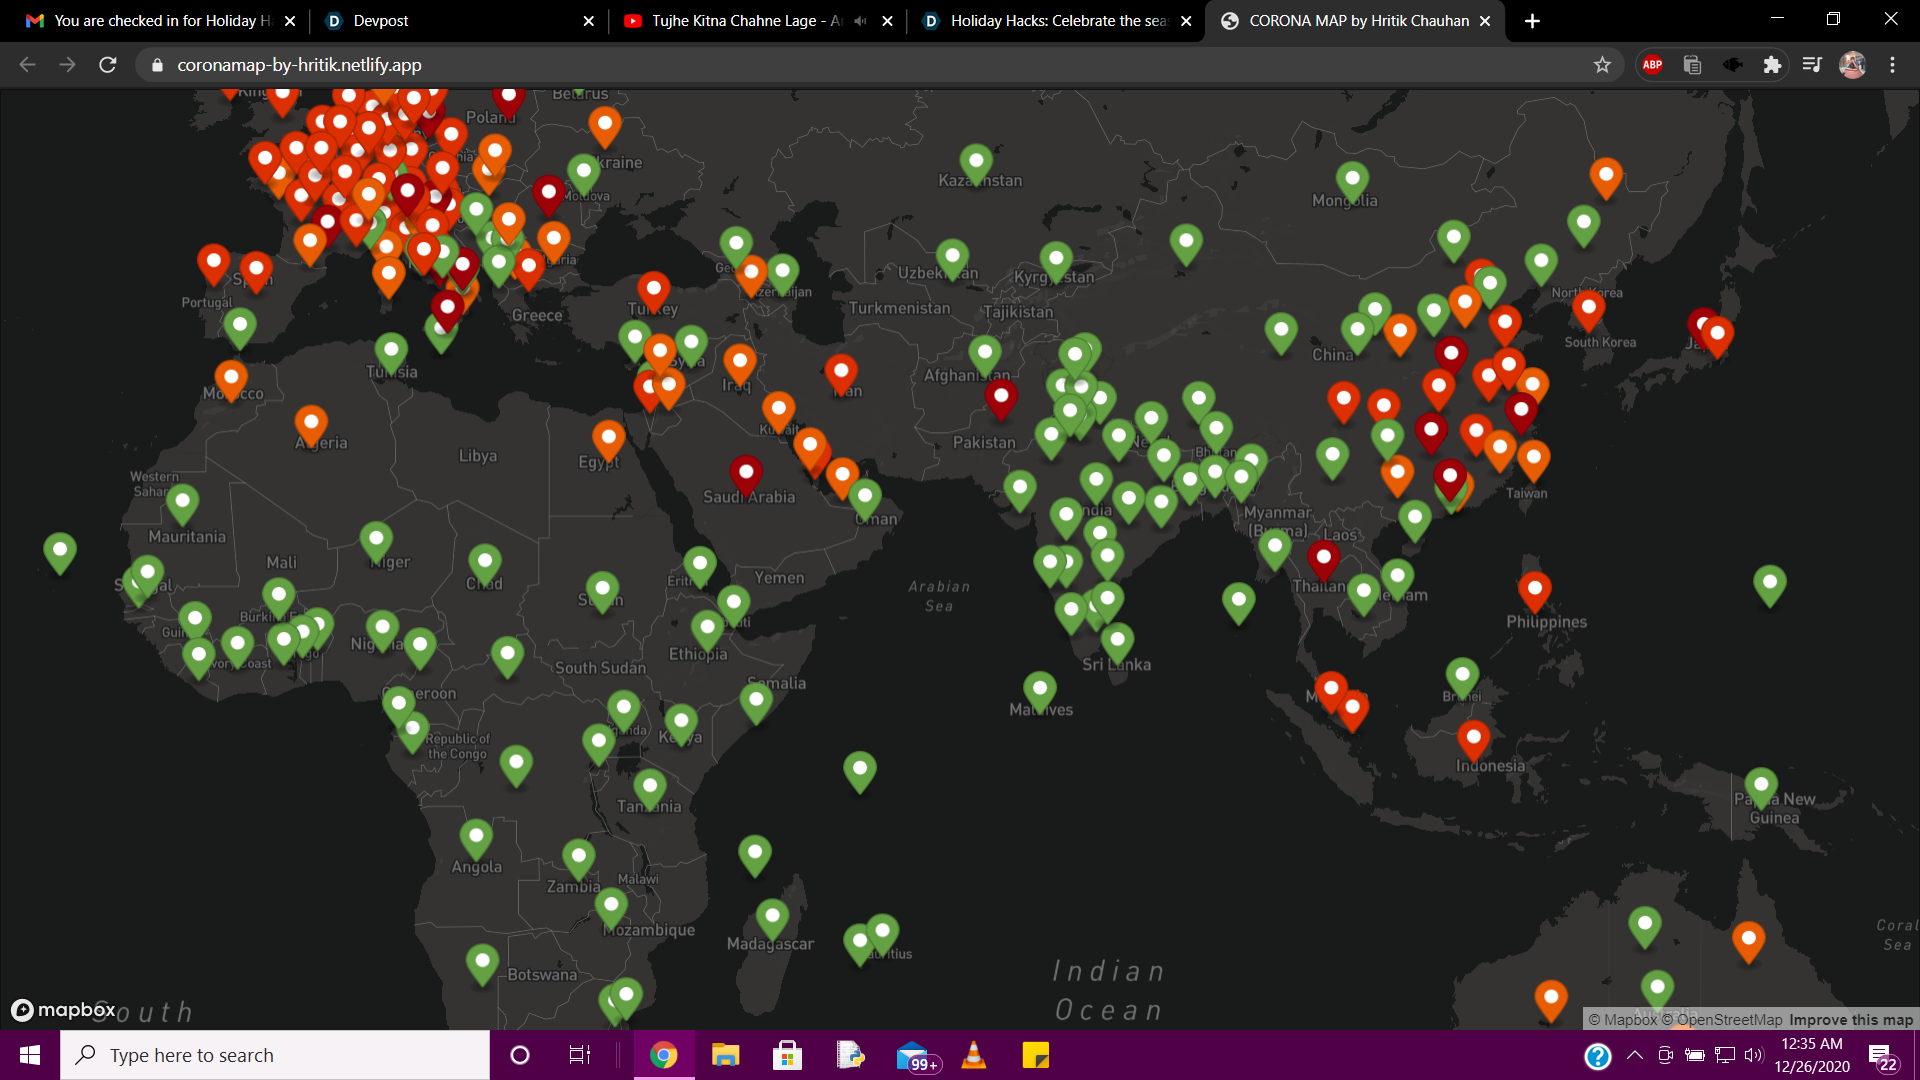
The project highlights the area affected with the corona map, it shows how many case are in that particular area.
How I built it
--The project is build with the help of Map box GL JS {Map Box GL JS is a JavaScript library for vector maps on the Web. Its performance, real-time styling, and interactivity features set the bar for anyone building fast, immersive maps on the web.} -- The record of the corona count is fetched from a json file which than later used by JavaScript to plot a distribution over the WORLD MAP.
Challenges I ran into
--The project was quite simple but it was my first project regarding the use of Map Box GL JS so it took time to fully understand this new library.
Accomplishments that I'm proud of
--To be the the part of the my first virtual Hackathon
What I learned
--Map Box GL JS
What's next for Coronavirus Distribution on World Map
-- thinking to make it with a live API for auto updating the data.


Log in or sign up for Devpost to join the conversation.