-
-
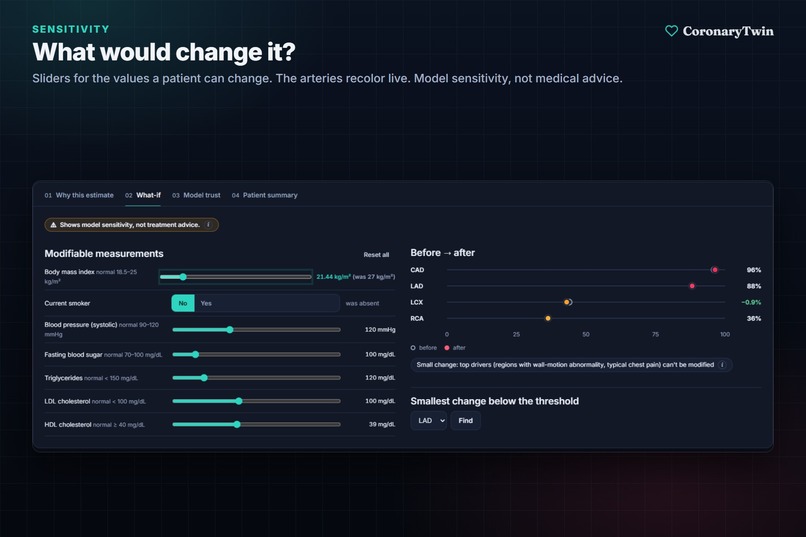
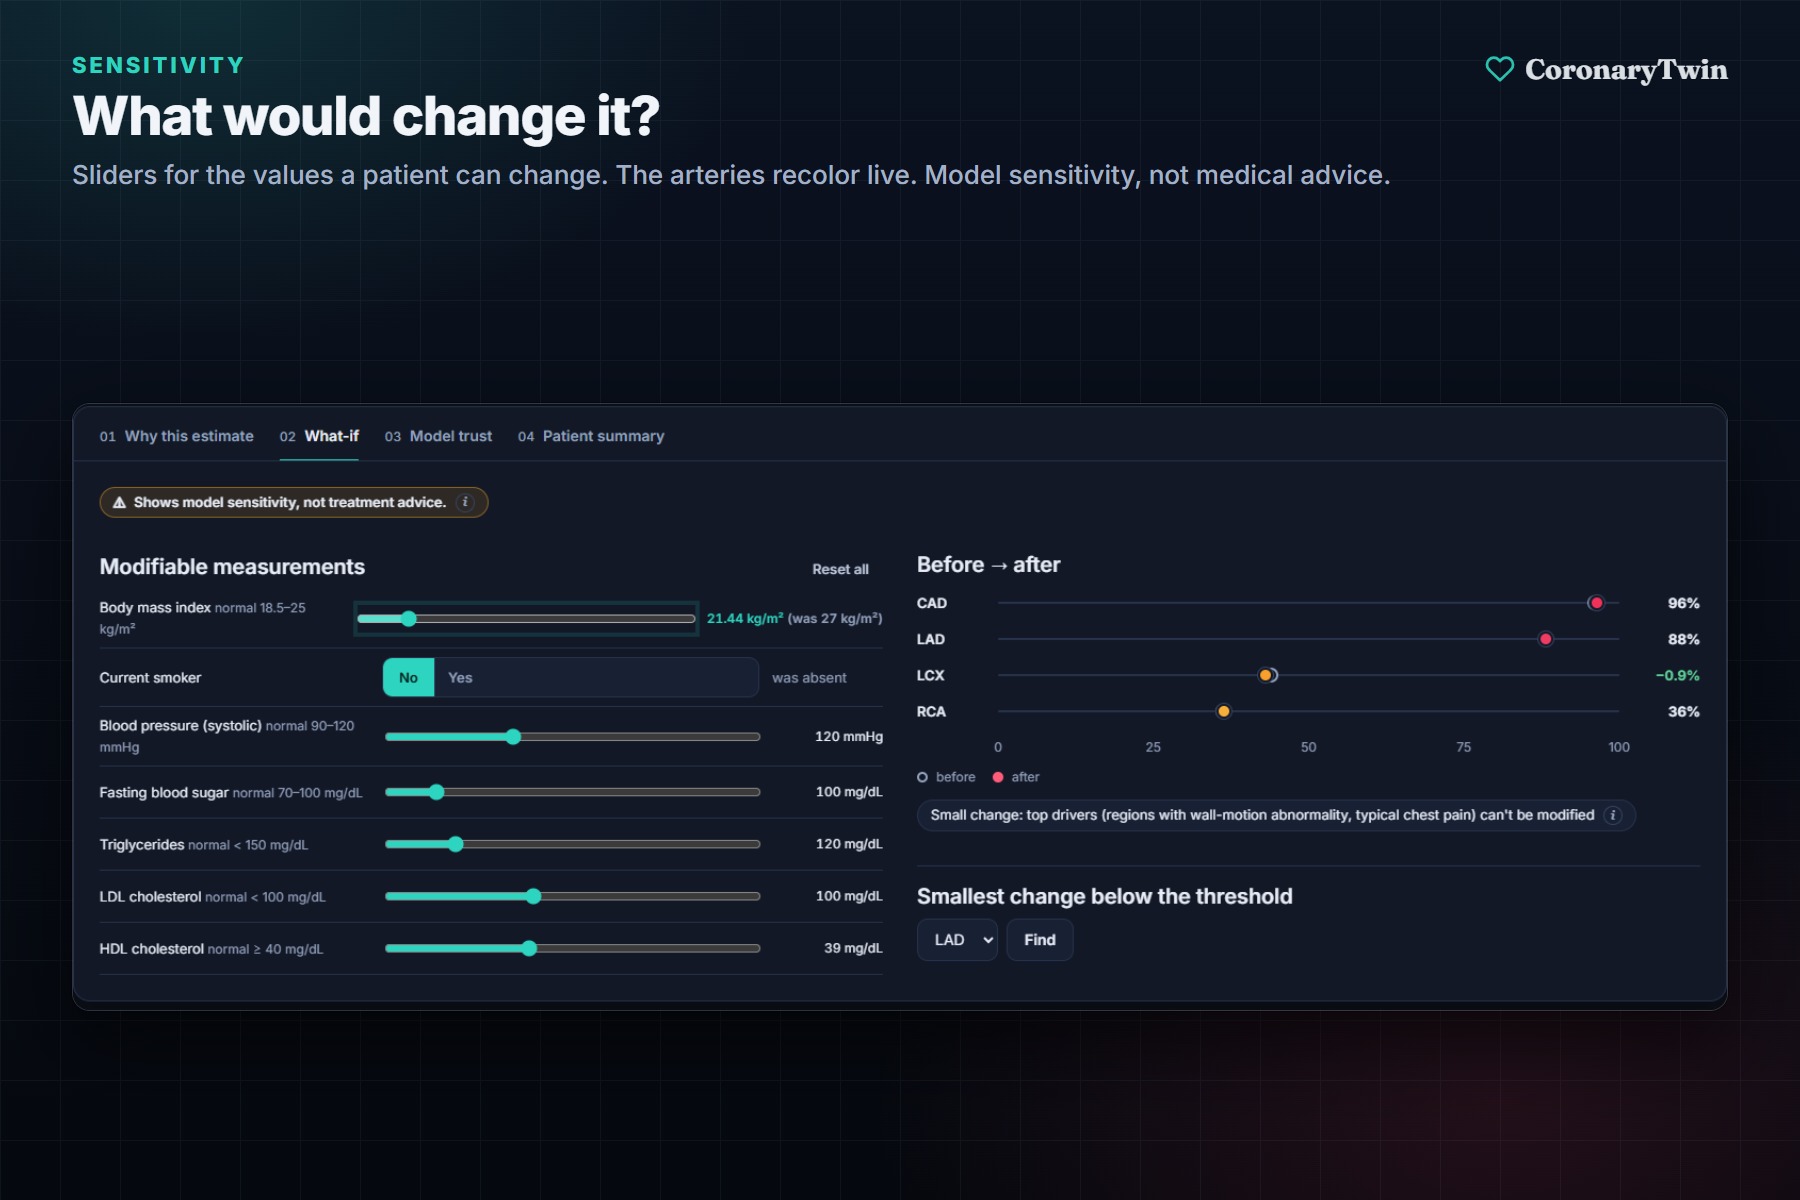
What-if sliders for values a patient can change. The arteries recolor live.
-
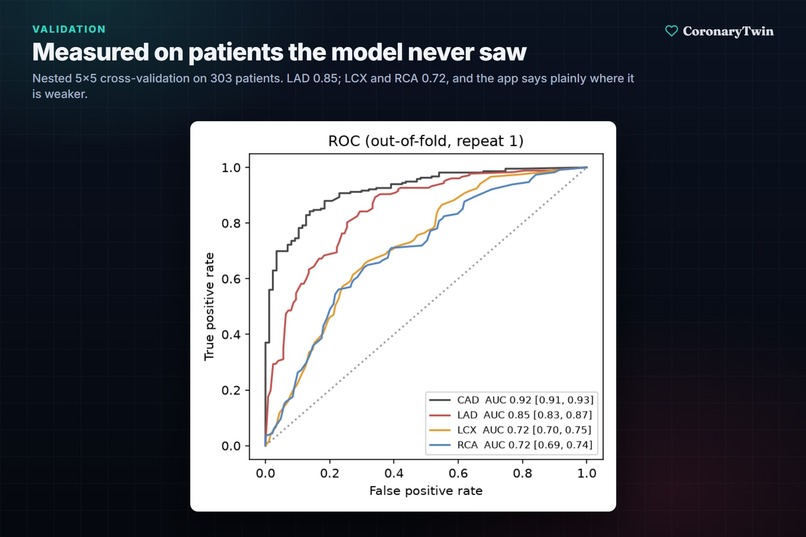
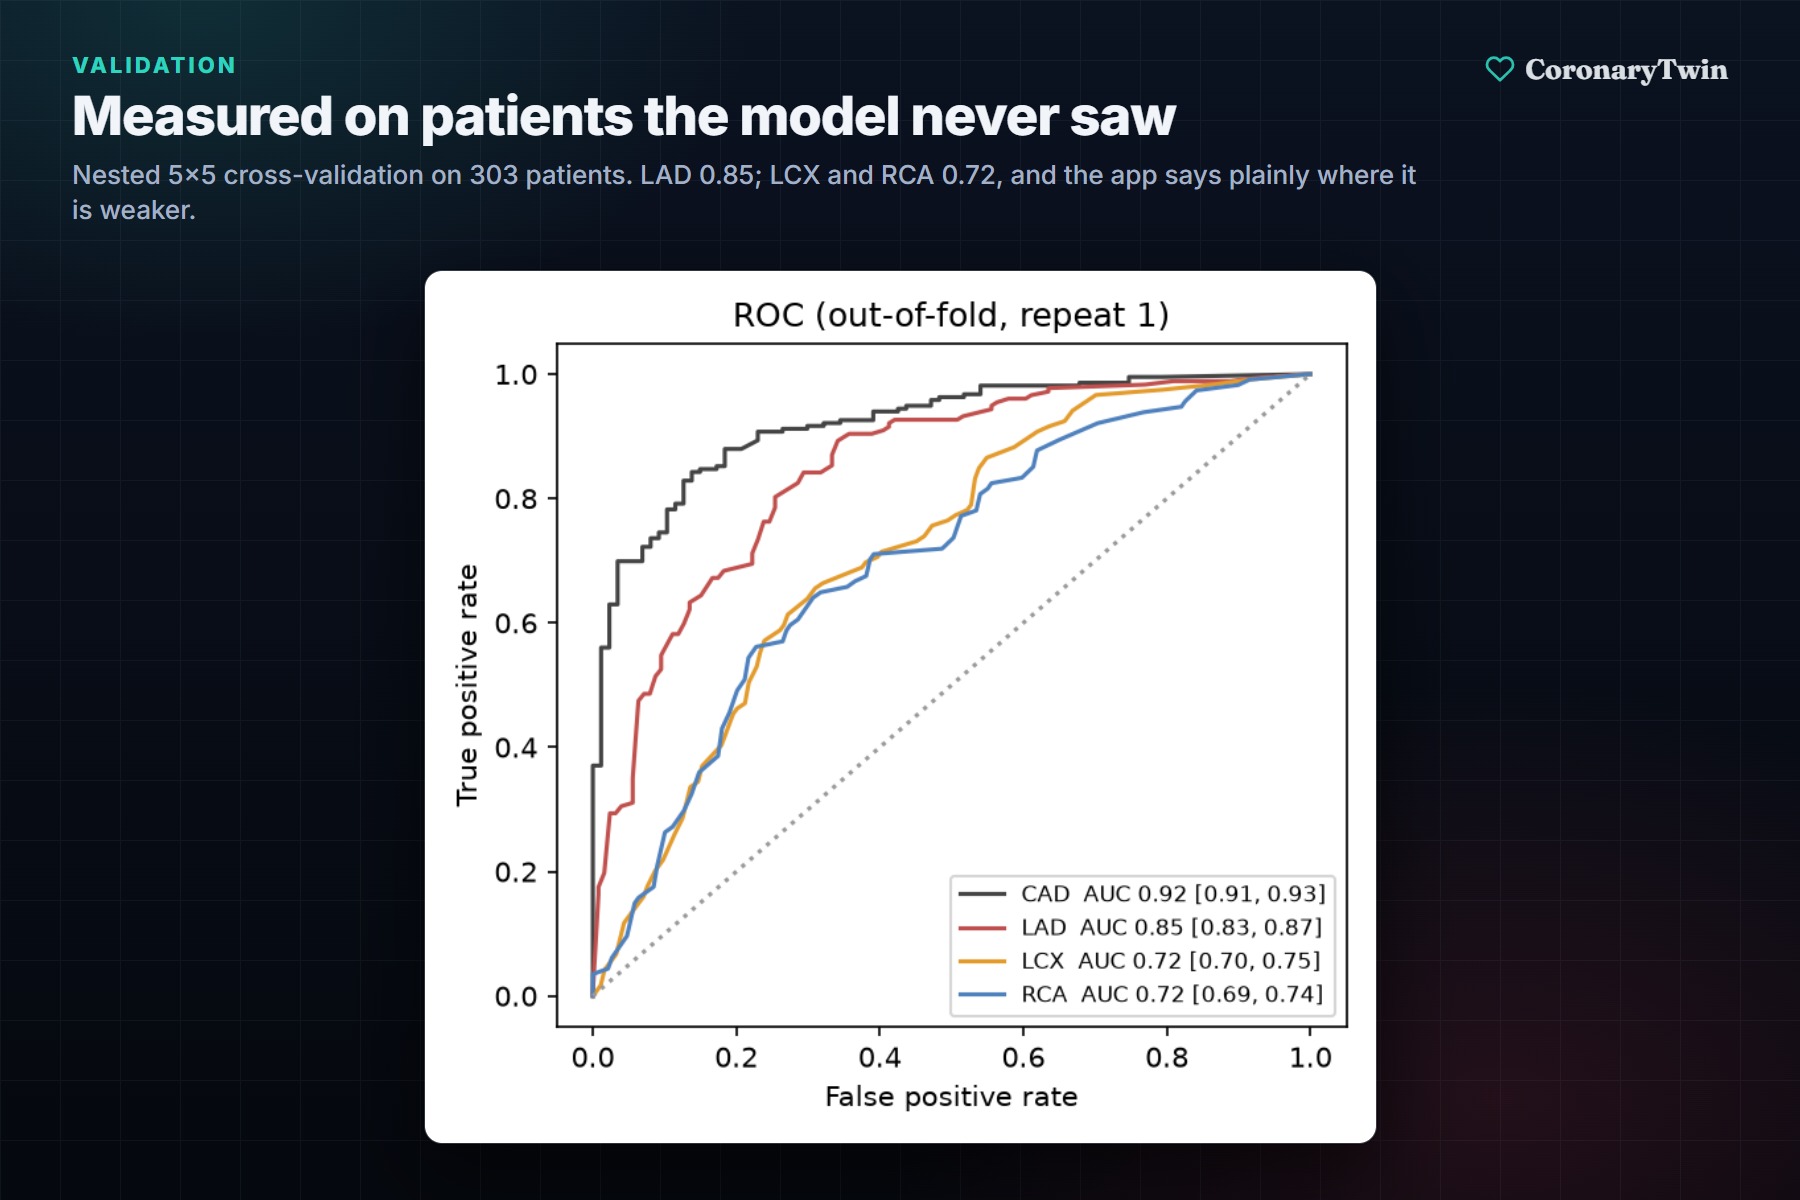
ROC curves from nested 5×5 cross-validation on 303 patients the model never saw during training.
-
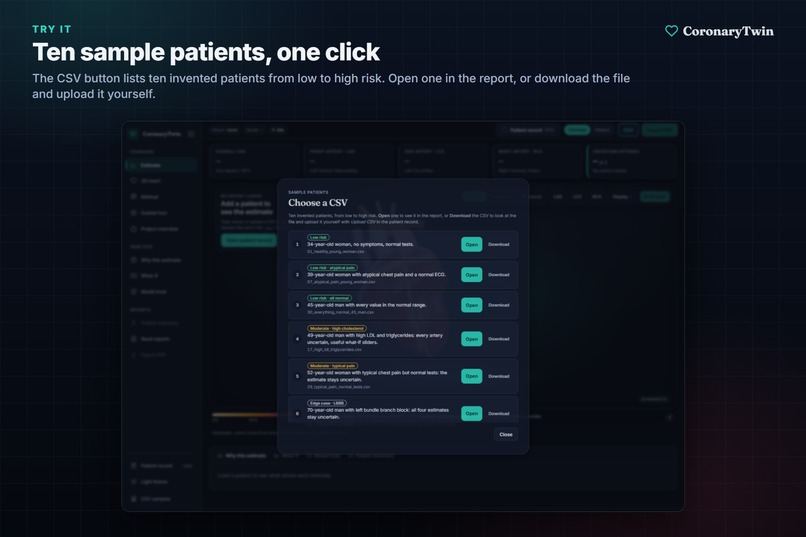
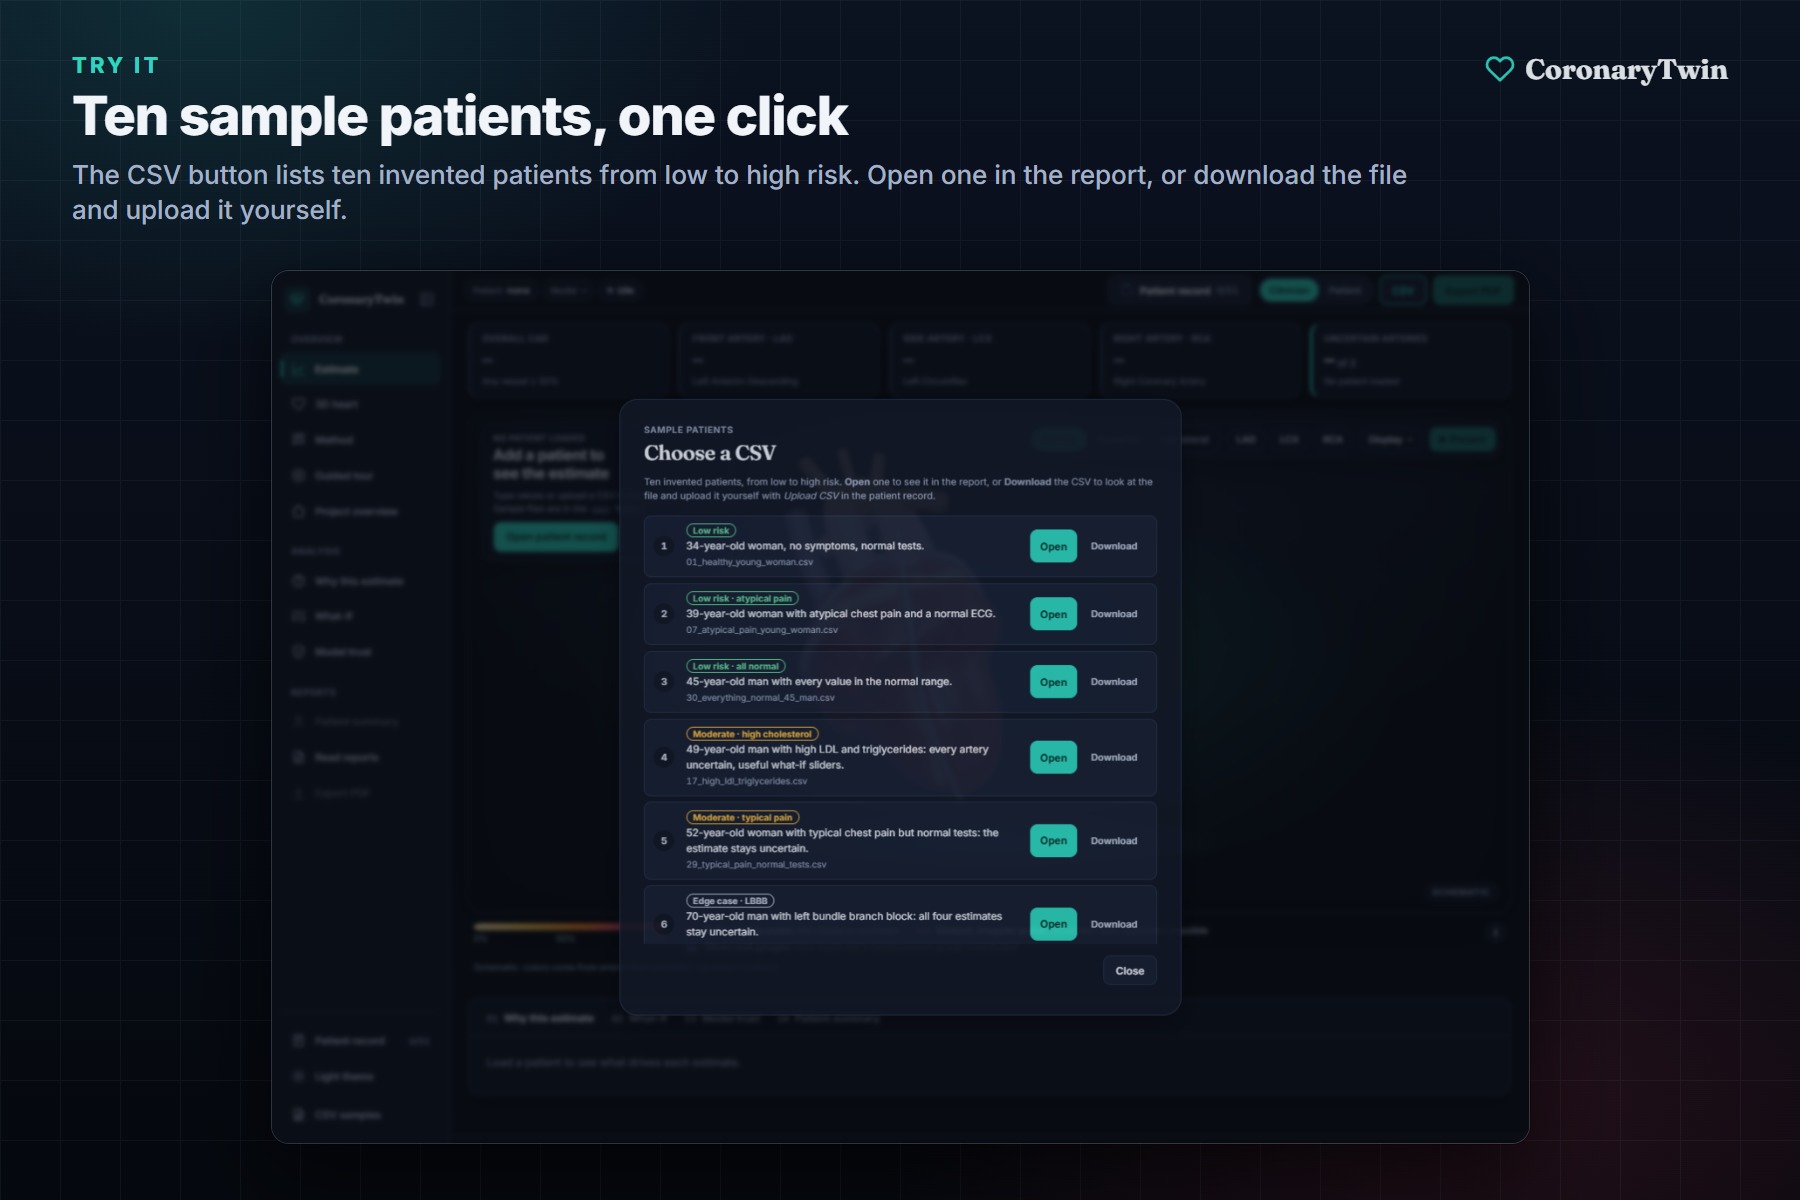
The CSV button opens ten sample patients from low to high risk. Open one in the report or download the file.
-
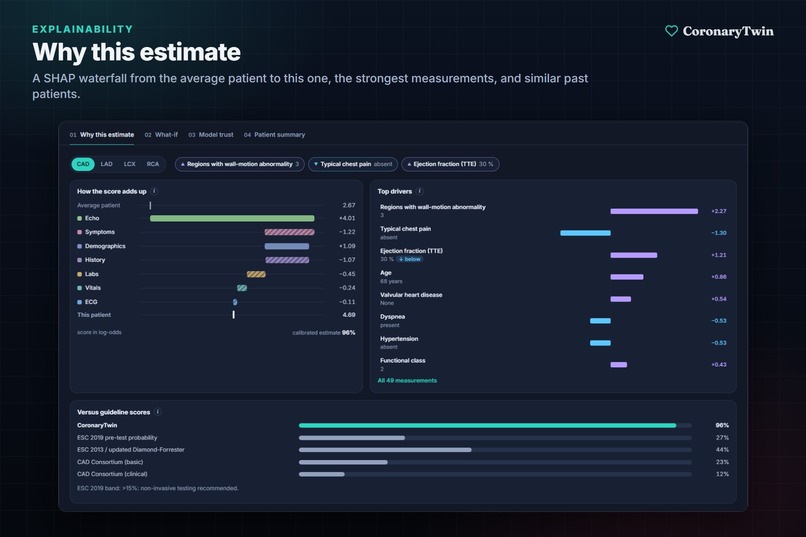
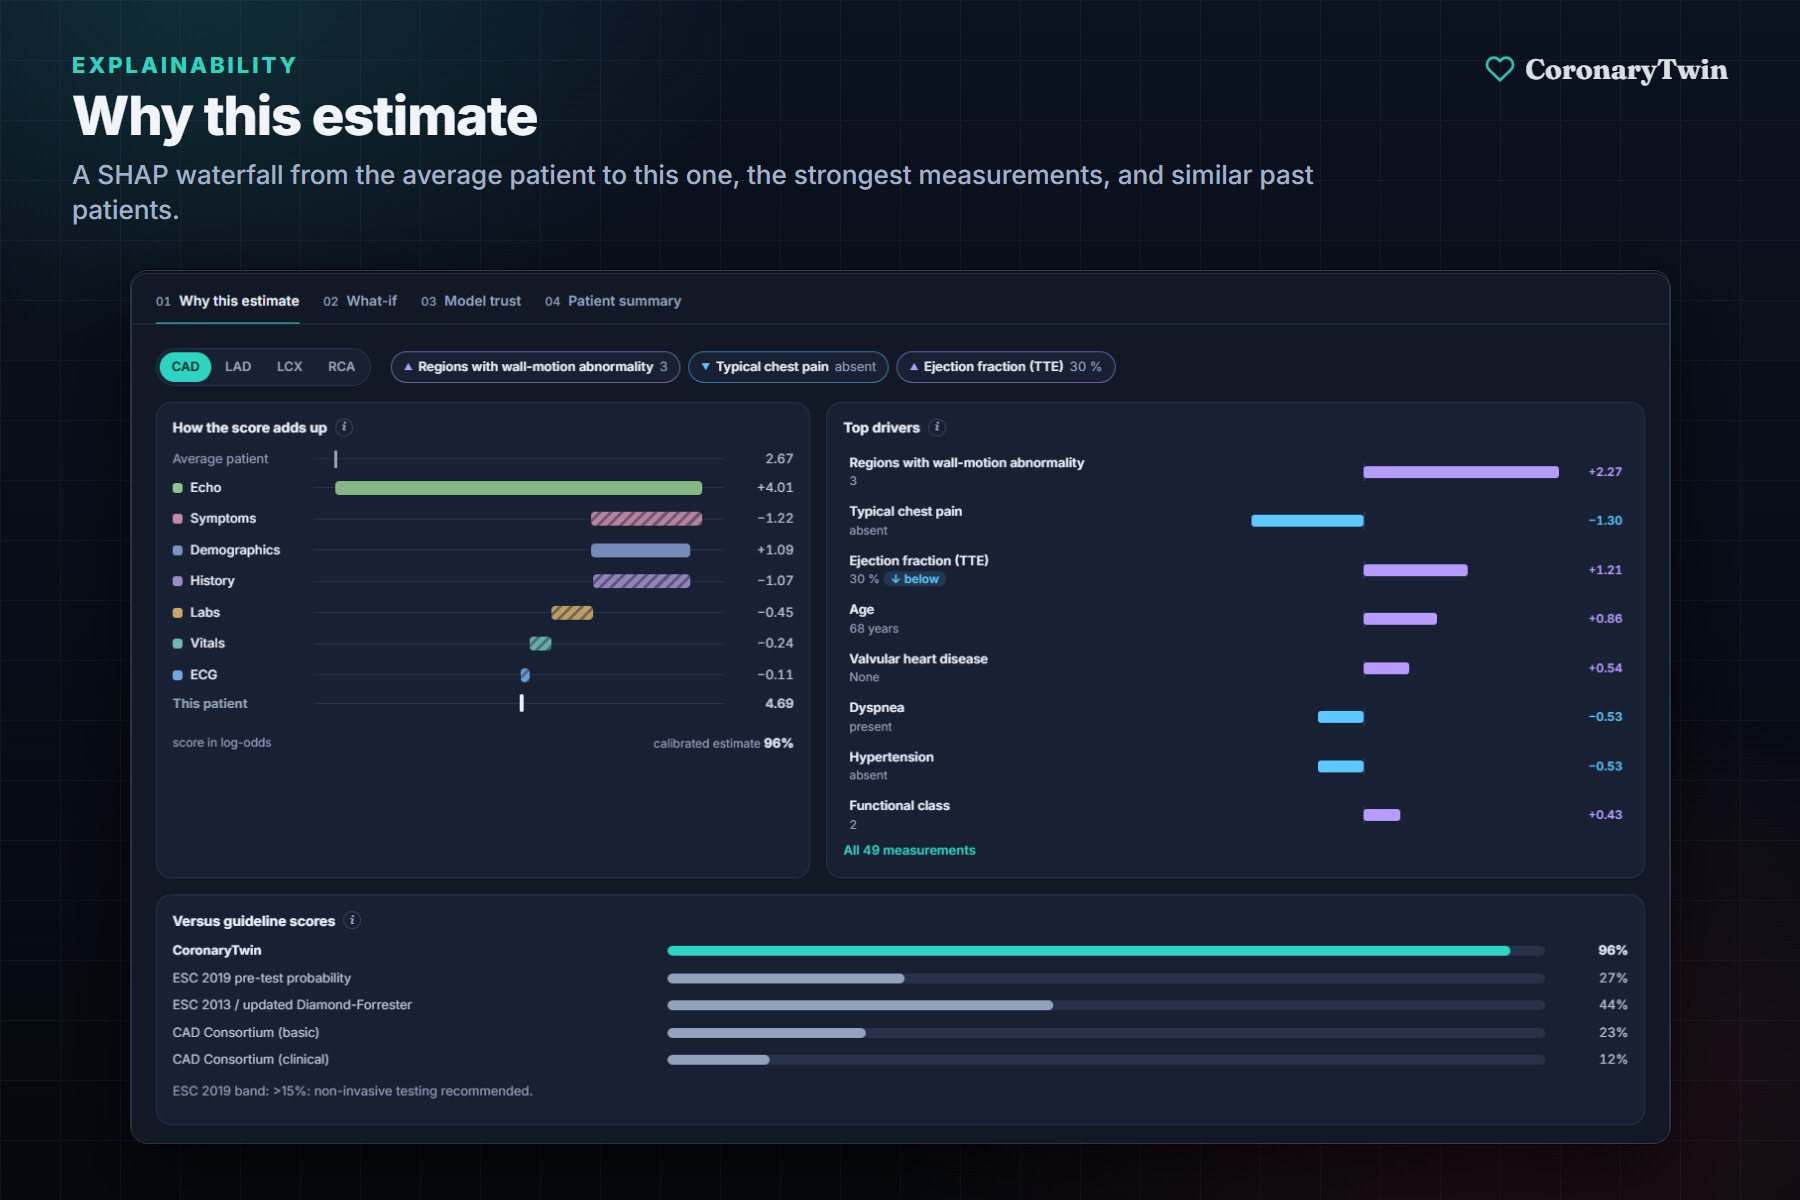
Why this estimate: a SHAP waterfall from the average patient to this one, plus similar past patients.
-
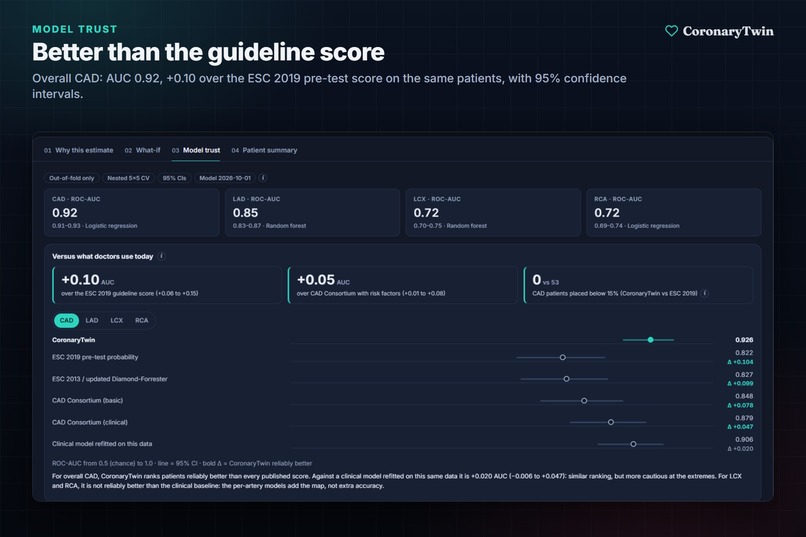
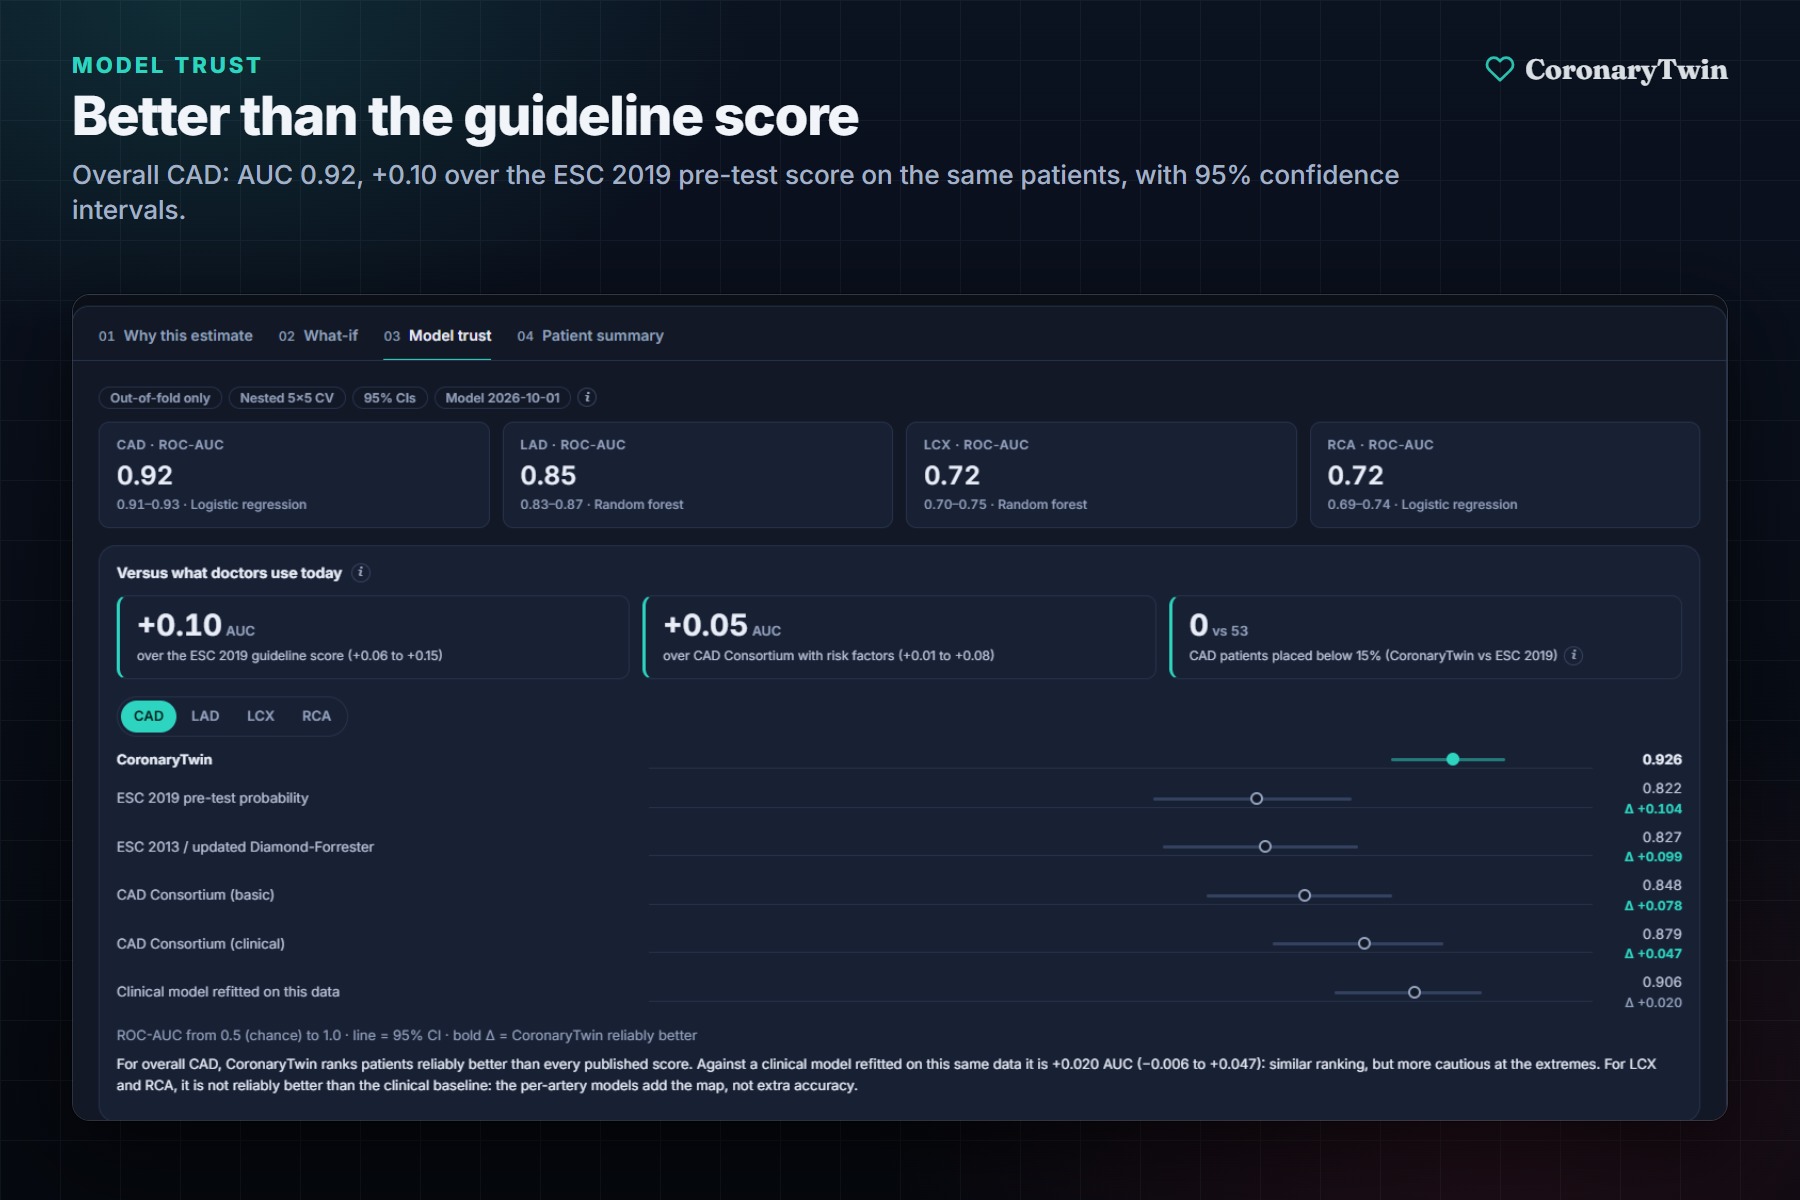
Overall CAD reaches AUC 0.92, which is +0.10 better than the ESC 2019 guideline score on the same patients.
-
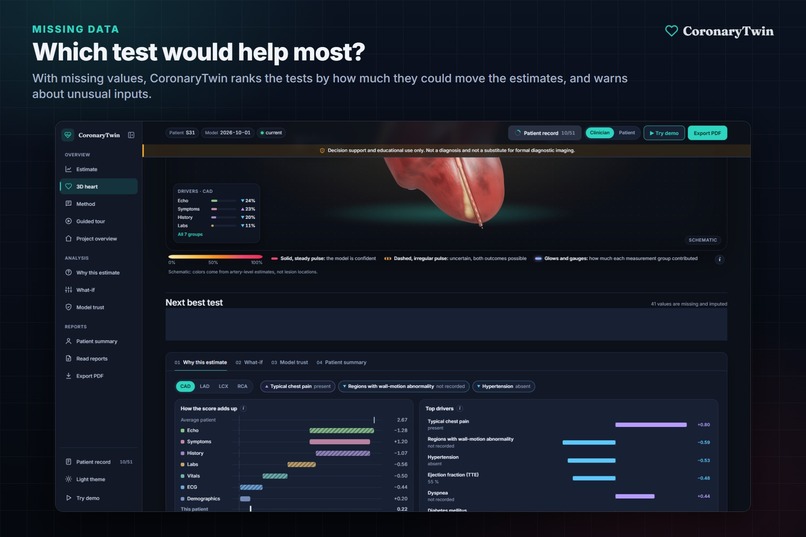
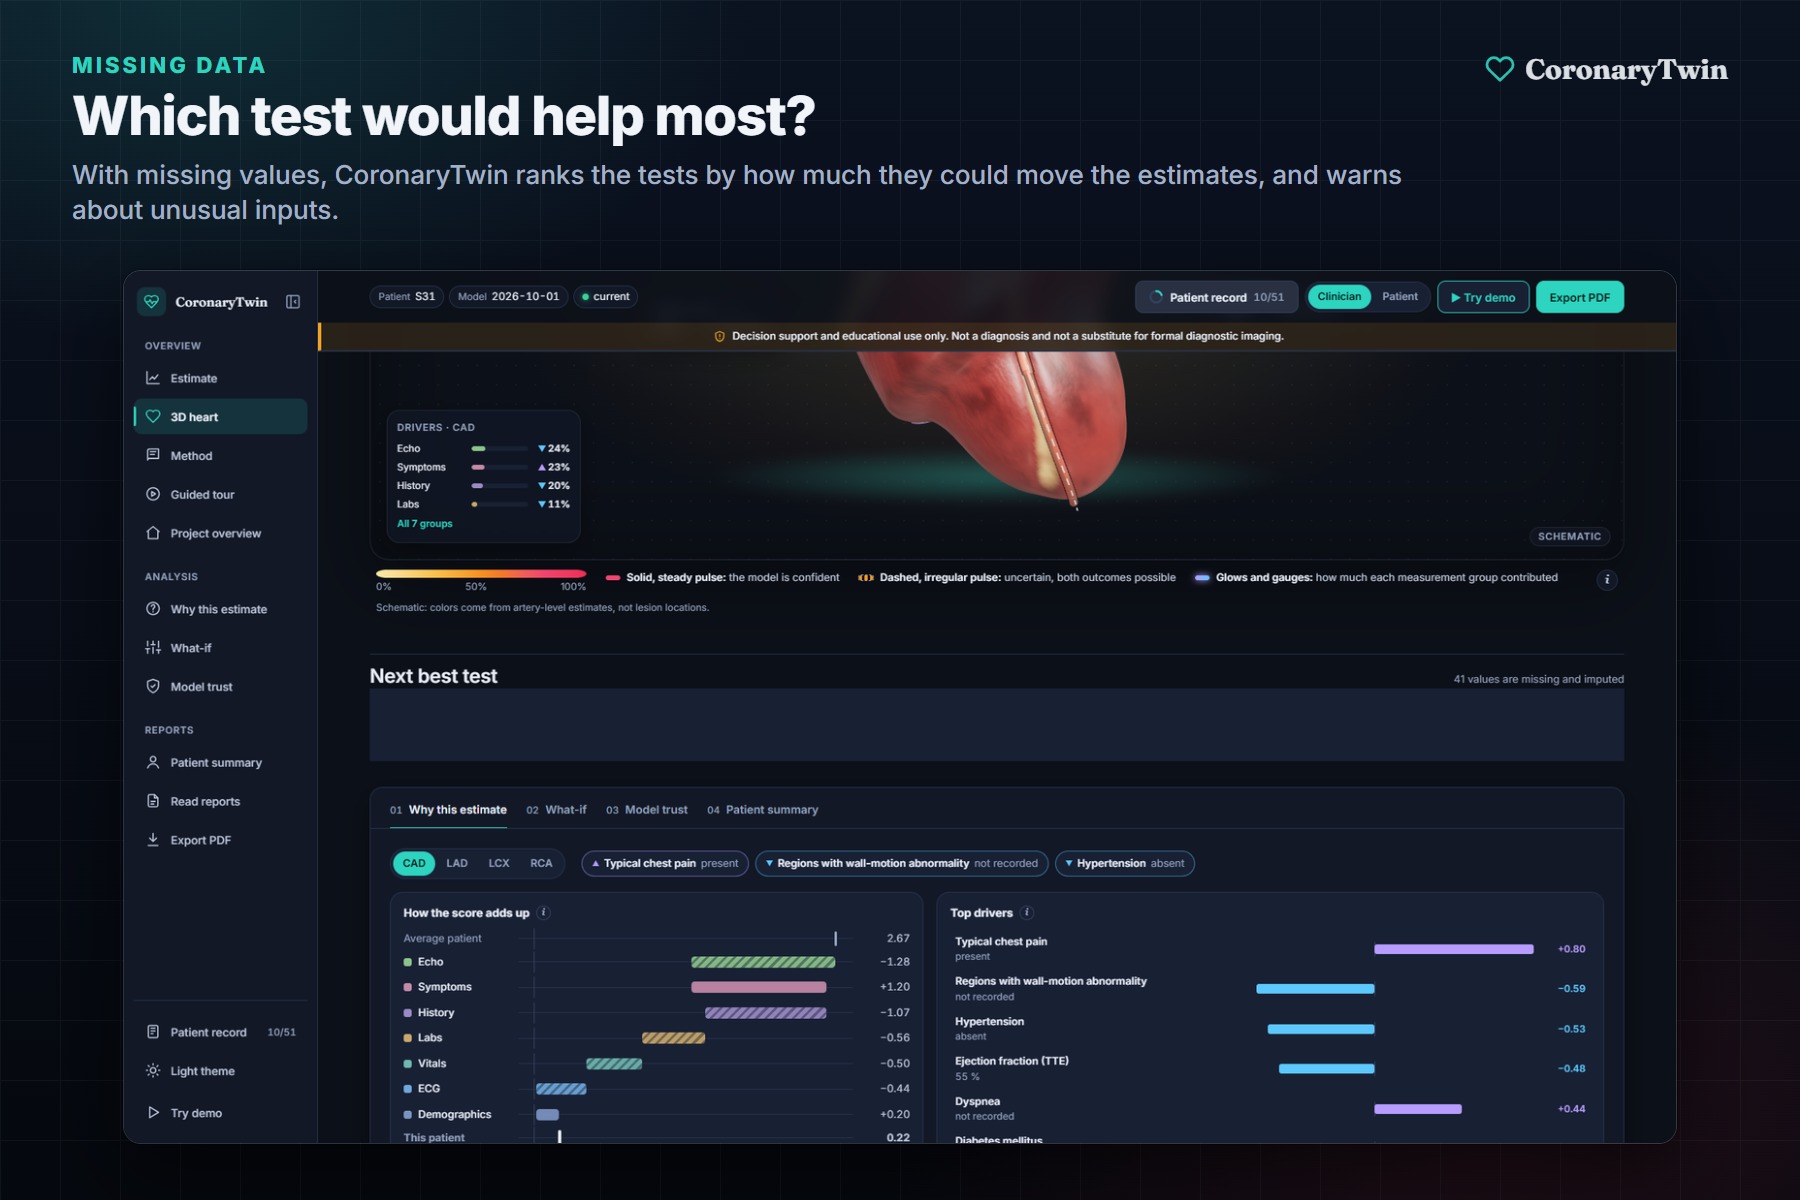
With missing data, it ranks which test would change the estimates most.
-
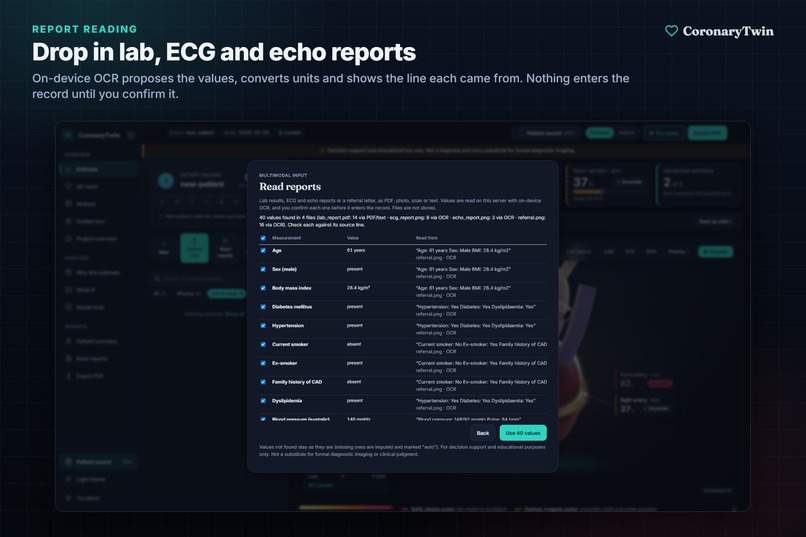
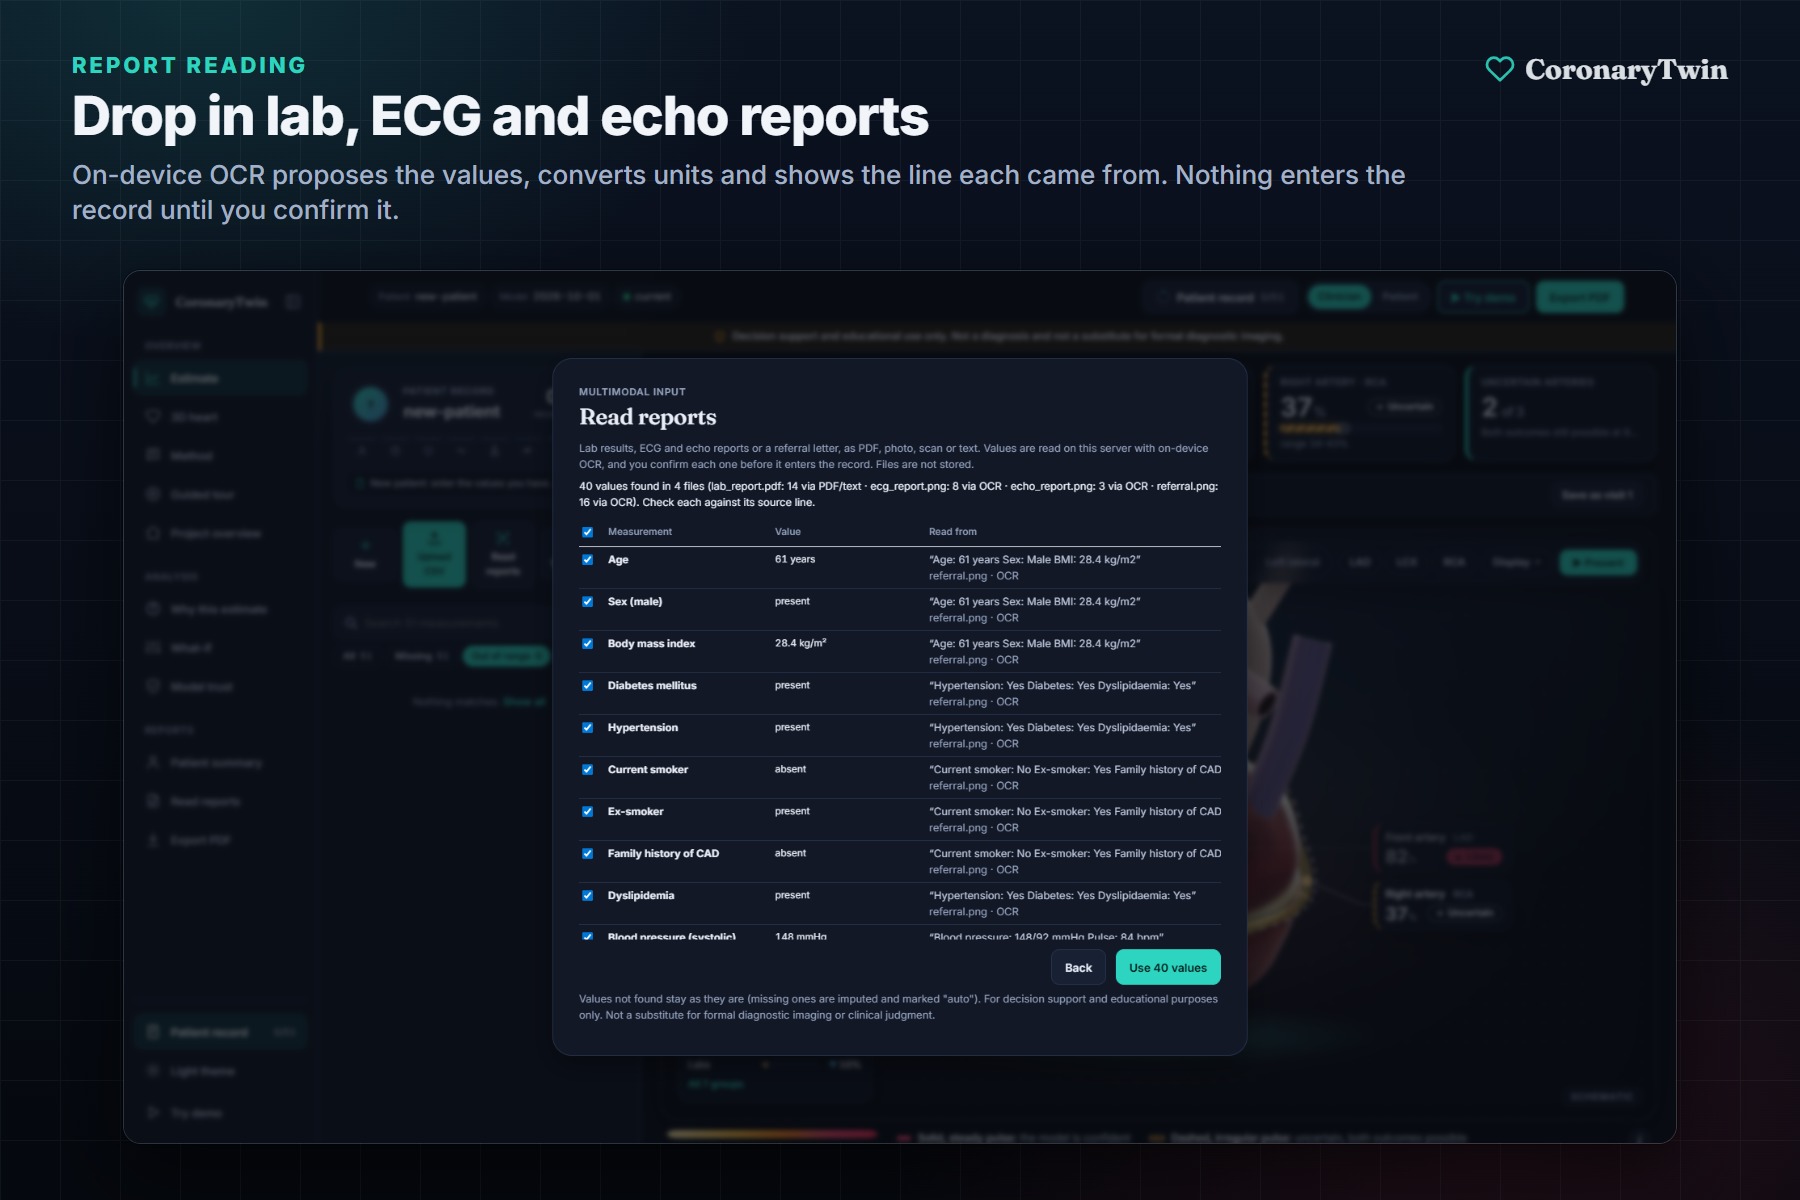
Drop in lab, ECG and echo reports. On-device OCR reads the values and shows the line each one came from.
-
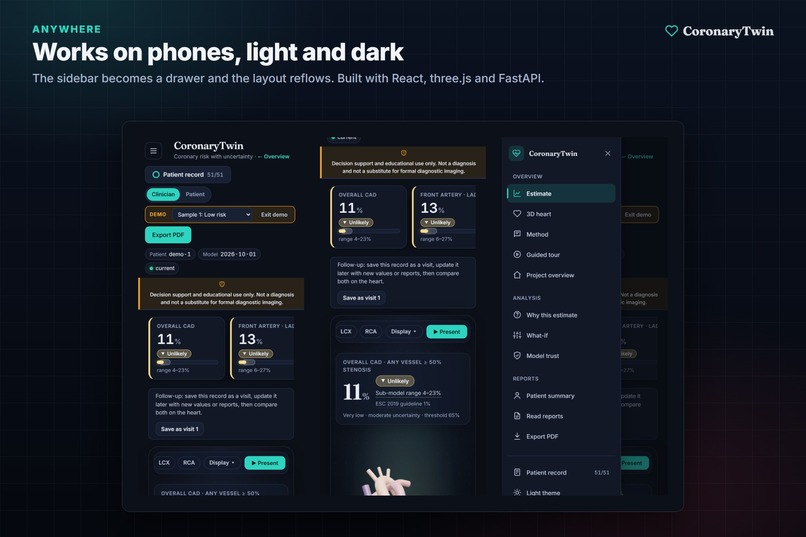
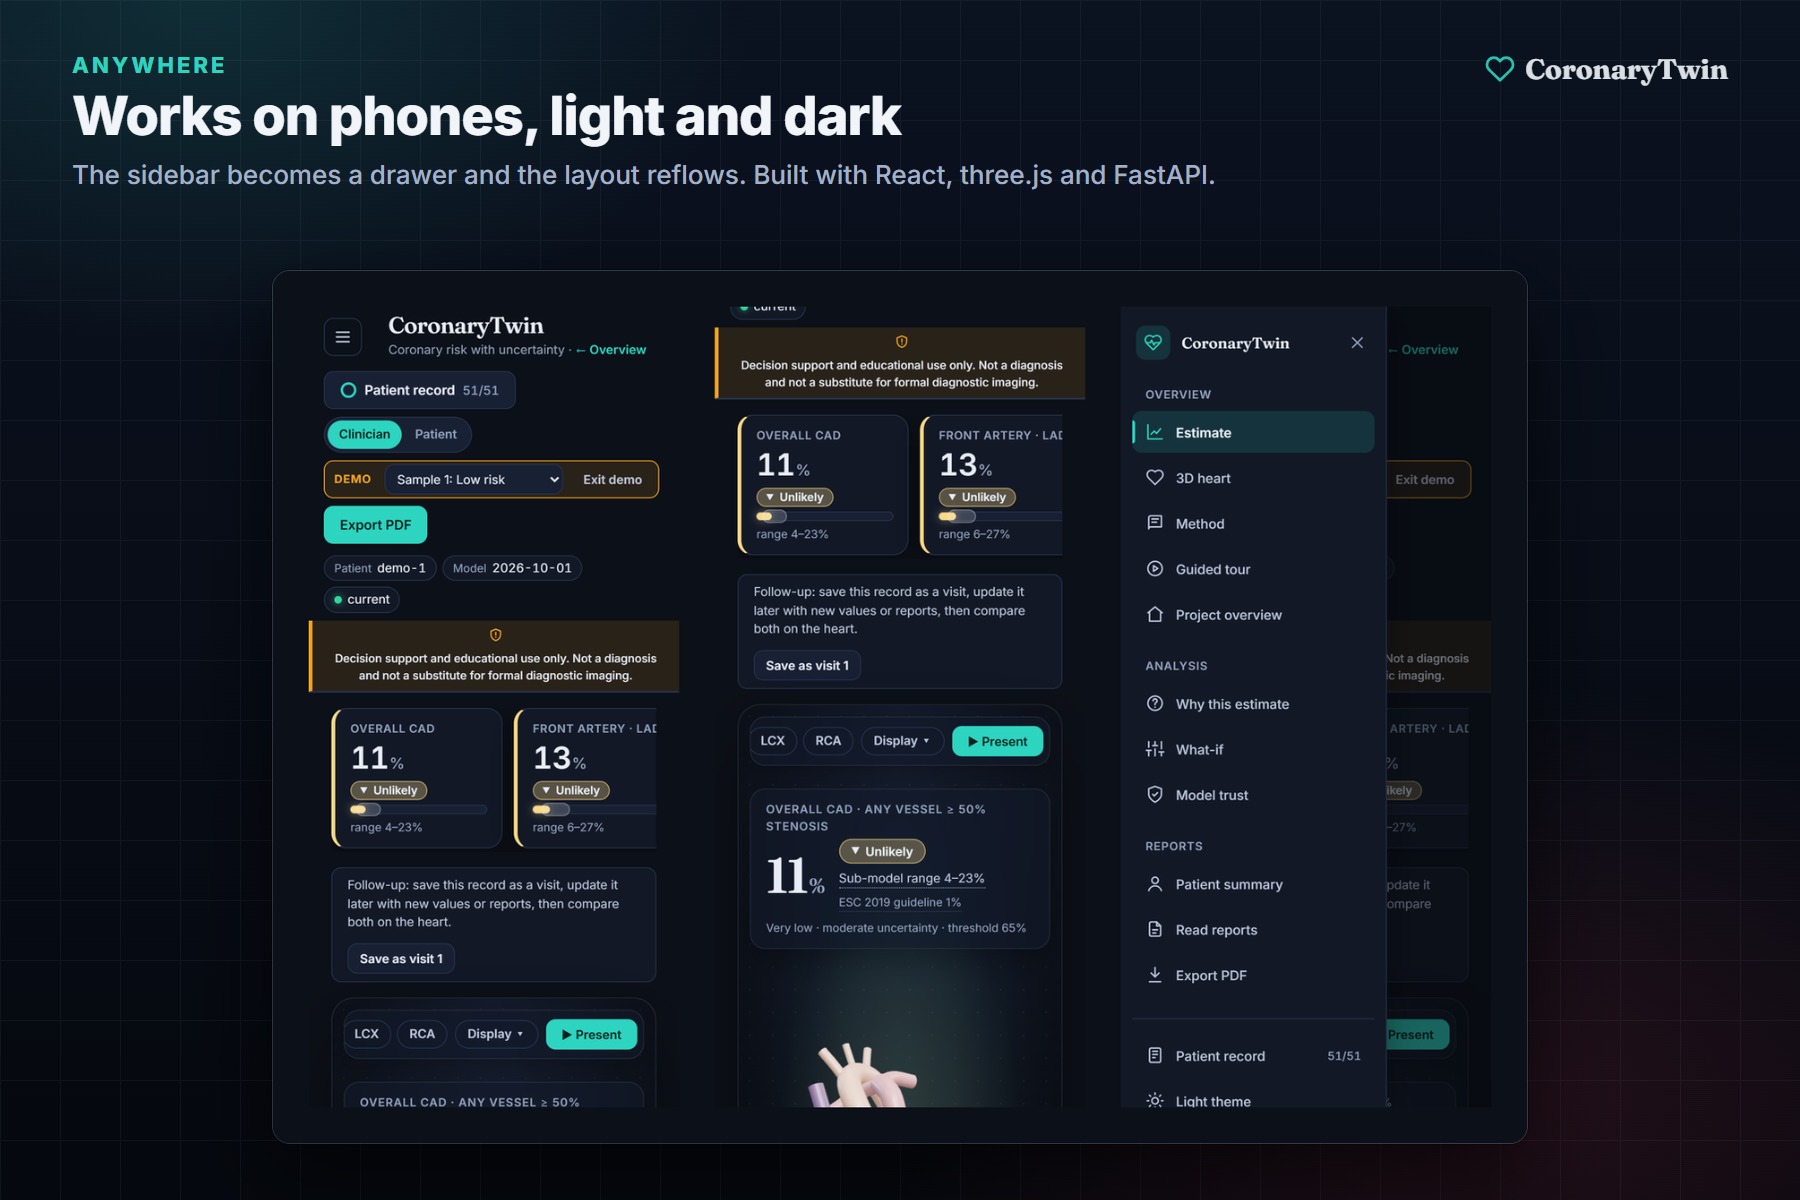
Works on phones, in light and dark themes.
-
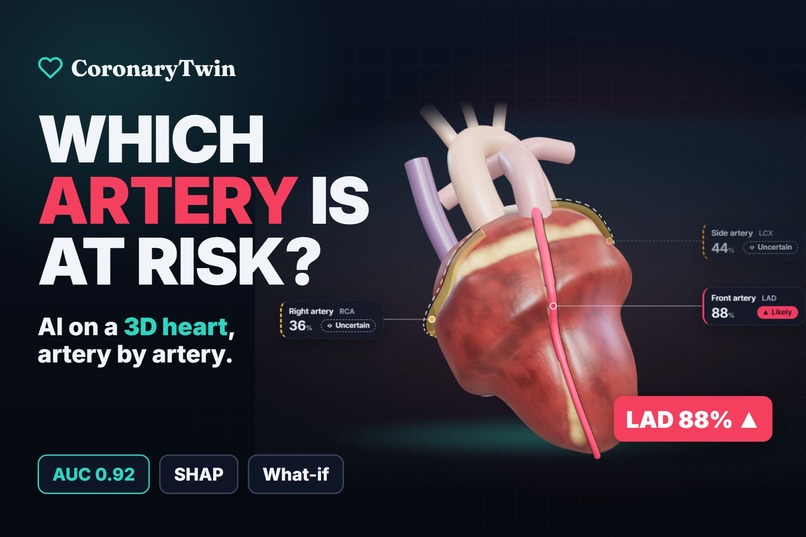
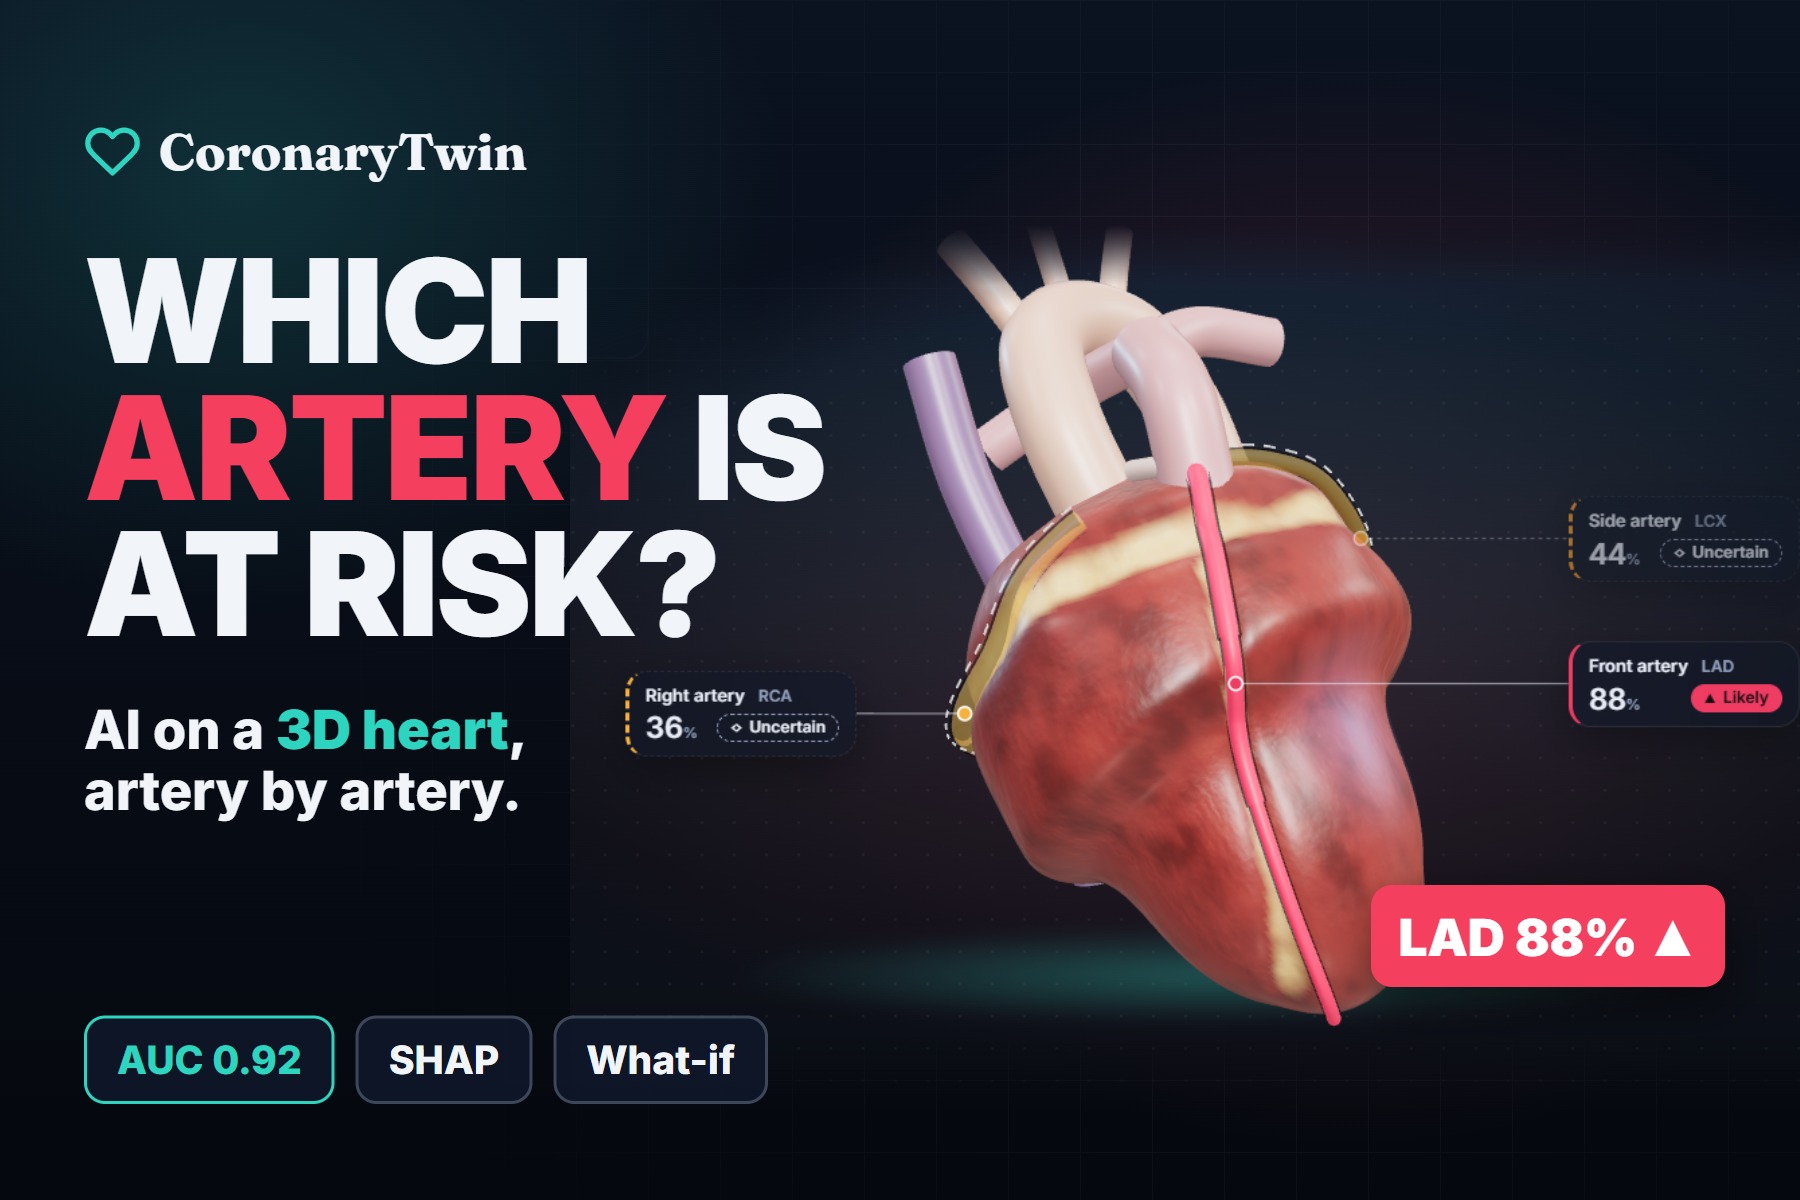
CoronaryTwin: AI risk prediction on a 3D heart, artery by artery.
-
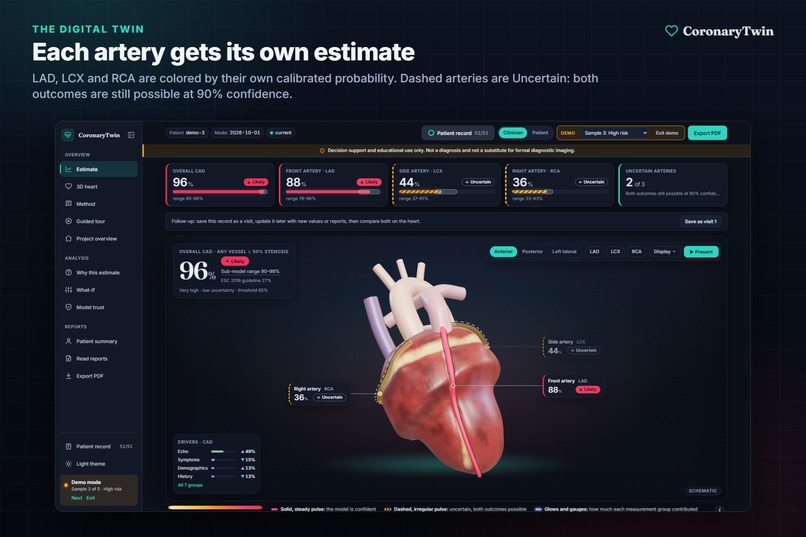
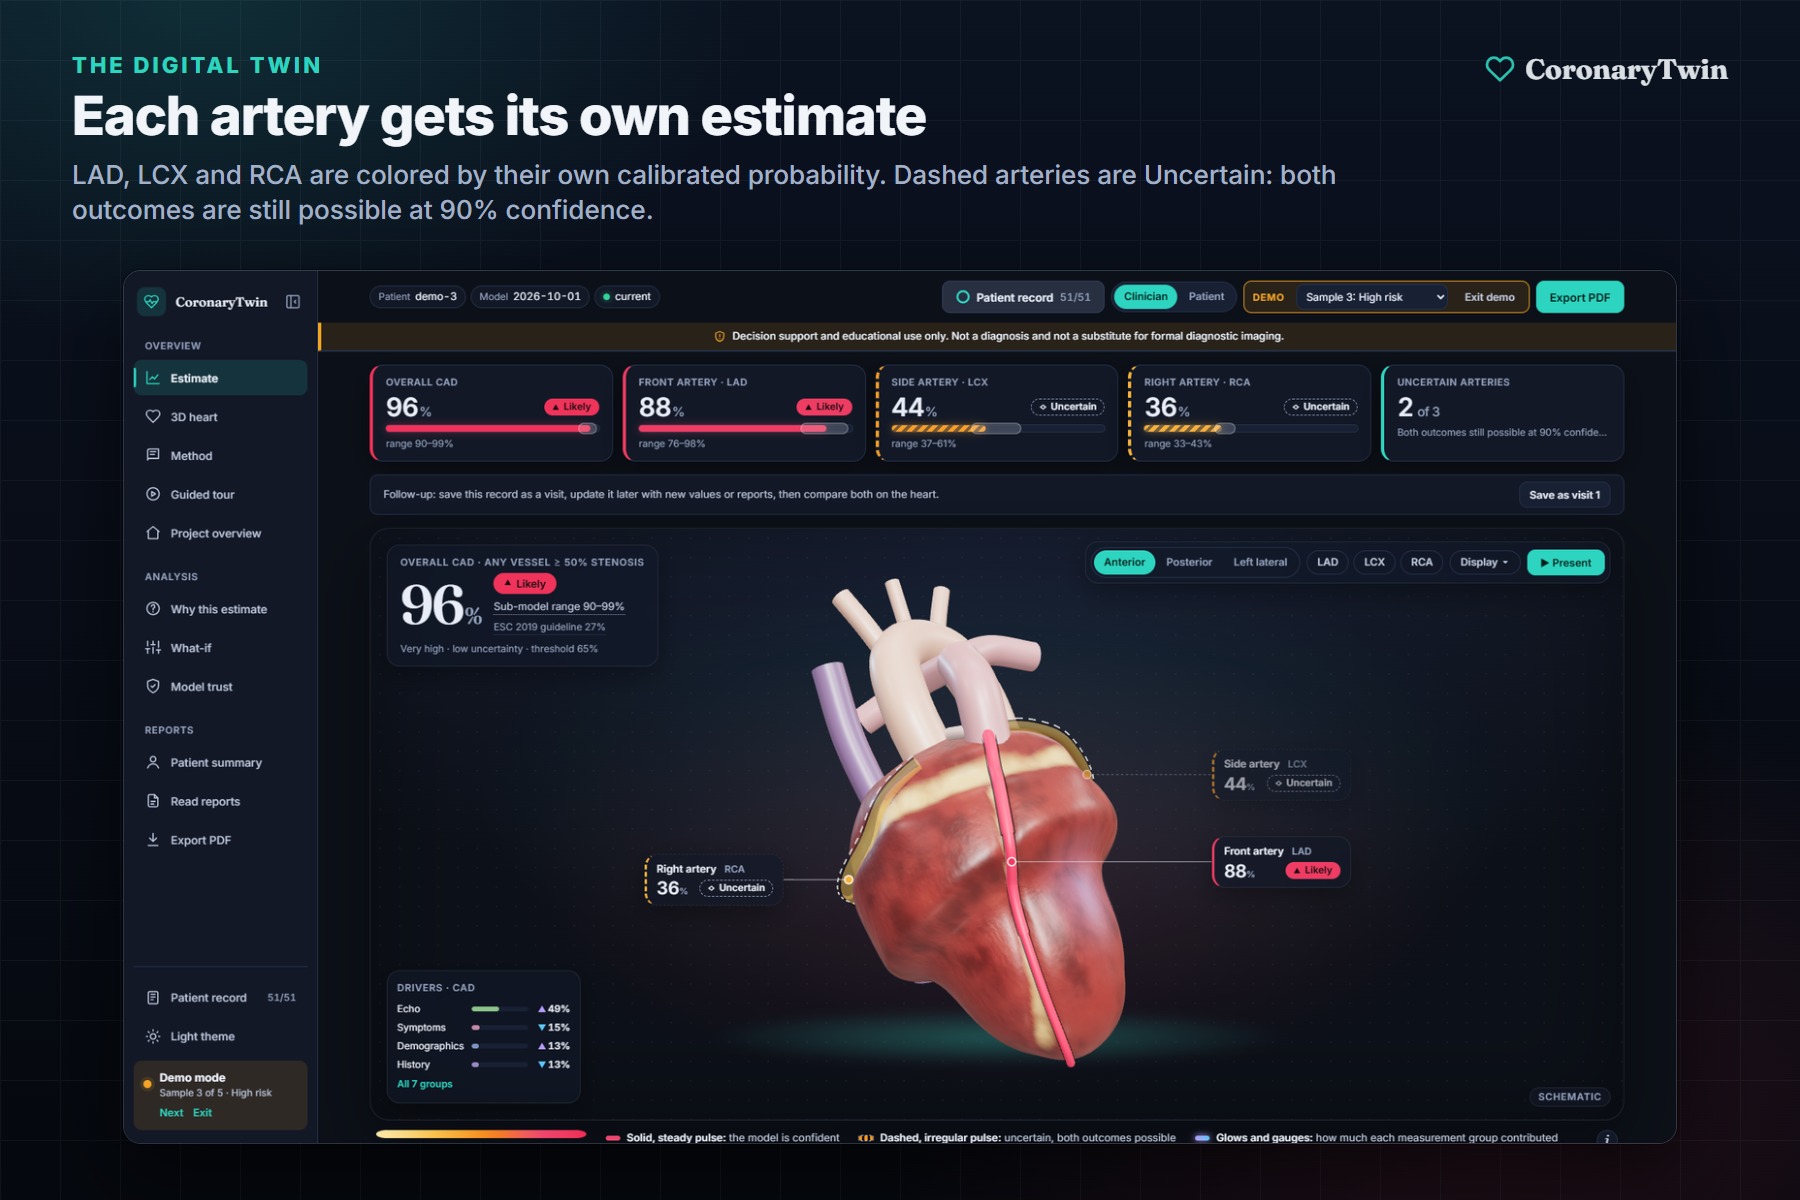
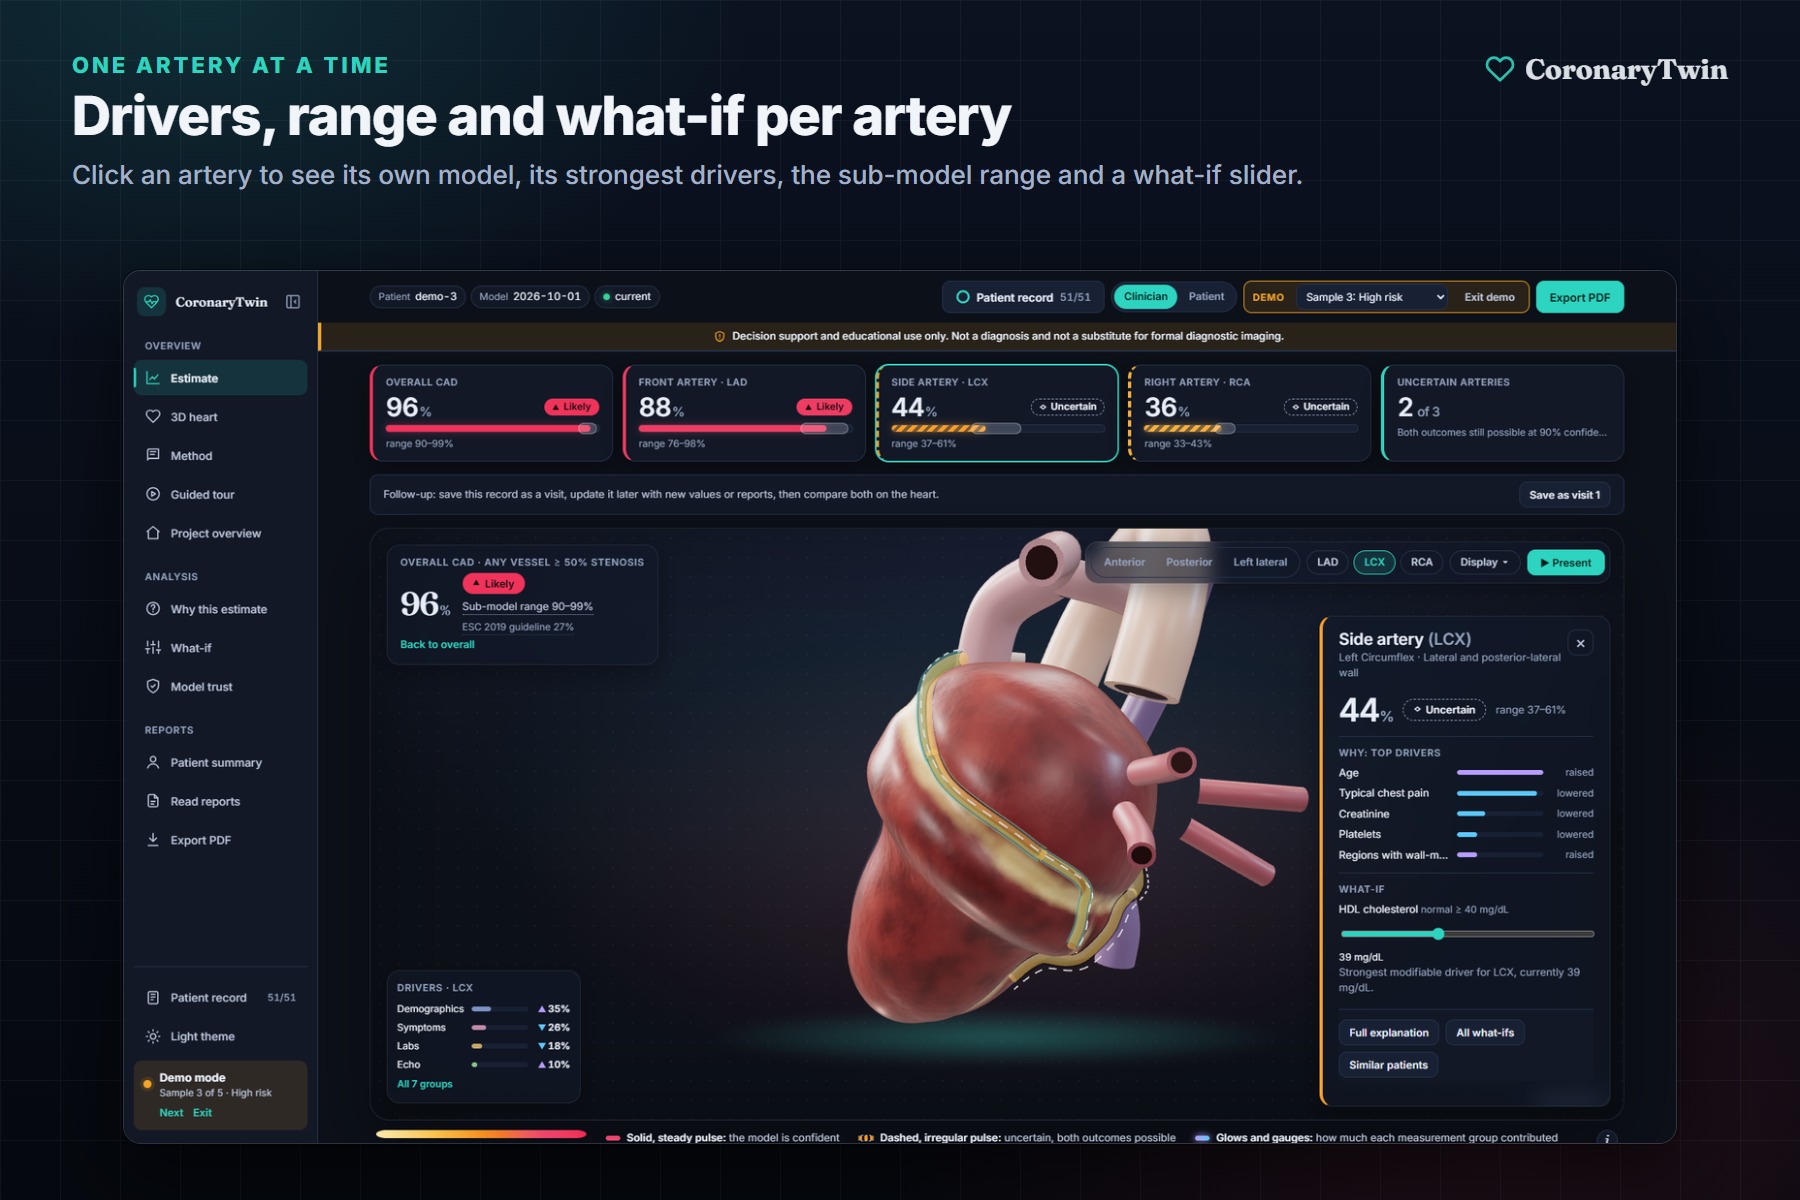
Each artery gets its own calibrated estimate. Dashed arteries are Uncertain, meaning both outcomes are still possible at 90% confidence.
-
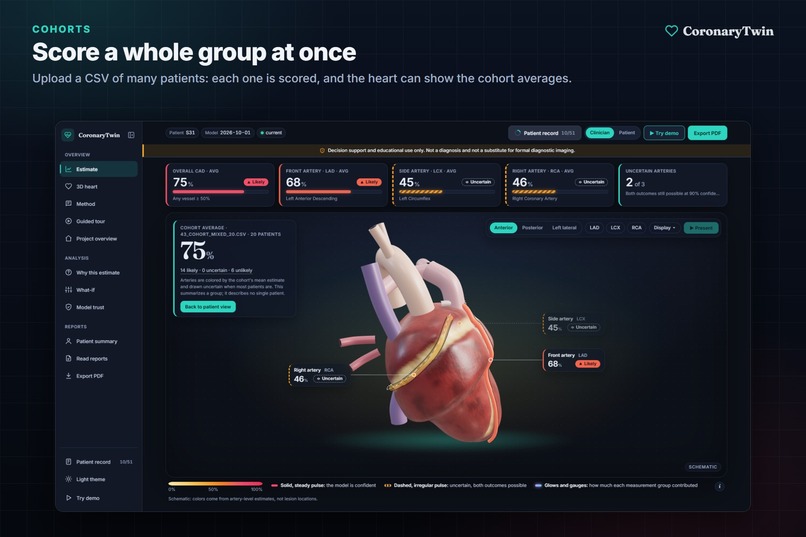
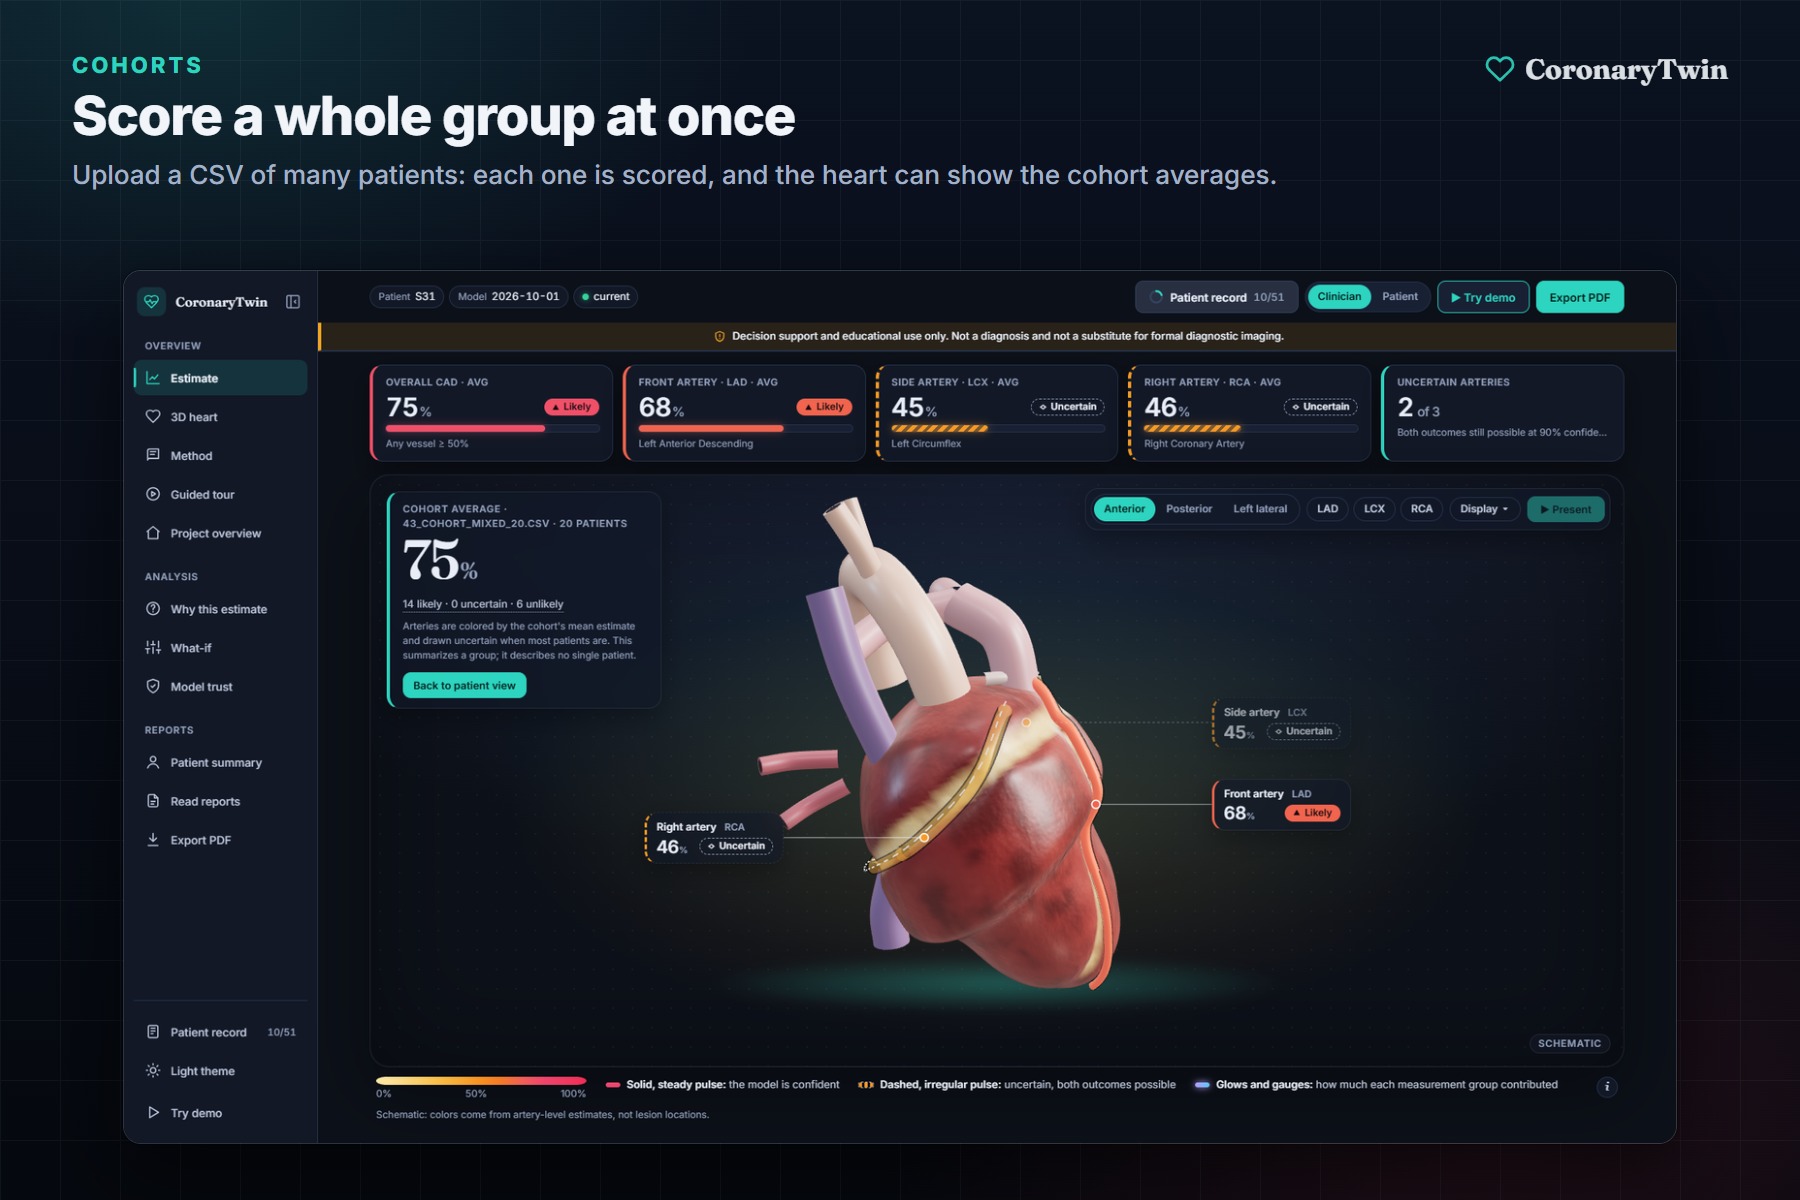
Upload a CSV of many patients to score them all and see the group average on the heart.
-
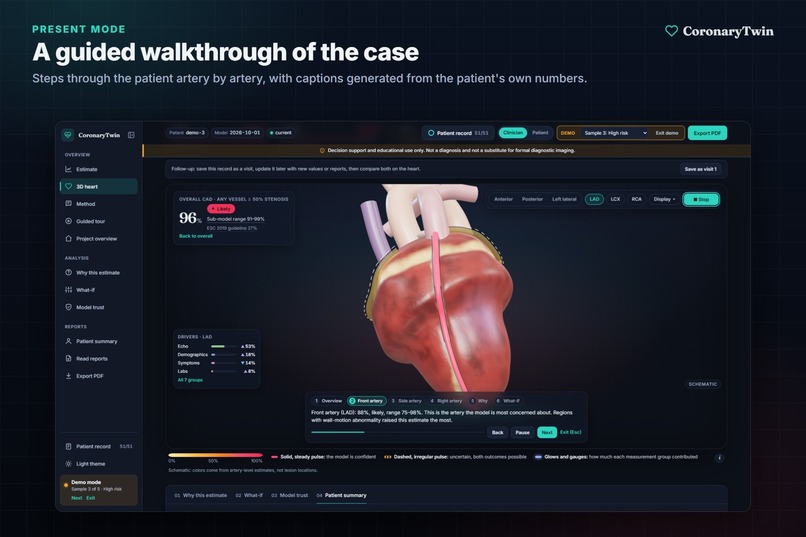
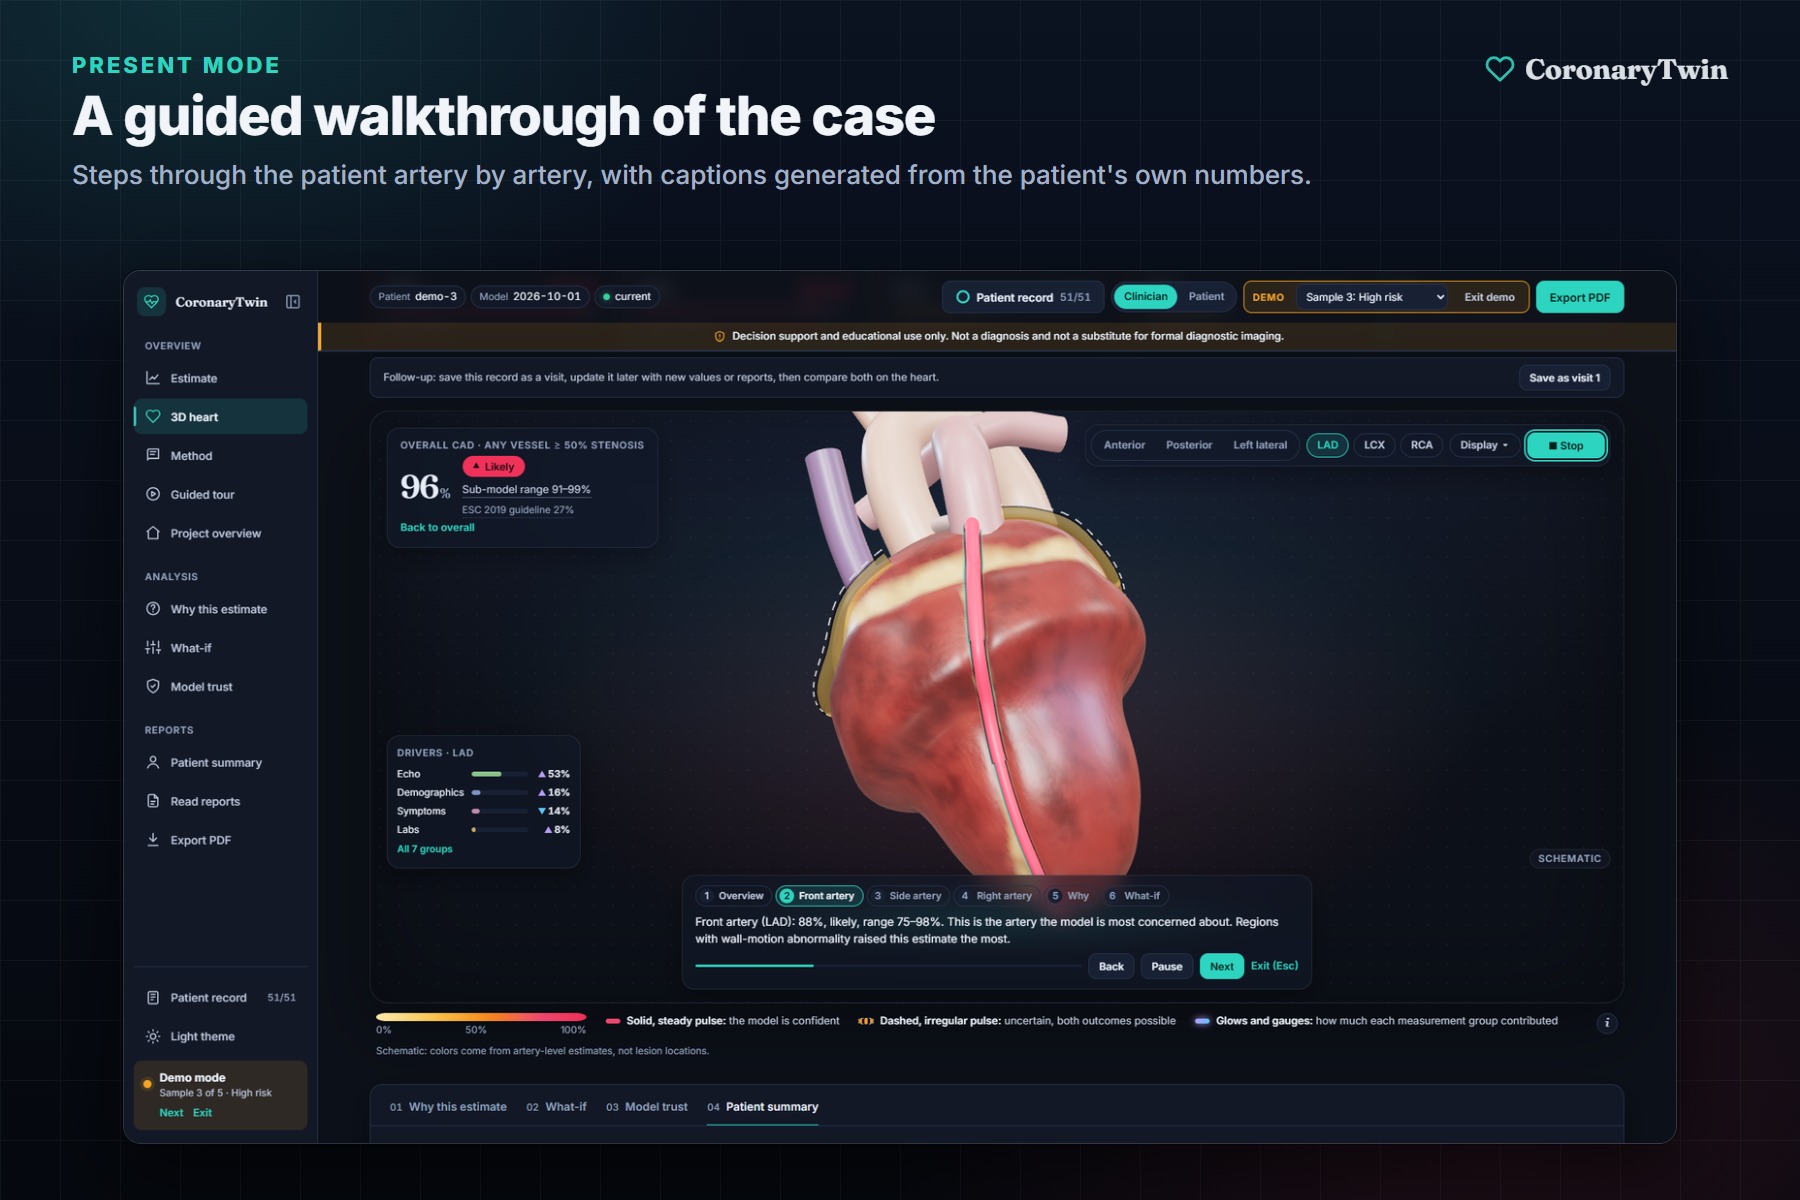
Present mode walks through the case artery by artery, with captions generated from the patient's own numbers.
-
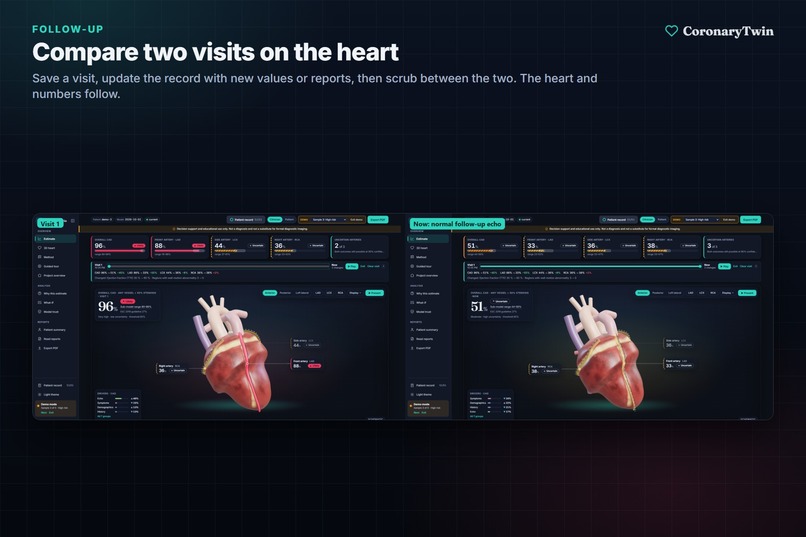
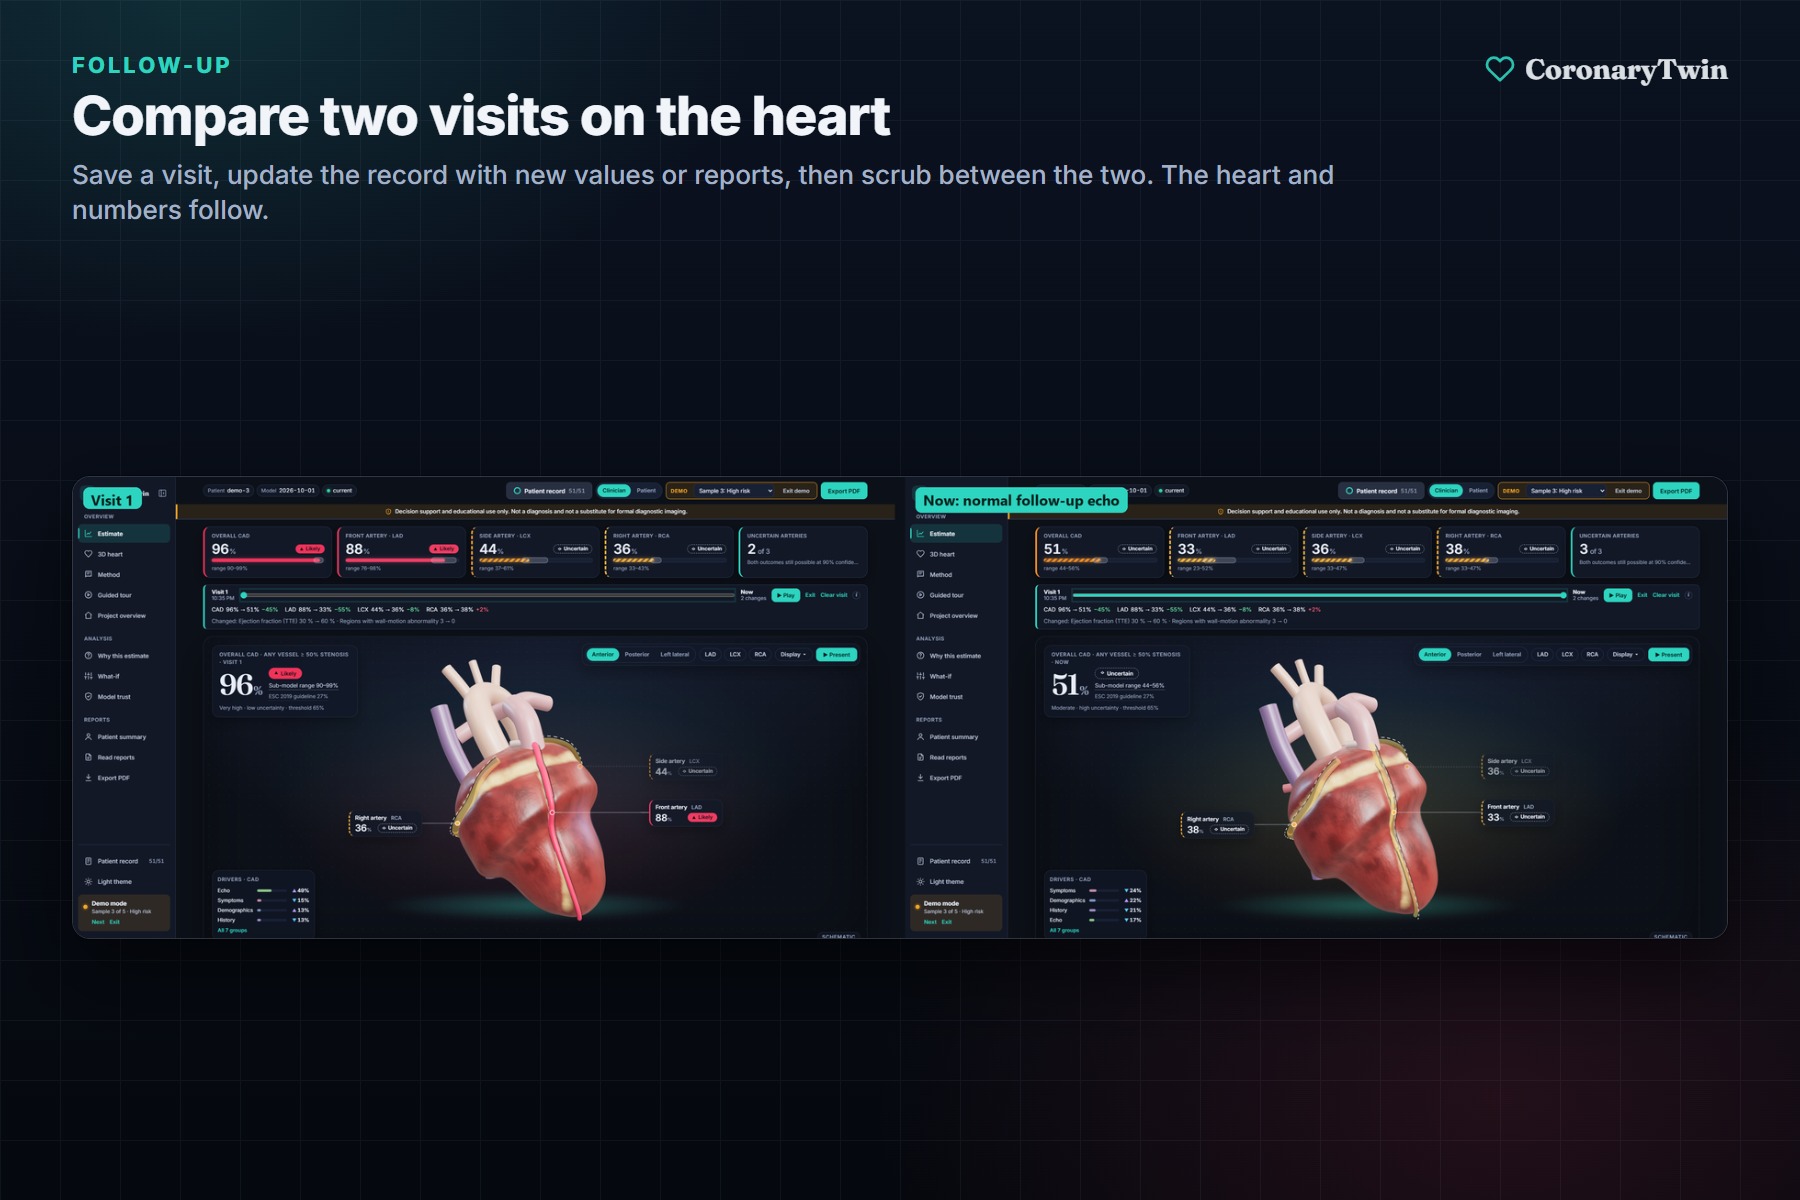
Save a visit, add new results, and compare both visits on the heart.
-
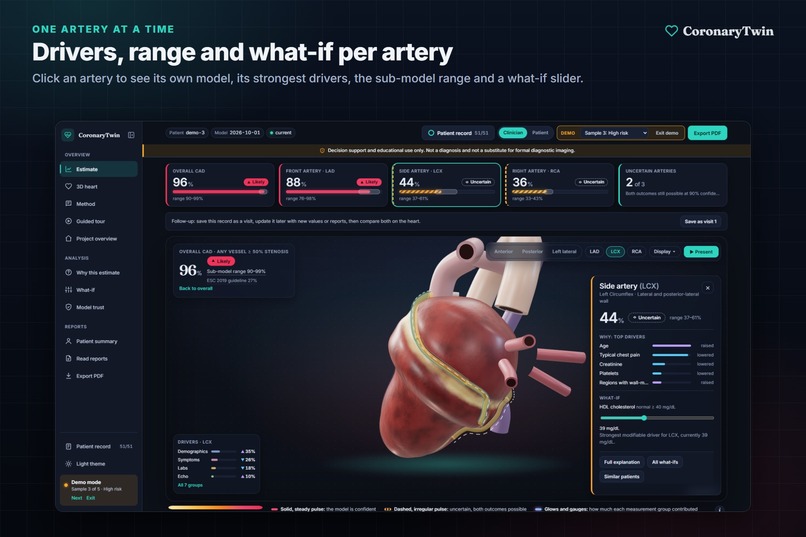
Click an artery to see its own drivers, sub-model range and a what-if slider.
-
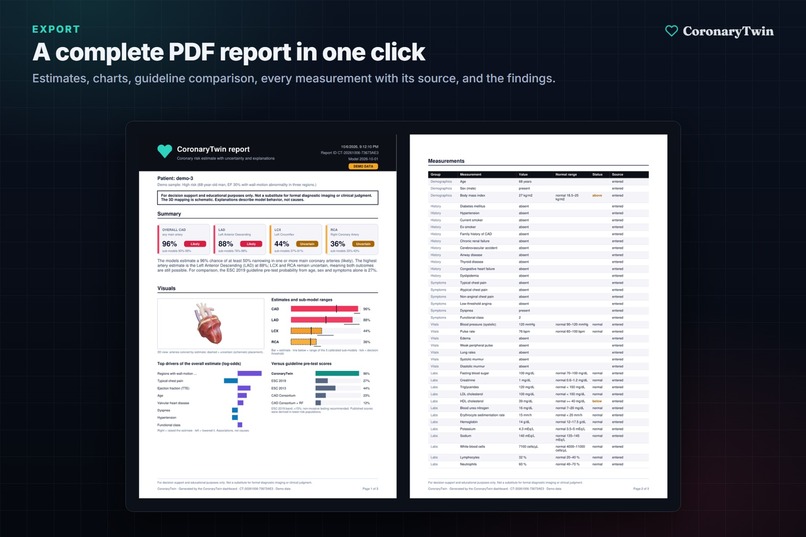
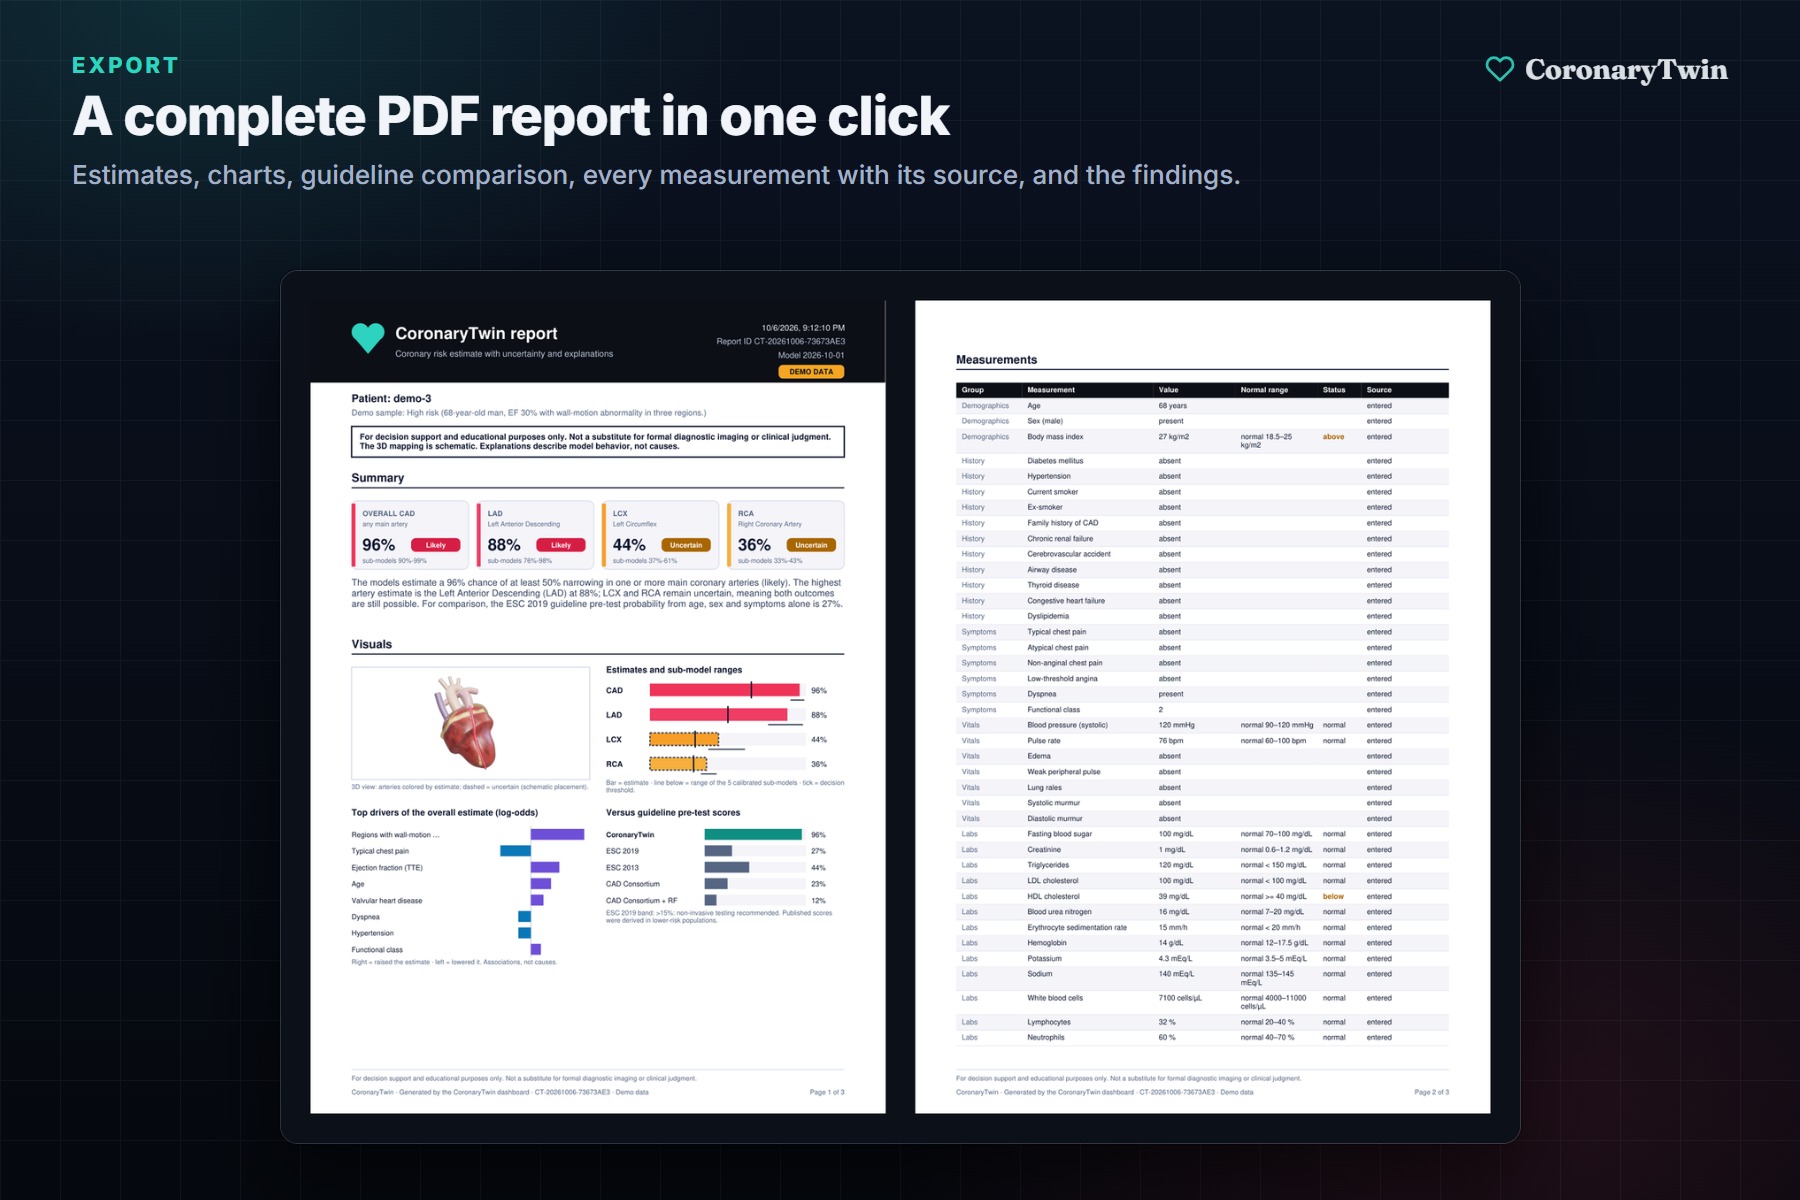
A one-click PDF report with estimates, charts, the guideline comparison and every measurement with its source.
Inspiration
Three coronary arteries feed the heart: the LAD (front), the LCX (side) and the RCA (right). When someone comes in with chest pain, the first estimate a doctor usually reaches for is a guideline pre-test probability score. It gives one number for the whole heart. It can't say which artery is likely narrowed, how confident it is, or why it landed where it did.
I kept thinking about what a doctor actually wants to see before ordering an angiogram, and what a patient wants to understand afterwards. "71% chance of coronary disease" answers neither. So the idea became a digital twin: a 3D heart where each artery has its own estimate, its own uncertainty and its own explanation, and where you can ask "what would change this?" and watch it update.
What it does
CoronaryTwin takes 51 routine clinical measurements (demographics, history, symptoms, ECG, lab results, echo) and predicts:
- overall coronary artery disease (CAD), and
- $\geq 50\%$ stenosis separately in the LAD, LCX and RCA.
Each artery is drawn on a live 3D heart and colored by its own calibrated probability. A solid, steady pulse means the model is confident. A dashed, irregular pulse means it is Uncertain: both outcomes are still possible.
Around the heart:
- Why this estimate: a SHAP waterfall from the average patient to this one.
- What-if: sliders for values a patient can change; the arteries recolor live.
- Model trust: AUC, calibration and a head-to-head comparison with the ESC 2019, ESC 2013 and CAD Consortium guideline scores on the same patients.
- Read reports: drop in a lab PDF or photos of ECG and echo reports. On-device OCR proposes the values, converts units and shows the line each one came from. Nothing enters the record until you confirm it.
- Next best test, visit comparison, cohort mode, present mode and a one-click PDF report.
How I built it
The data and the models
The data is the Extension of the Z-Alizadeh Sani dataset (UCI #411): 303 patients, each with vessel-level labels from angiography. A tested leakage guard removes the label columns (LAD, LCX, RCA, Cath) from the inputs.
For each of the four targets I compared logistic regression, random forest, XGBoost and LightGBM inside a scikit-learn pipeline (imputation → scaling / one-hot → classifier). With only 303 patients, the evaluation had to be honest, so everything runs in nested, repeated, stratified cross-validation: 5×5 outer folds for performance and an inner 3-fold randomized search for hyperparameters. Preprocessing, tuning and calibration all happen inside each training split, so every reported number comes from patients the model never saw.
To pick a model family I used the one-standard-error rule: take the simplest family whose mean AUC is within one standard error of the best.
$$ \text{chosen} = \text{simplest } m \;\text{ such that }\; \overline{\mathrm{AUC}}m \;\geq\; \overline{\mathrm{AUC}}{\text{best}} - \mathrm{SE}_{\text{best}} $$
That chose logistic regression for CAD and RCA and random forests for LAD and LCX. The boosted models were never clearly better on data this small.
Probabilities you can put on a heart
Coloring an artery by its probability only makes sense if the probability is calibrated. Each model is wrapped in Platt scaling (a 5-fold ensemble):
$$ \hat{p}(x) = \sigma\big(a\,f(x) + b\big) = \frac{1}{1 + e^{-(a f(x) + b)}} $$
This lowered the Brier score for every target (RCA from 0.22 to 0.20, for example).
The decision threshold favors recall, because in screening a missed stenosis costs more than a false alarm. It is the highest cut-off that still catches 85% of positives:
$$ t^{*} = \max {\, t \;:\; \mathrm{recall}(t) \geq 0.85 \,} $$
Honest uncertainty: conformal prediction
I wanted "Uncertain" to mean something with a guarantee, not a vibe. So I used split conformal prediction with the nonconformity score
$$ s(x, y) = 1 - \hat{p}_y(x), $$
meaning one minus the probability the model gave the true class. On $n$ held-out calibration scores, the threshold is the empirical quantile
$$ \hat{q} = \mathrm{Quantile}!\left(s_1, \dots, s_n;\; \frac{\lceil (n+1)(1-\alpha) \rceil}{n}\right), $$
and the prediction set for a new patient is
$$ C(x) = {\, y \in {0, 1} \;:\; 1 - \hat{p}_y(x) \leq \hat{q} \,}. $$
With $\alpha = 0.1$ this guarantees $\mathbb{P}\big(y \in C(x)\big) \geq 90\%$. Measured coverage was 90.5–90.7% for all four targets. When $C(x) = {0, 1}$, the artery is shown as Uncertain.
Explanations
SHAP values split each prediction into additive contributions:
$$ f(x) = \phi_0 + \sum_{i=1}^{51} \phi_i(x) $$
$\phi_0$ is the average patient, and each $\phi_i$ is how much measurement $i$ pushed this patient up or down. The waterfall in the app is exactly this sum, in the model's own units. The drivers next to the heart ("Echo 49%, Symptoms 15%…") add up the SHAP values within each of the 7 measurement groups $g$ and show each group's share:
$$ \mathrm{share}g = \frac{\left|\sum{i \in g} \phi_i\right|}{\sum_{h} \left|\sum_{i \in h} \phi_i\right|} $$
The stack
- ML: Python, scikit-learn, LightGBM, XGBoost, SHAP, conformal prediction
- API: FastAPI, RapidOCR (ONNX, runs on-device) and pypdf for reading reports
- Web: React 19, TypeScript, Vite, three.js through React Three Fiber, Zustand, jsPDF
- Tests: pytest (158), Vitest (86), Playwright end-to-end
- Deploy: Docker, Render for the API, Vercel for the website
Results
| Estimate | Model | ROC-AUC (95% CI) |
| Overall CAD | Logistic regression | 0.92 (0.91–0.93) | | LAD | Random forest | 0.85 (0.83–0.87) | | LCX | Random forest | 0.72 (0.70–0.75) | | RCA | Logistic regression | 0.72 (0.69–0.74) |
On overall CAD, the model ranks patients better than the ESC 2019 guideline score by $\Delta\mathrm{AUC} = +0.10$ (95% CI $+0.06$ to $+0.15$).
Challenges I ran into
A small dataset makes it easy to fool yourself. With 303 patients, the result of a single train/test split depends heavily on which patients happen to land in the test set. Nested cross-validation with bootstrap intervals was slower to build, but it was the only way to report numbers I could defend.
Two arteries are hard. For LCX and RCA the model is not reliably better than simple clinical scores, and conformal prediction marks more than half of those patients Uncertain. I could have hidden that. Instead the app says it plainly in the Model trust tab, and the 3D heart shows those arteries dashed. Showing where the model is weak turned out to be one of its most useful features.
The labels have no location. The data says which artery is narrowed, not where along it. Painting a lesion at a specific spot would have looked impressive and been made up. So the whole artery is colored, and the app labels the view schematic.
Four models can disagree. The overall-CAD model and the three artery models are trained separately, so in principle one could say "no disease" while another says "LAD likely". I added a coherence check that flags those patients instead of quietly forcing the numbers to agree.
OCR on a free server. Reading a photo of a report with OCR peaked at about 585 MB of memory, more than the 512 MB free hosting plan allows. I shrink images to 2000 px, limit OCR threads, and on the free server turn photo reading off while keeping PDF and text reports working. With 1 GB of memory every feature works.
A race condition in the PDF. In an early version, exporting right after switching patients could put one patient's measurements next to the previous patient's estimates. The fix was to wait until the estimates had settled for exactly the inputs on screen before taking the 3D snapshot and building the report.
Making uncertainty readable at a glance. A probability bar alone doesn't say "the model is unsure". After a few attempts I settled on motion and line style: confident arteries pulse steadily, uncertain ones are dashed with an irregular pulse.
Accomplishments that I'm proud of
- Beating the guideline score. On overall CAD the model reaches an AUC of 0.92 and ranks patients better than the ESC 2019 pre-test score by +0.10 AUC, measured on the same patients with confidence intervals.
- Uncertainty with a guarantee. Conformal prediction hits its 90% coverage target for all four models (measured 90.5–90.7%). When the app says "Uncertain", that comes from a calibrated rule, not a guess.
- Every number is honest. All results come from nested cross-validation on patients the model never saw. The weaker arteries (LCX and RCA) are reported openly in the app, not hidden.
- Prediction, explanation and 3D in one place. Per-artery risk, SHAP explanations, what-if sliders and the live 3D heart all stay in sync with each other.
- It reads real reports. Lab PDFs and photos of ECG and echo reports become checked values, each linked to the line it came from.
- Built like a real product. 158 backend tests, 86 frontend tests and end-to-end browser tests. It runs in one Docker command and is deployed online for free.
What I learned
- Calibration matters more than AUC once you show a number. A well-ranked but miscalibrated 80% is misleading the moment it is painted on an artery.
- Conformal prediction is the easiest honest uncertainty I know. It is a few lines of code on top of any model, and it comes with a coverage guarantee you can measure.
- Simple models hold up on small data. Logistic regression matched the boosted trees for overall CAD, and the one-standard-error rule kept me from chasing noise.
- Saying what the model can't do builds trust. Comparing against guideline scores, with confidence intervals and known limits, made the strong results more believable, not less.
- 3D on the web is now practical. React Three Fiber let the heart be ordinary React state, so the sliders, tabs and PDF all stay in sync with it.
What's next for CoronaryTwin
- External validation on a second hospital's data
- Lesion-level labels, so the coloring can move from schematic to anatomical
- Clinician feedback on the what-if and report-reading workflow
Built With
- docker
- fastapi
- jspdf
- lightgbm
- pypdf
- python
- rapidocr
- react
- scikit-learn
- typescript
- vite
- xgboost

Log in or sign up for Devpost to join the conversation.