-
-
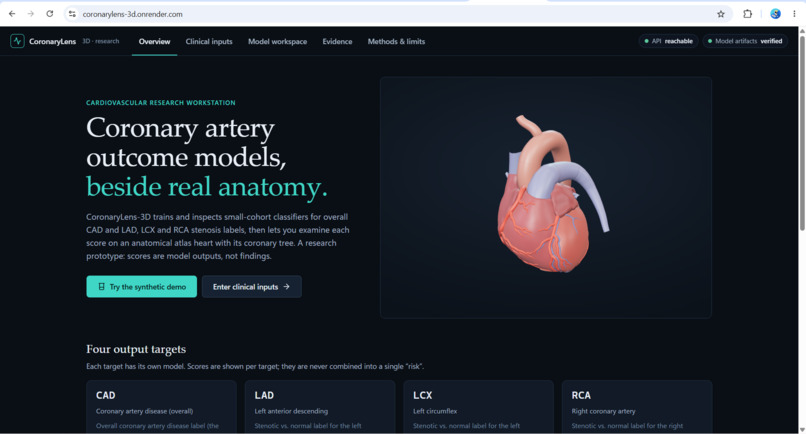
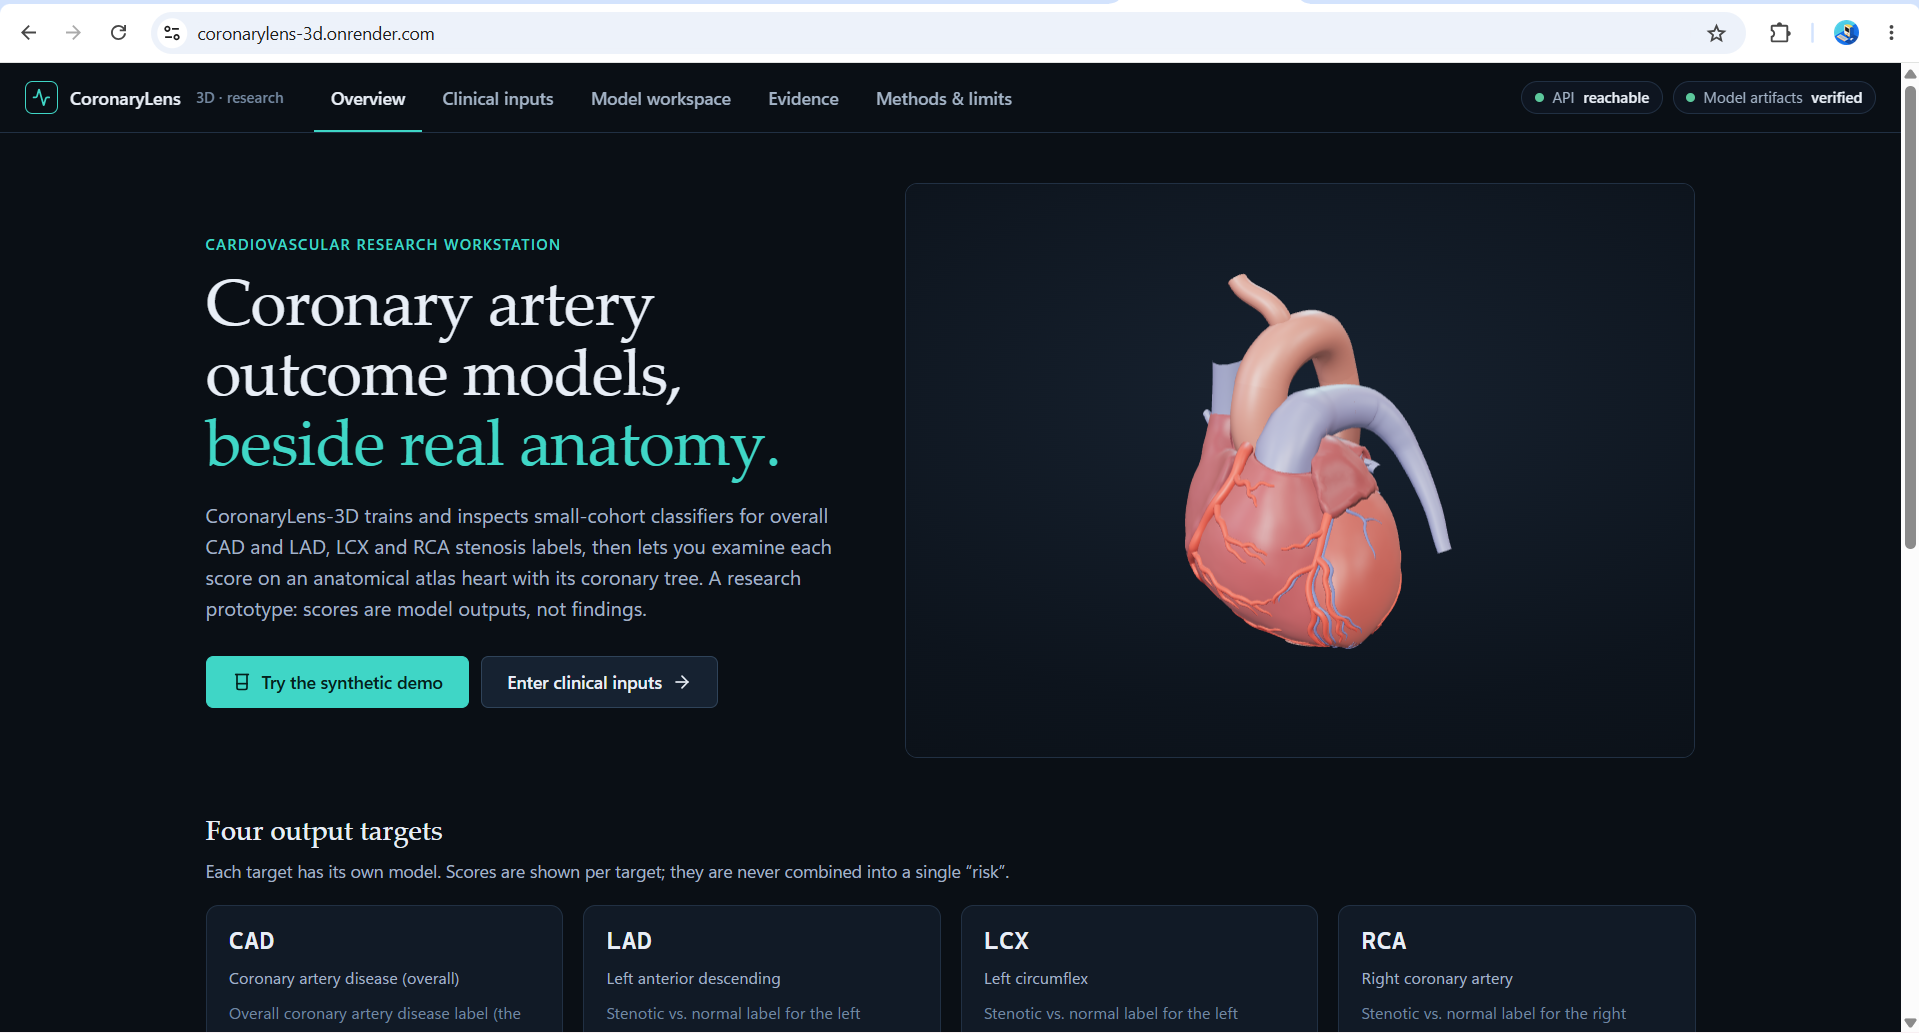
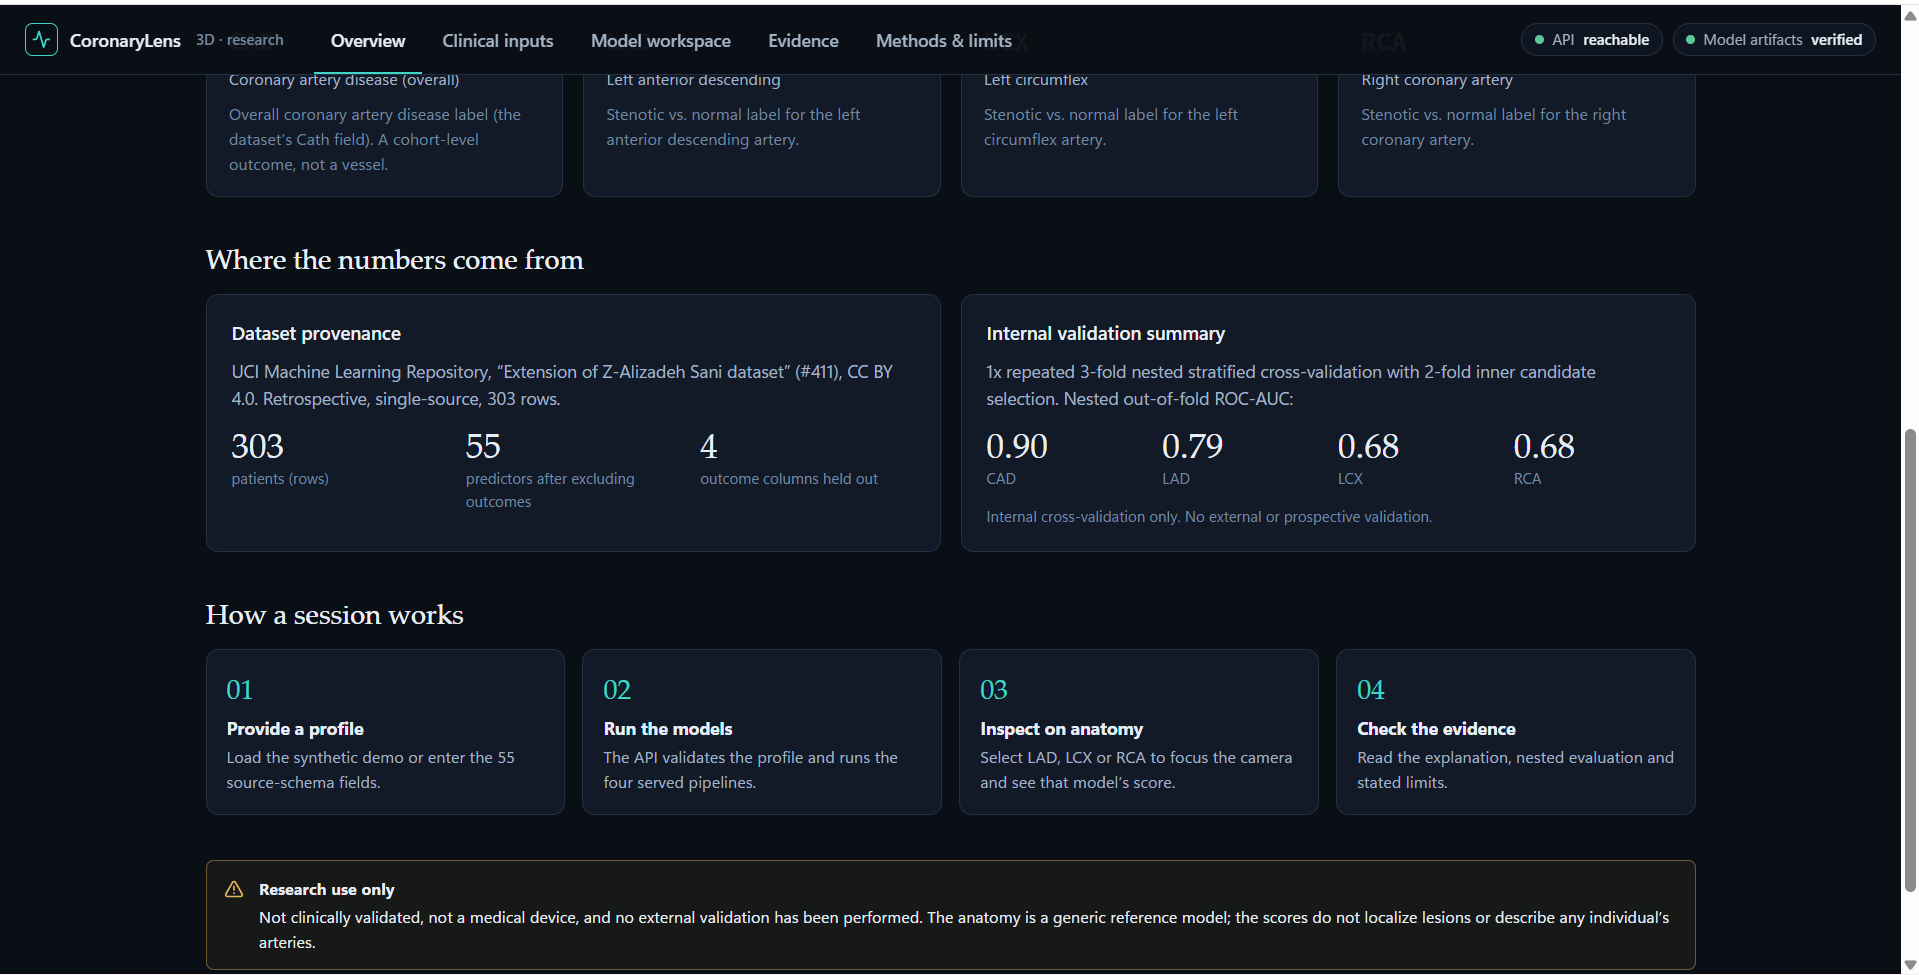
An interactive 3D heart atlas introduces four separate research outputs: CAD, LAD, LCX, and RCA.
-
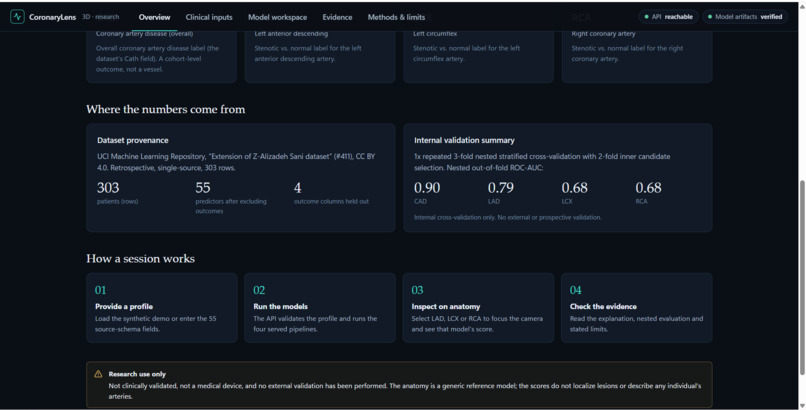
Dataset provenance, four target-wise validation scores, the workflow, and research-only limitations in one view.
-
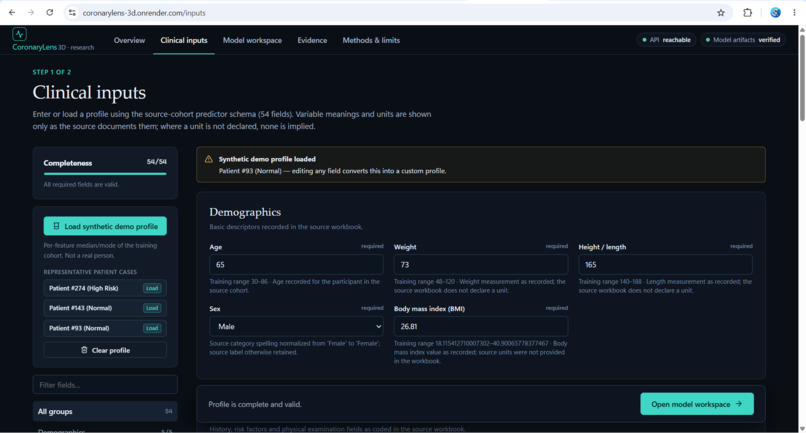
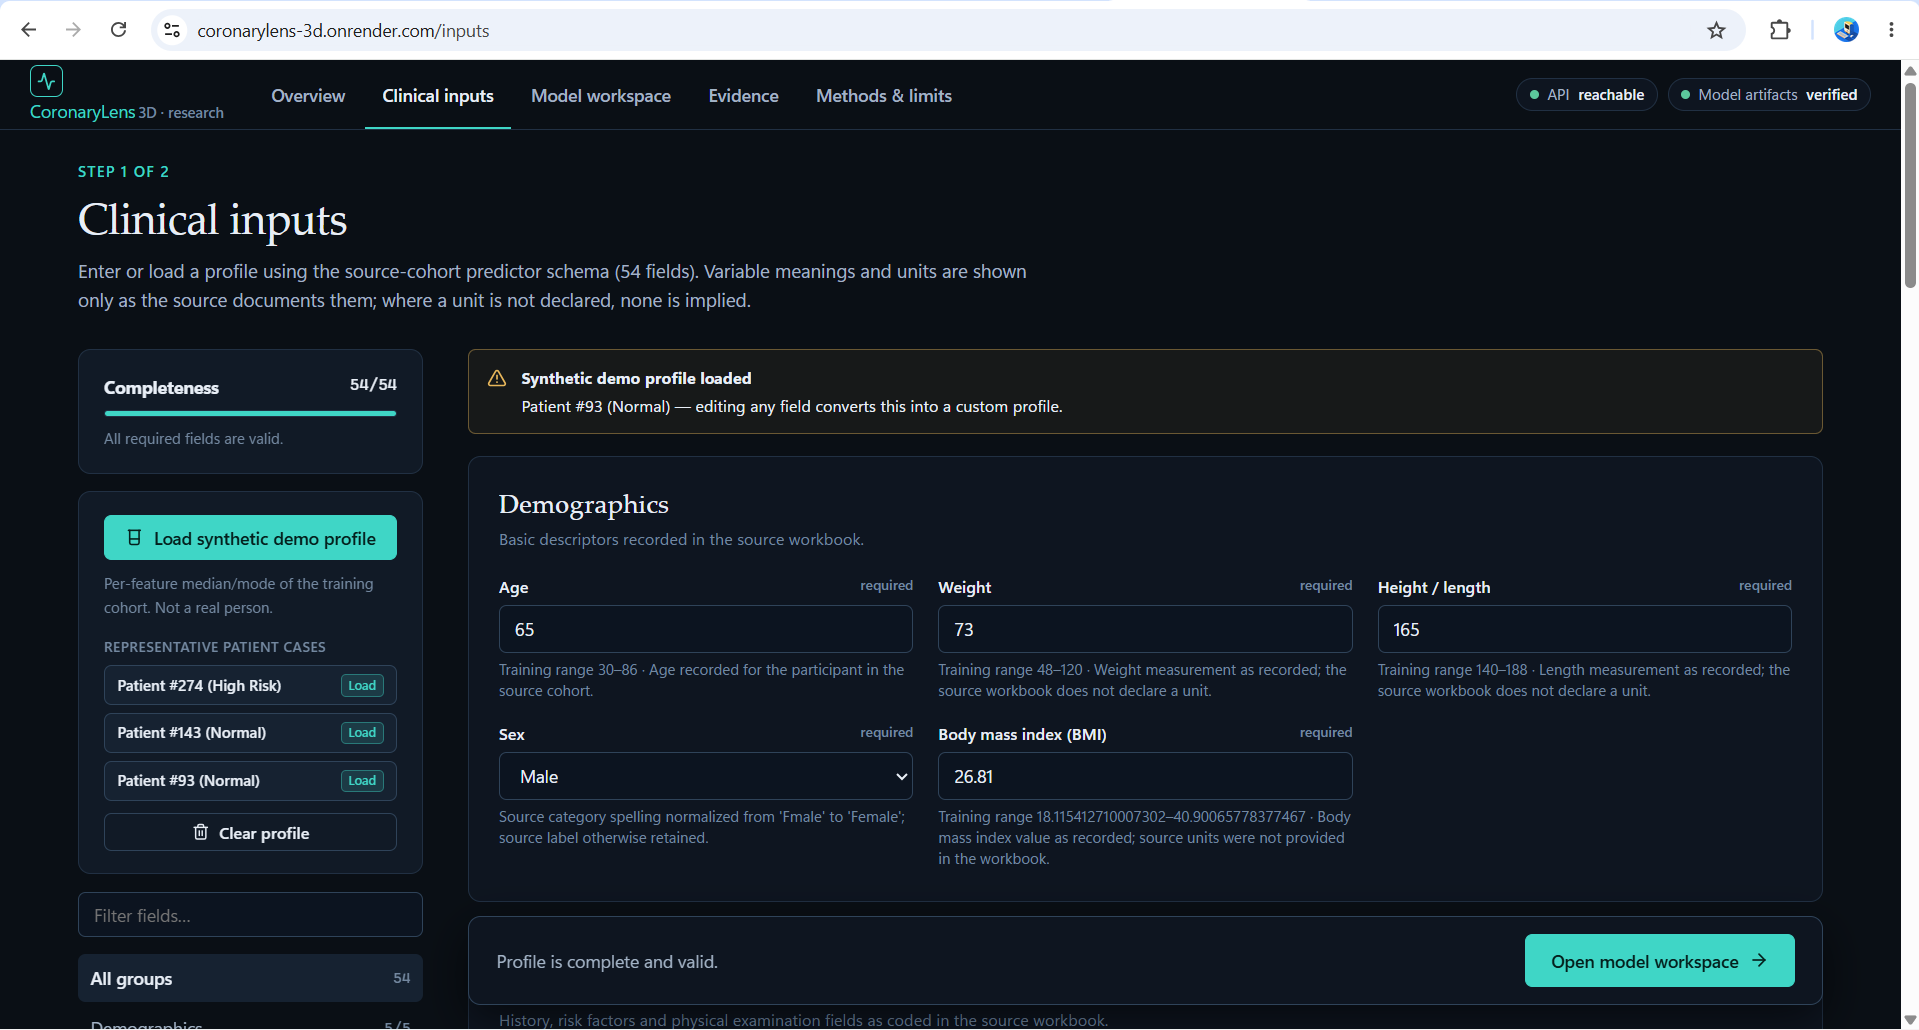
54 clinical fields, validated inputs, and synthetic patient cases for demonstrations.
-
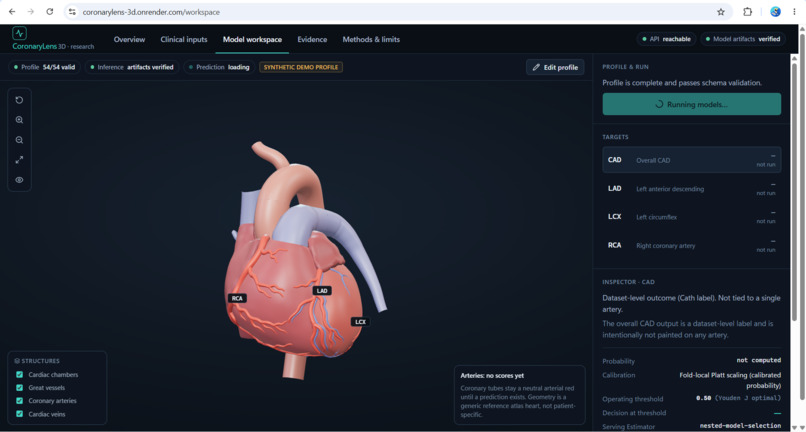
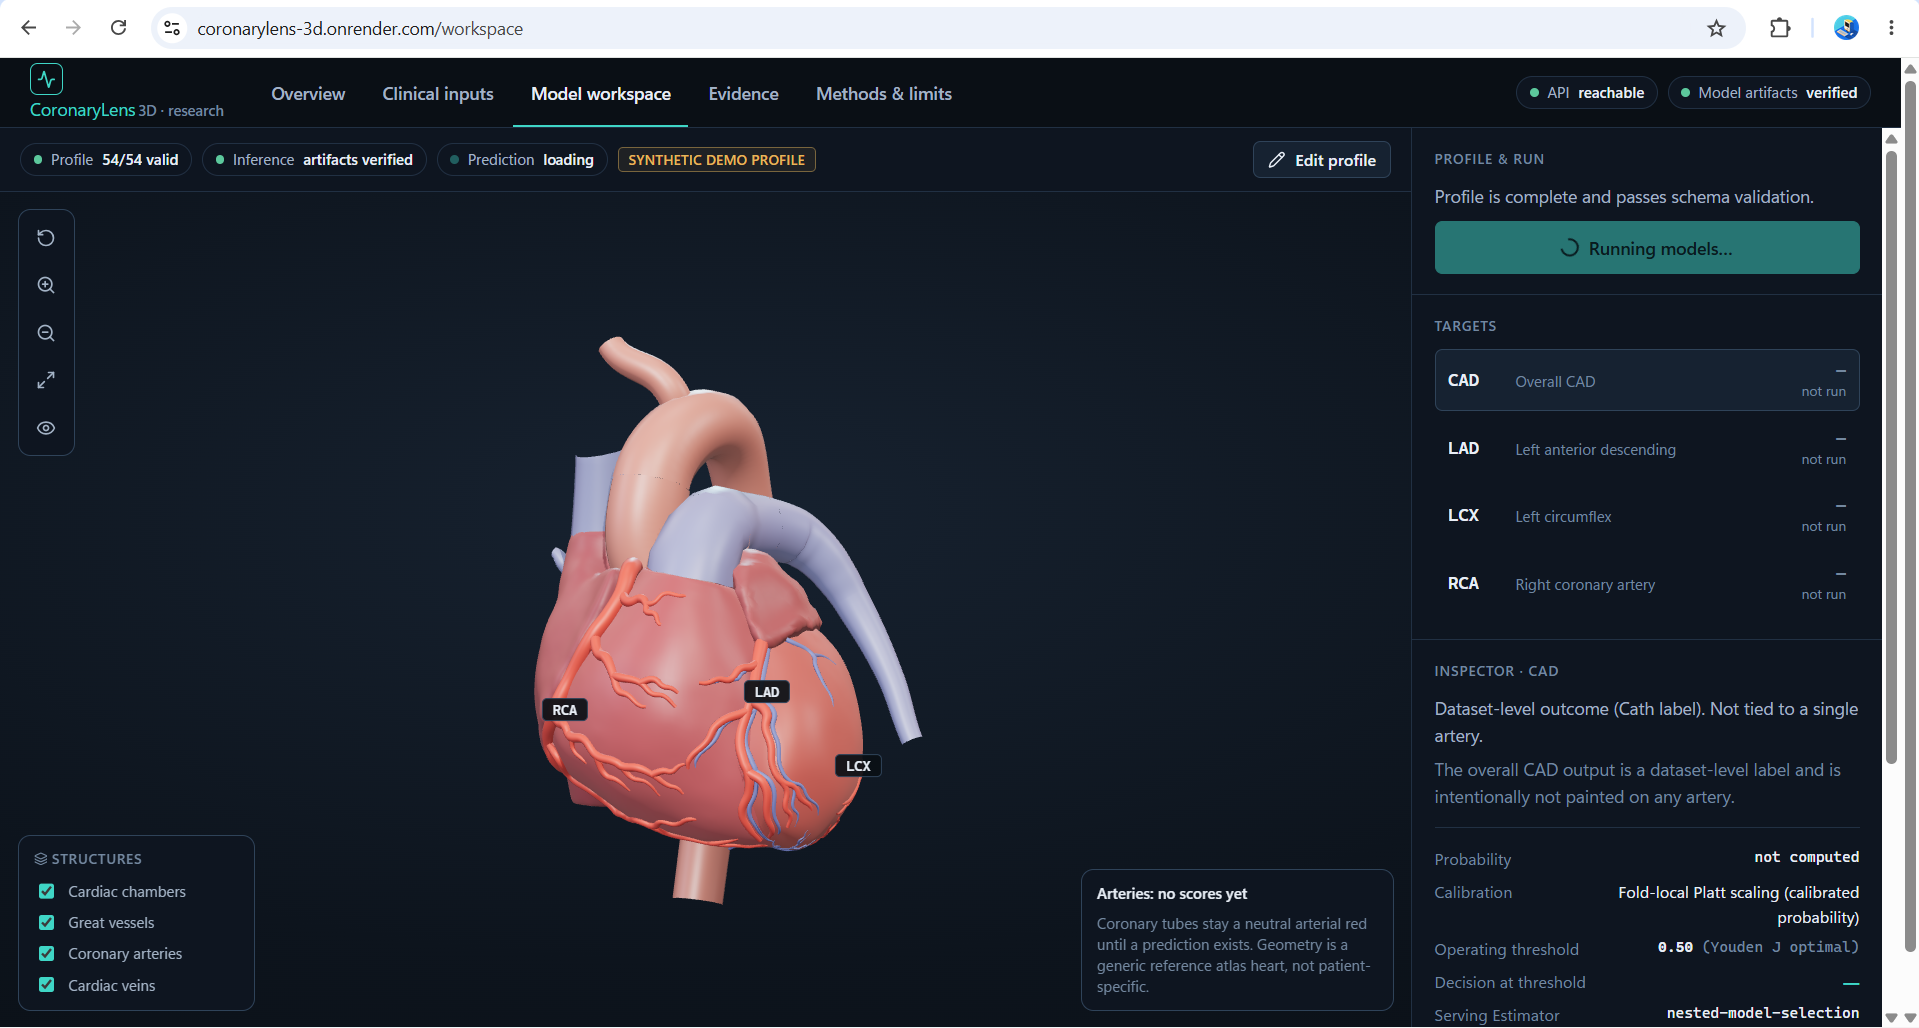
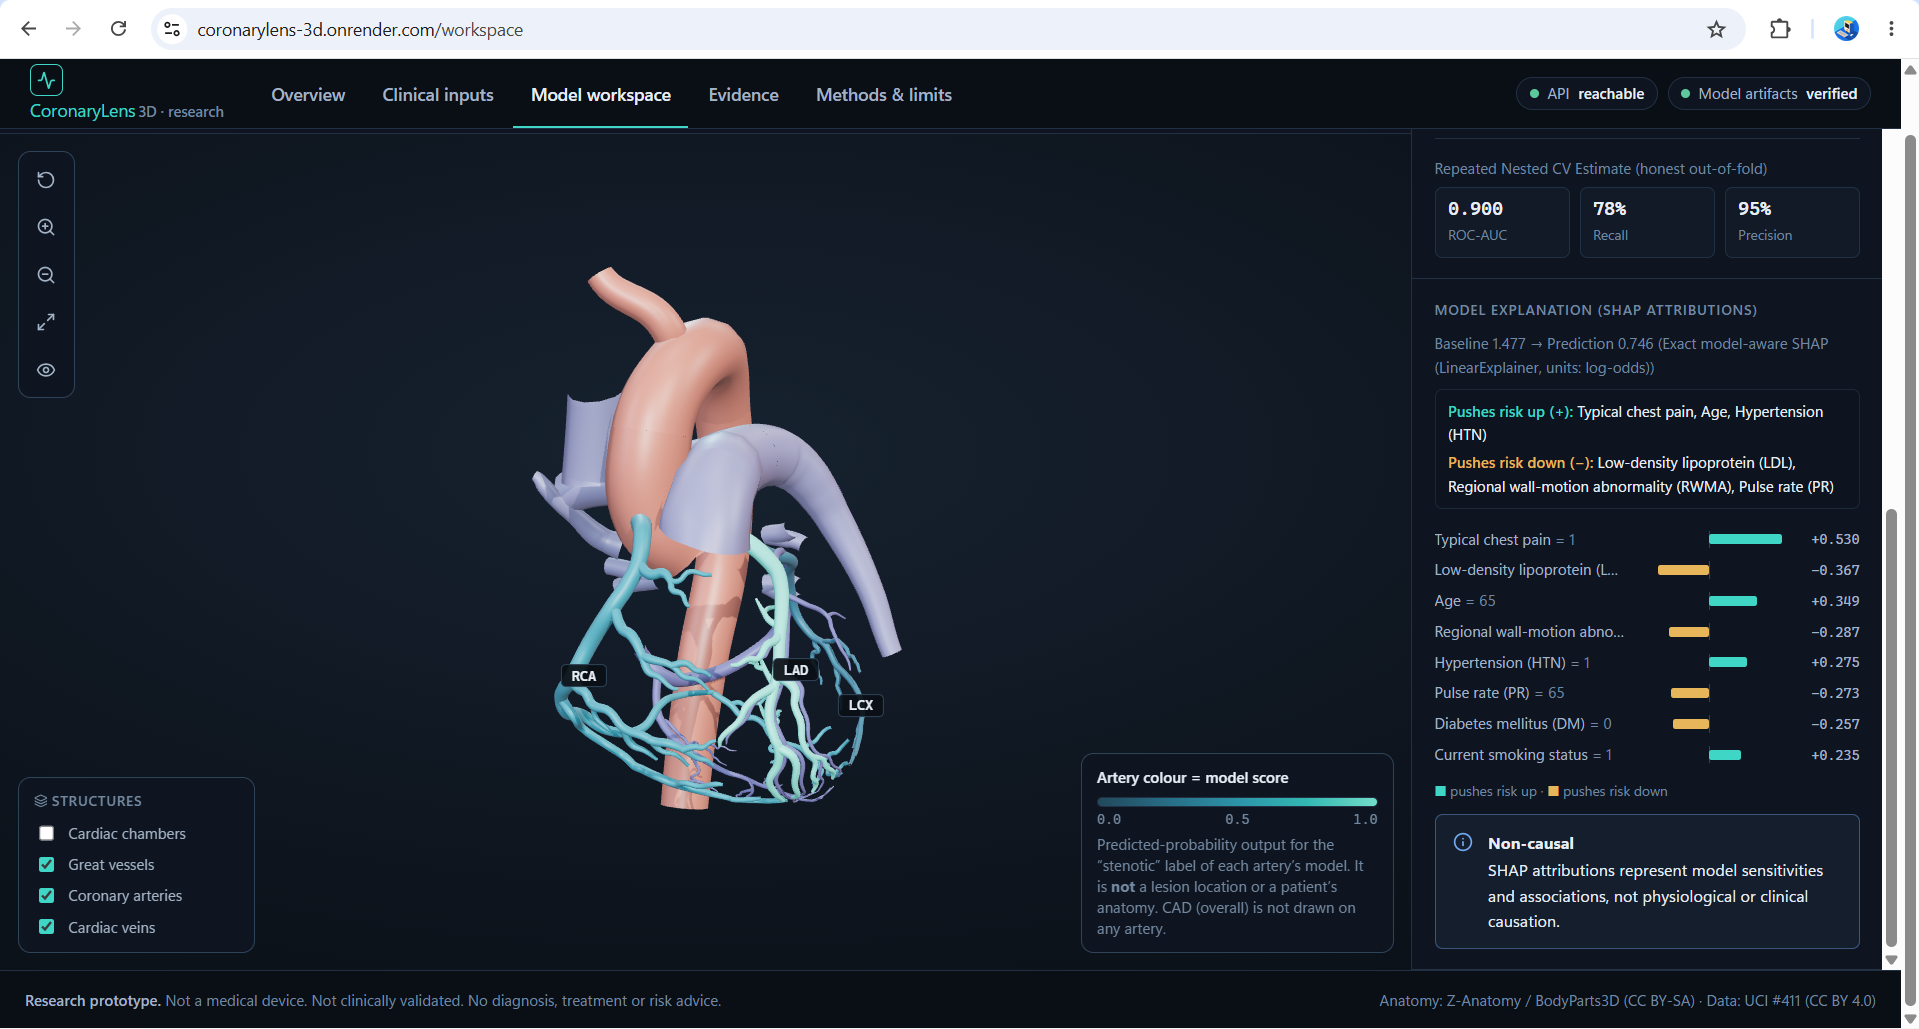
The model workspace connects validated clinical inputs, four prediction targets, and an interactive 3D heart with labeled coronary arteries.
-
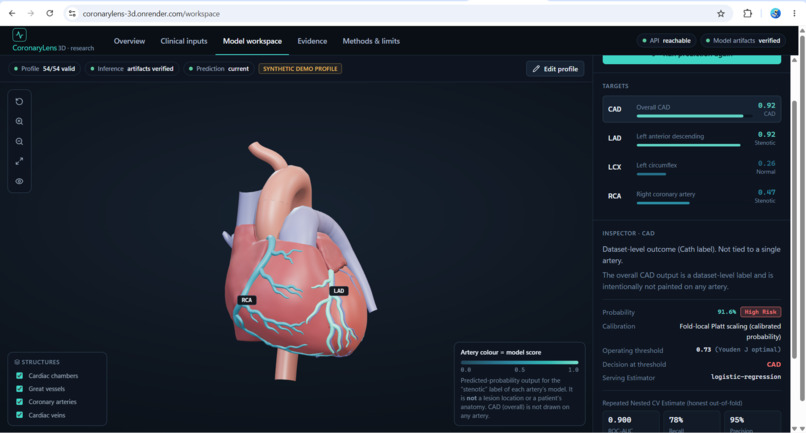
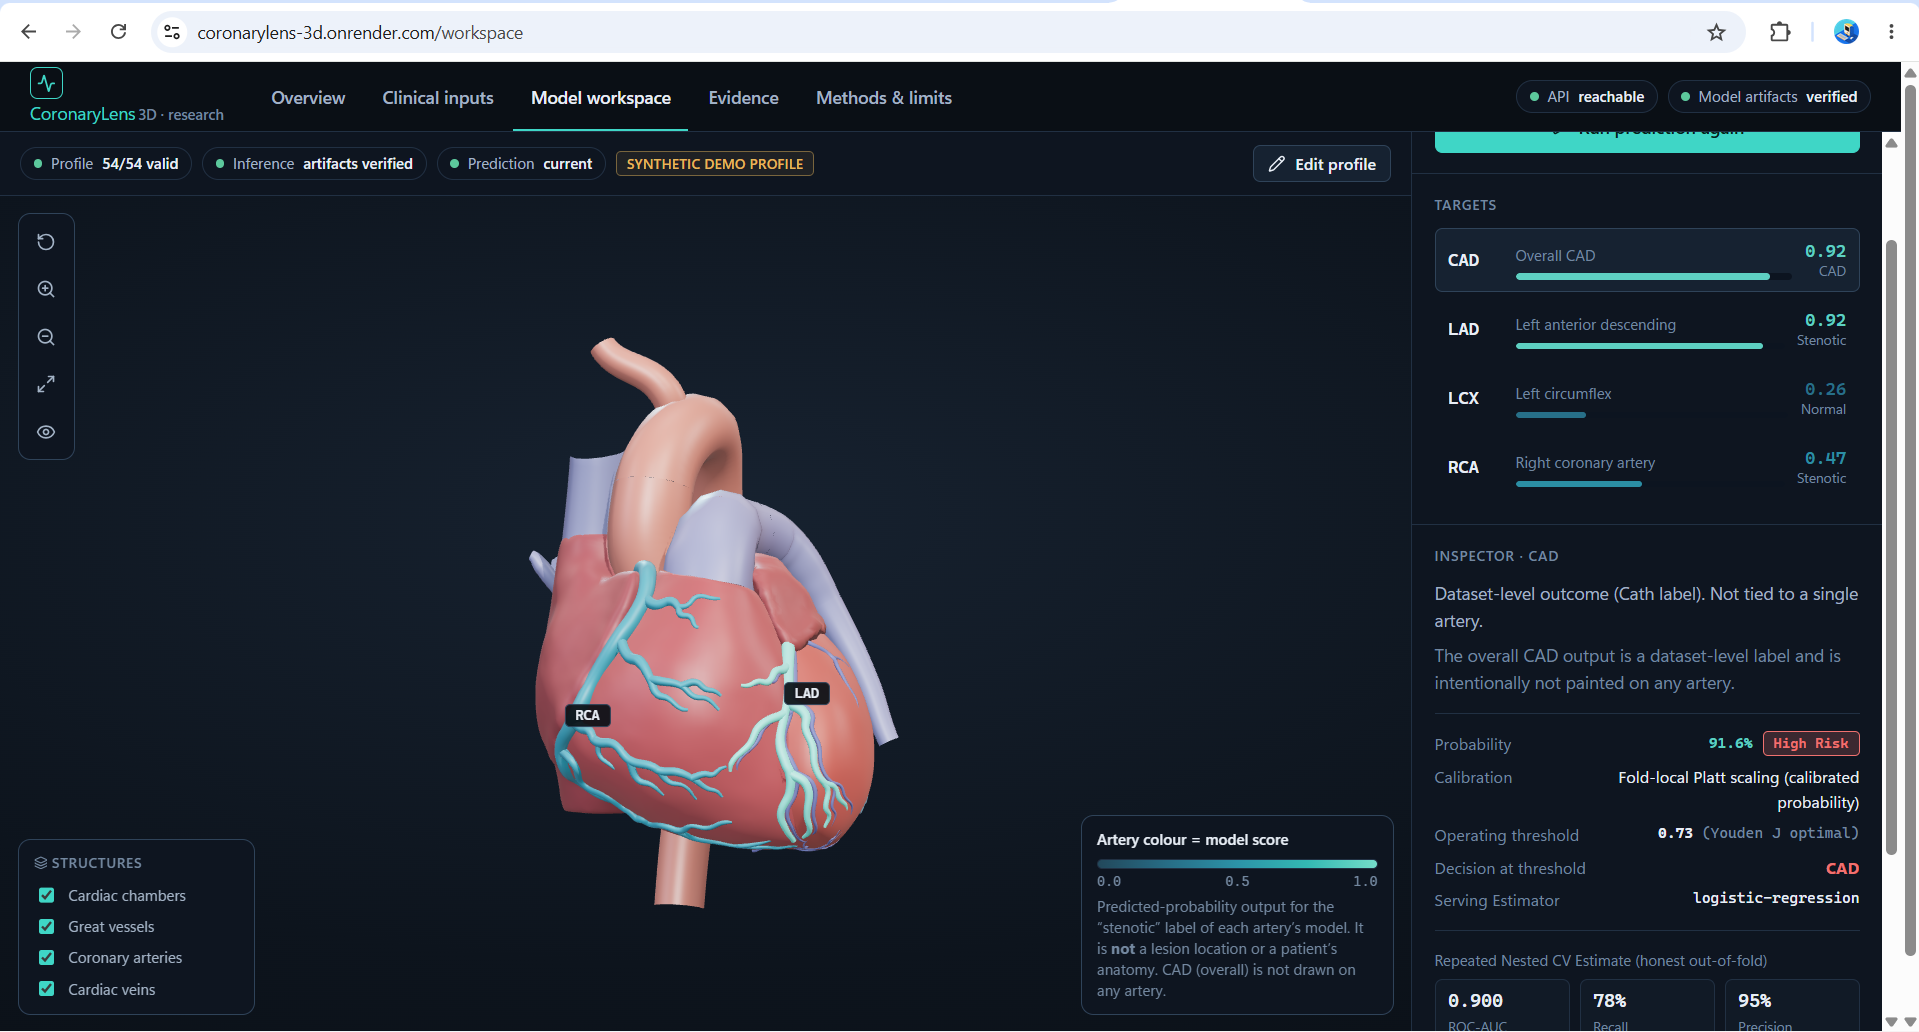
Four model predictions connect CAD, LAD, LCX and RCA scores to 3D vessel colors, calibrated probabilities and target-specific thresholds.
-
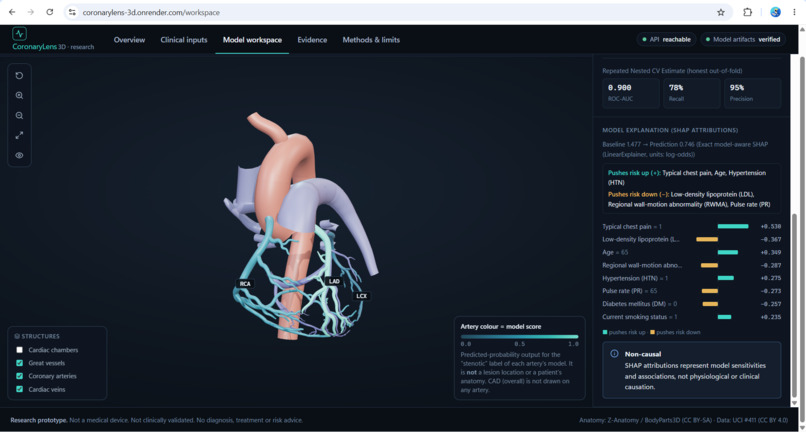
SHAP explanations show which clinical features push model predictions up or down, alongside 3D anatomy and a clear non-causality warning.
-
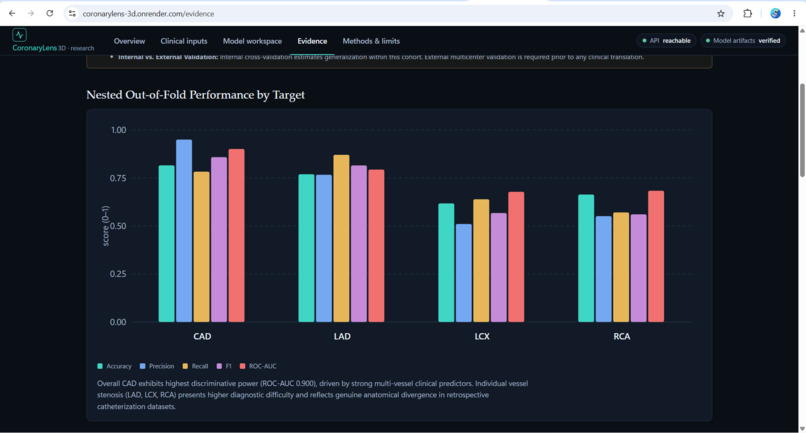
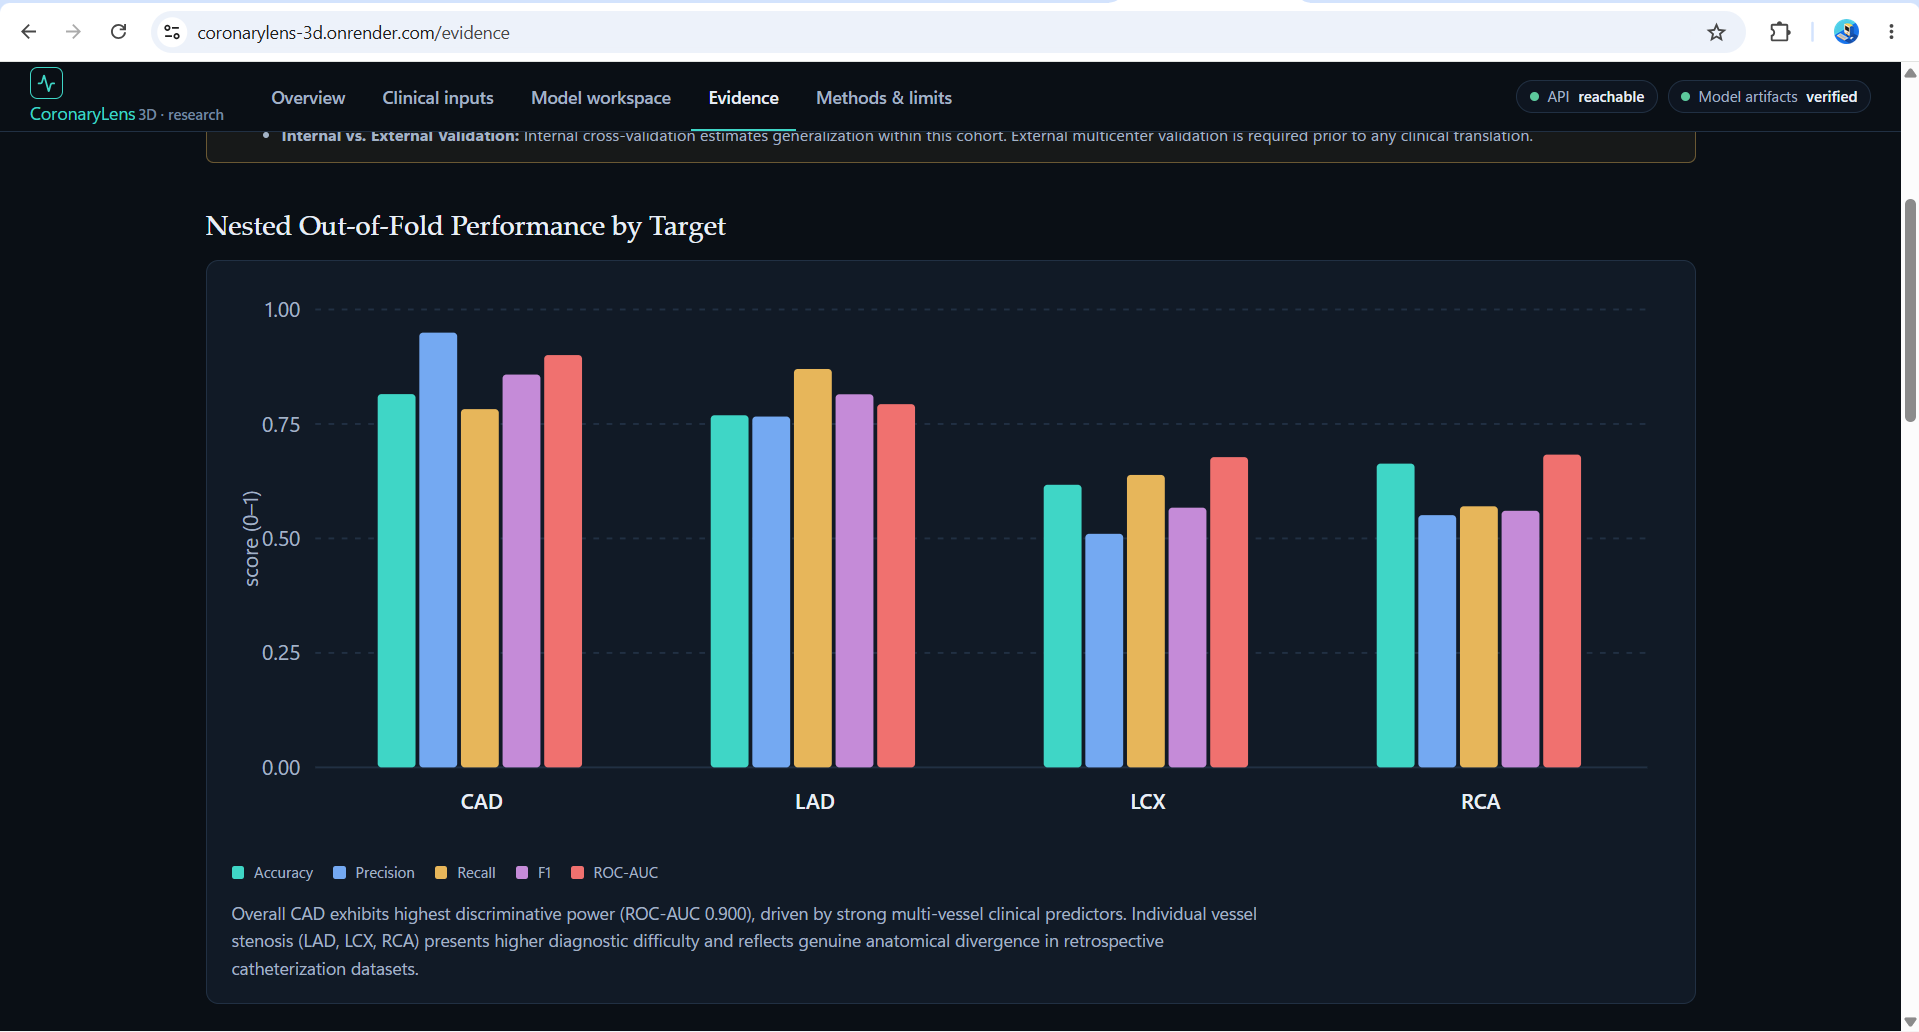
Nested cross-validation compares accuracy, precision, recall, F1-score and ROC-AUC across CAD, LAD, LCX and RCA.
-
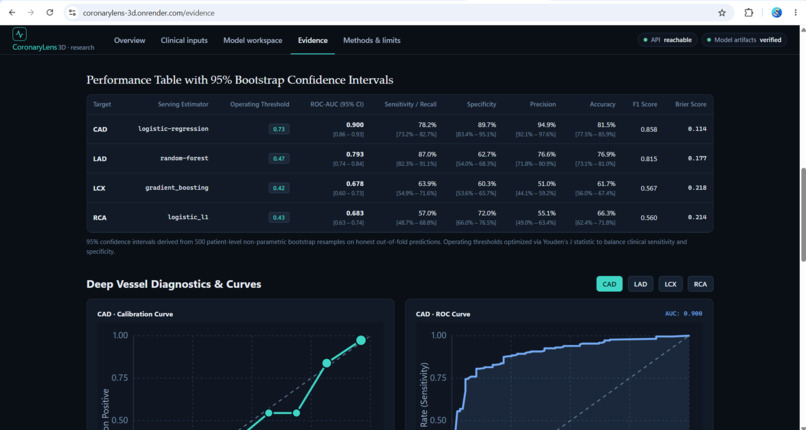
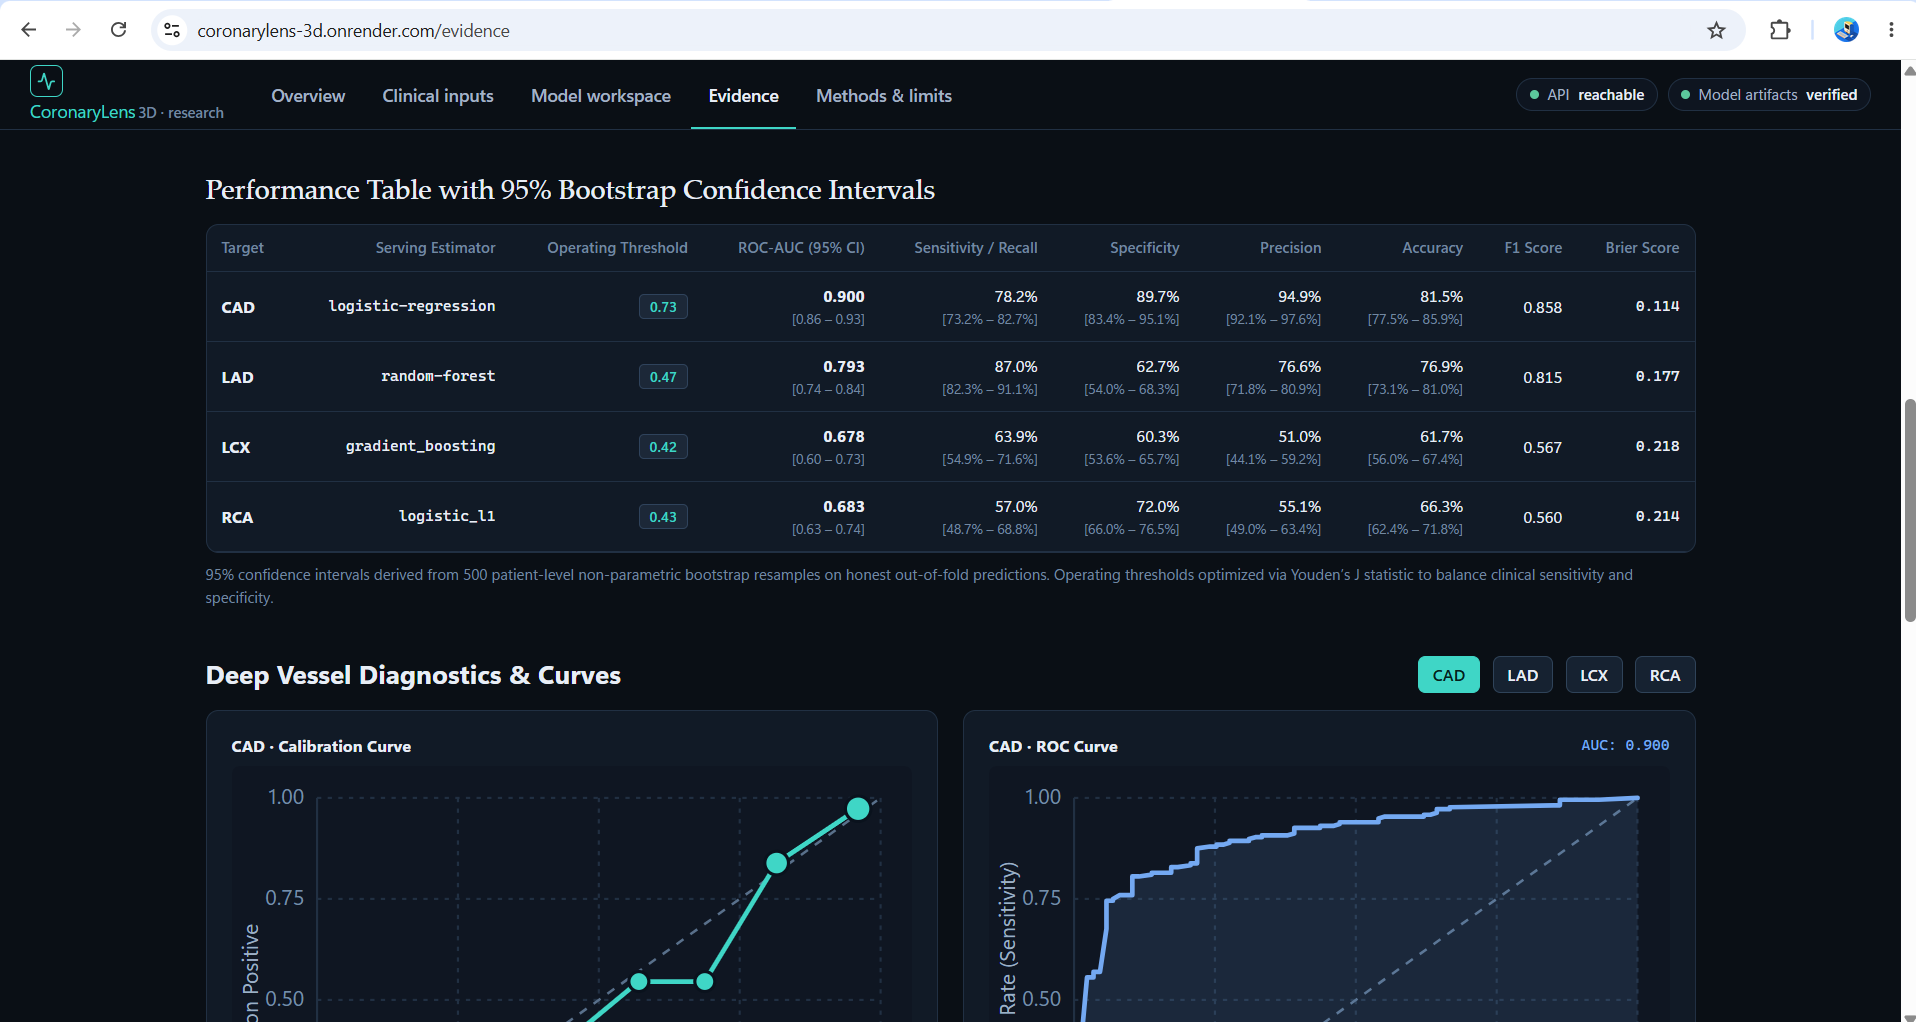
Target-wise metrics, 95% bootstrap confidence intervals, operating thresholds, and calibration and ROC curves for CAD, LAD, LCX and RCA.
-
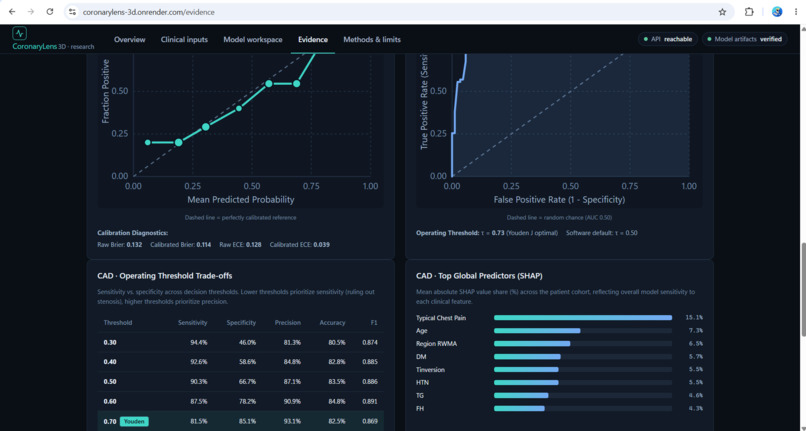
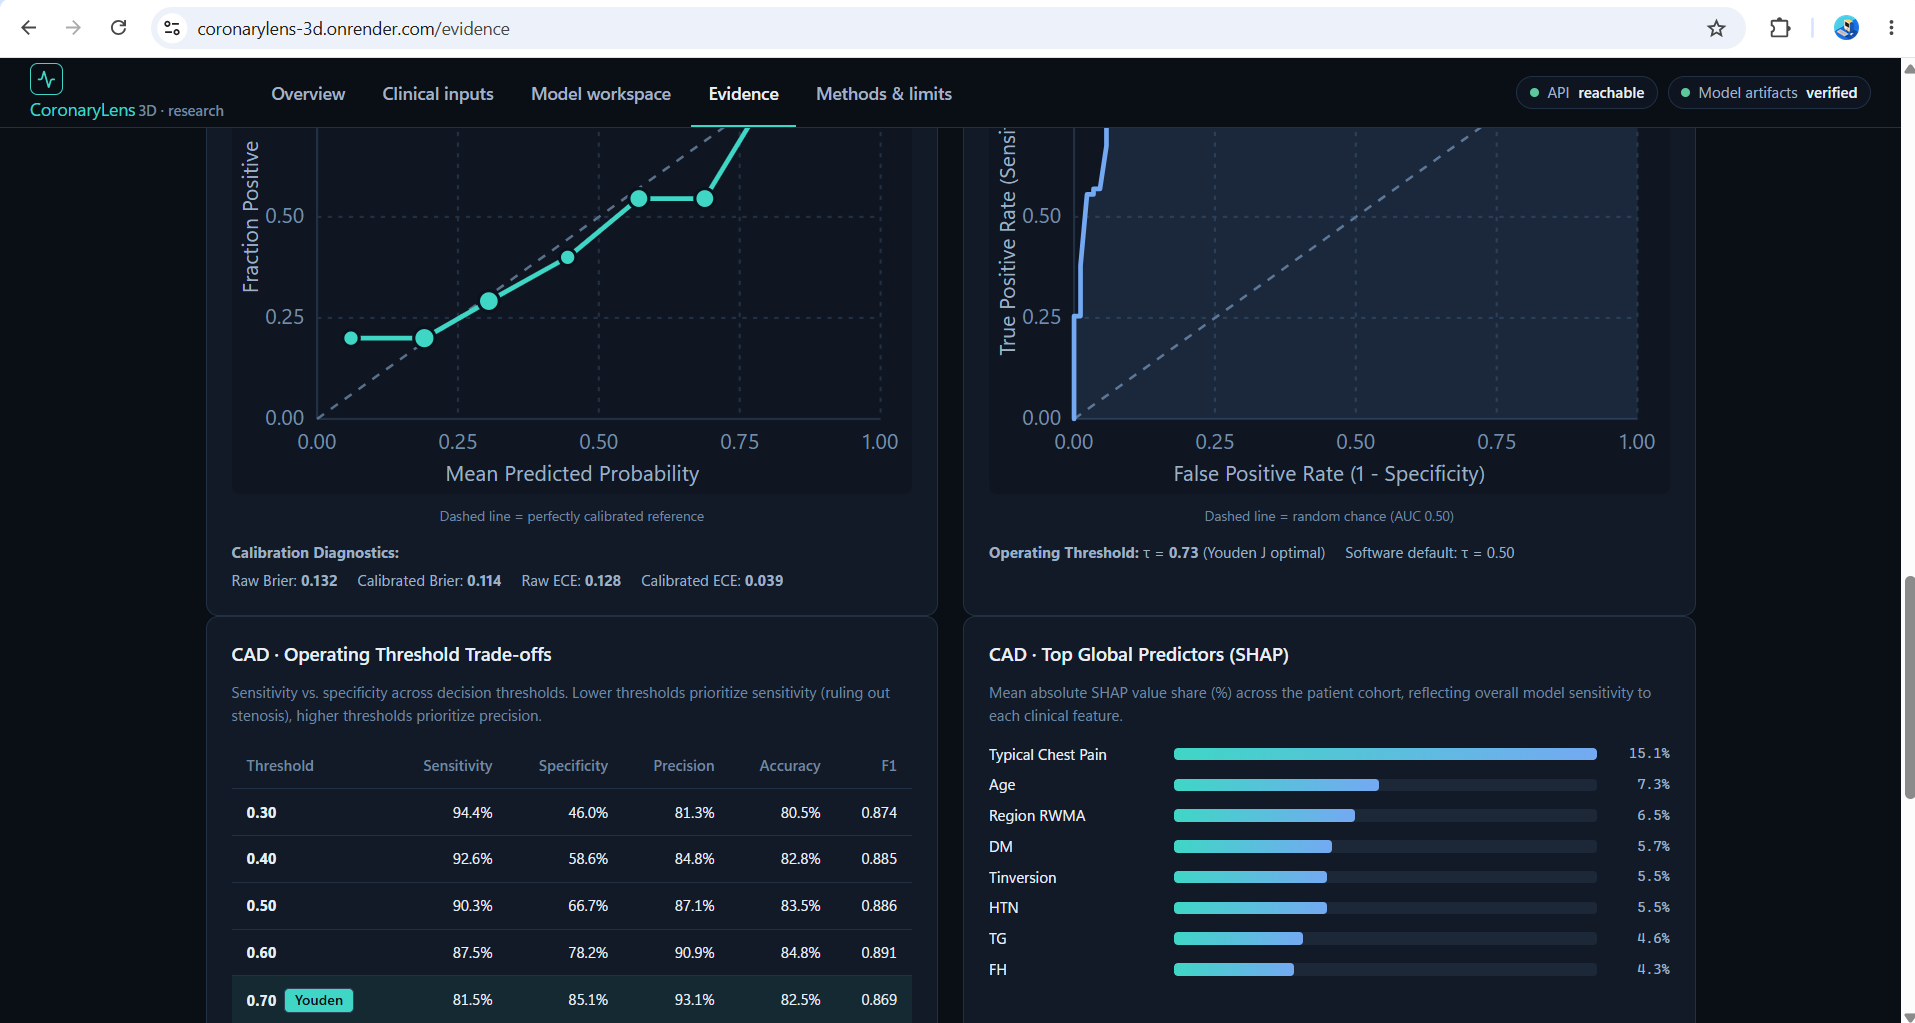
Explore calibration and ROC curves, threshold trade-offs, plus global SHAP importance to understand model performance and clinical features.
-
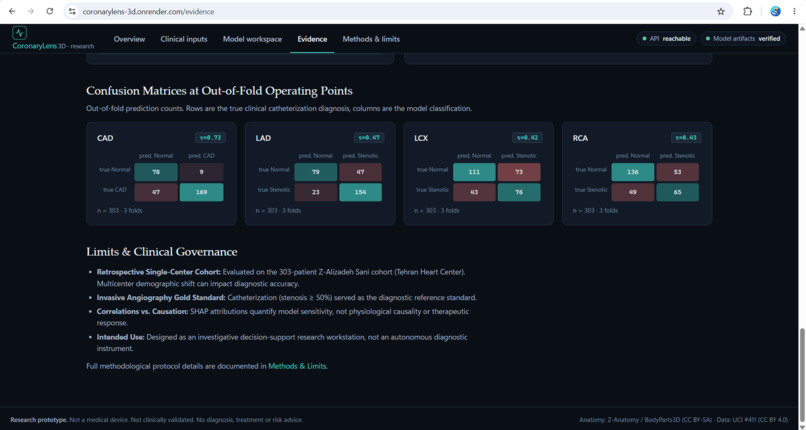
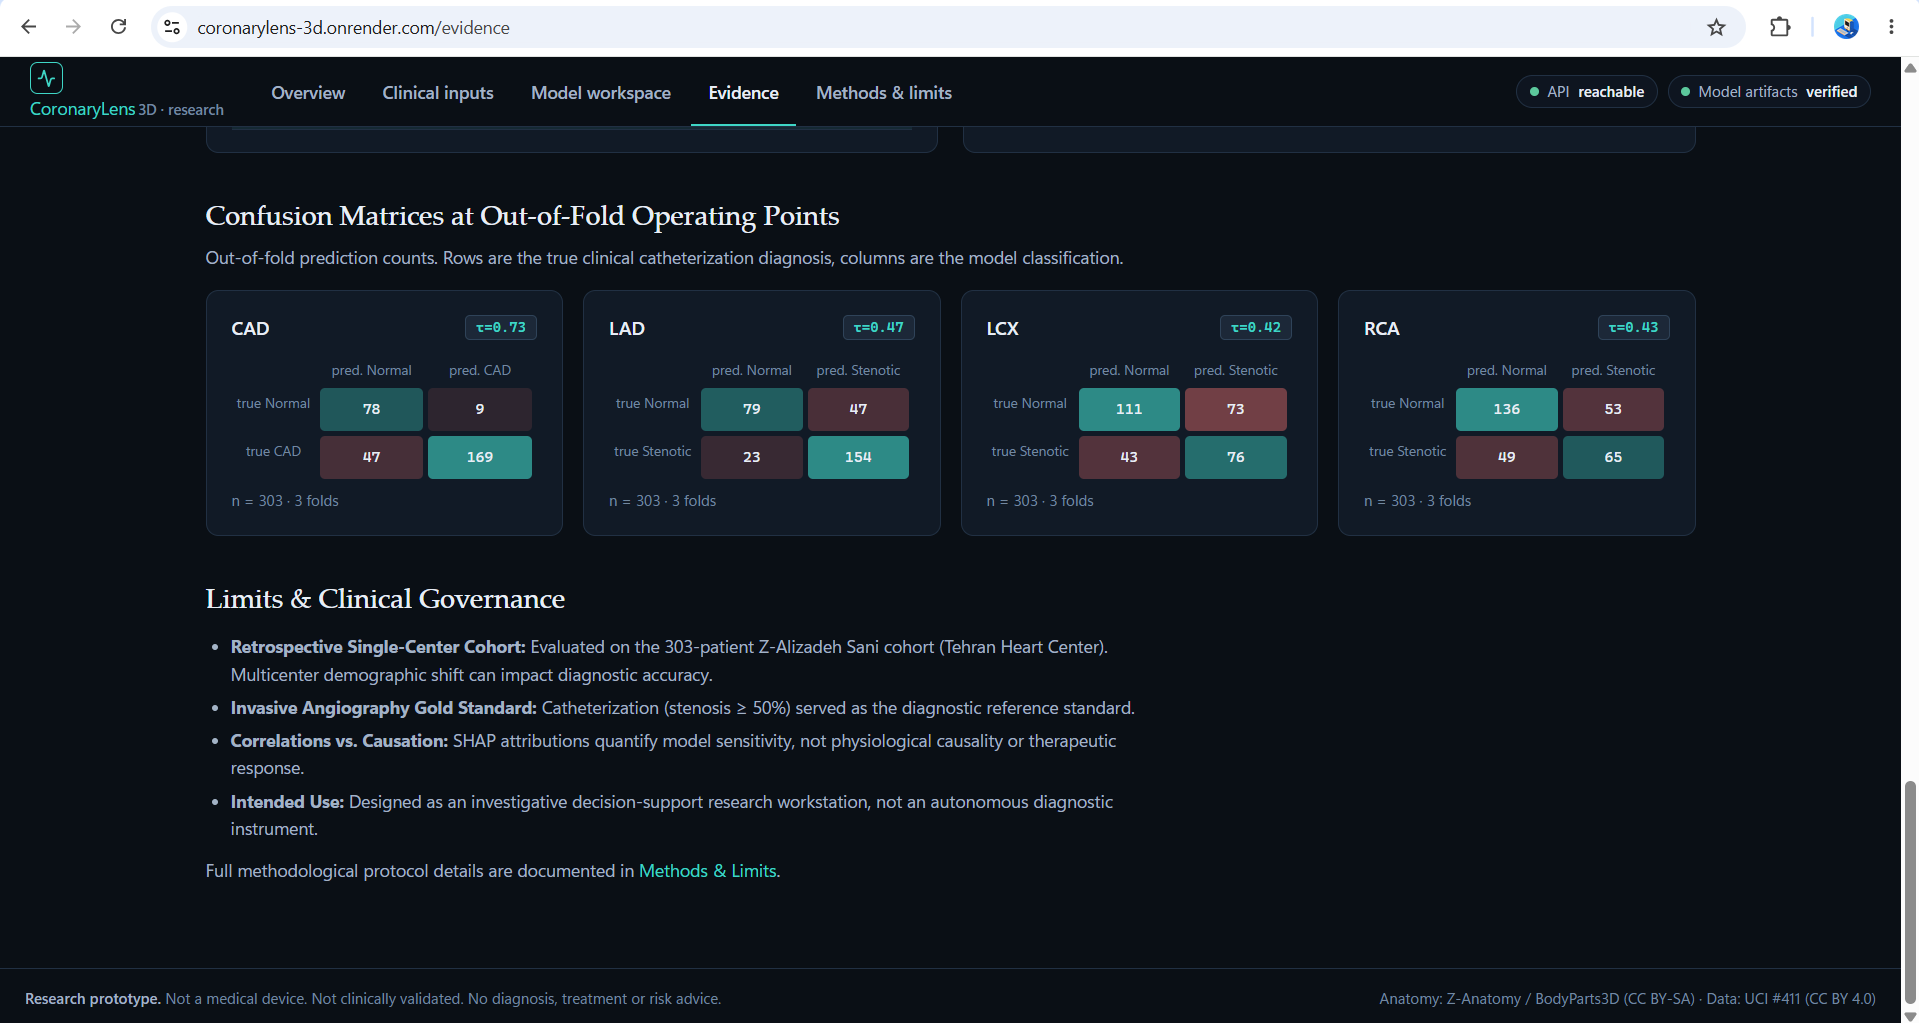
Four target-wise confusion matrices, cohort limitations, angiography reference labels, and research-only safeguards.
-
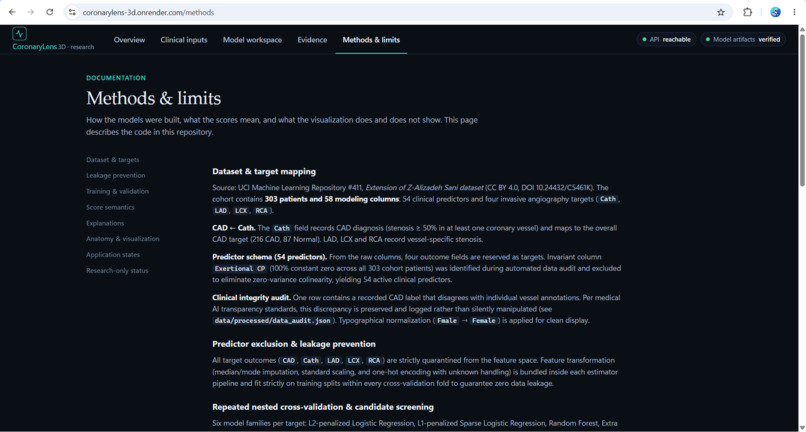
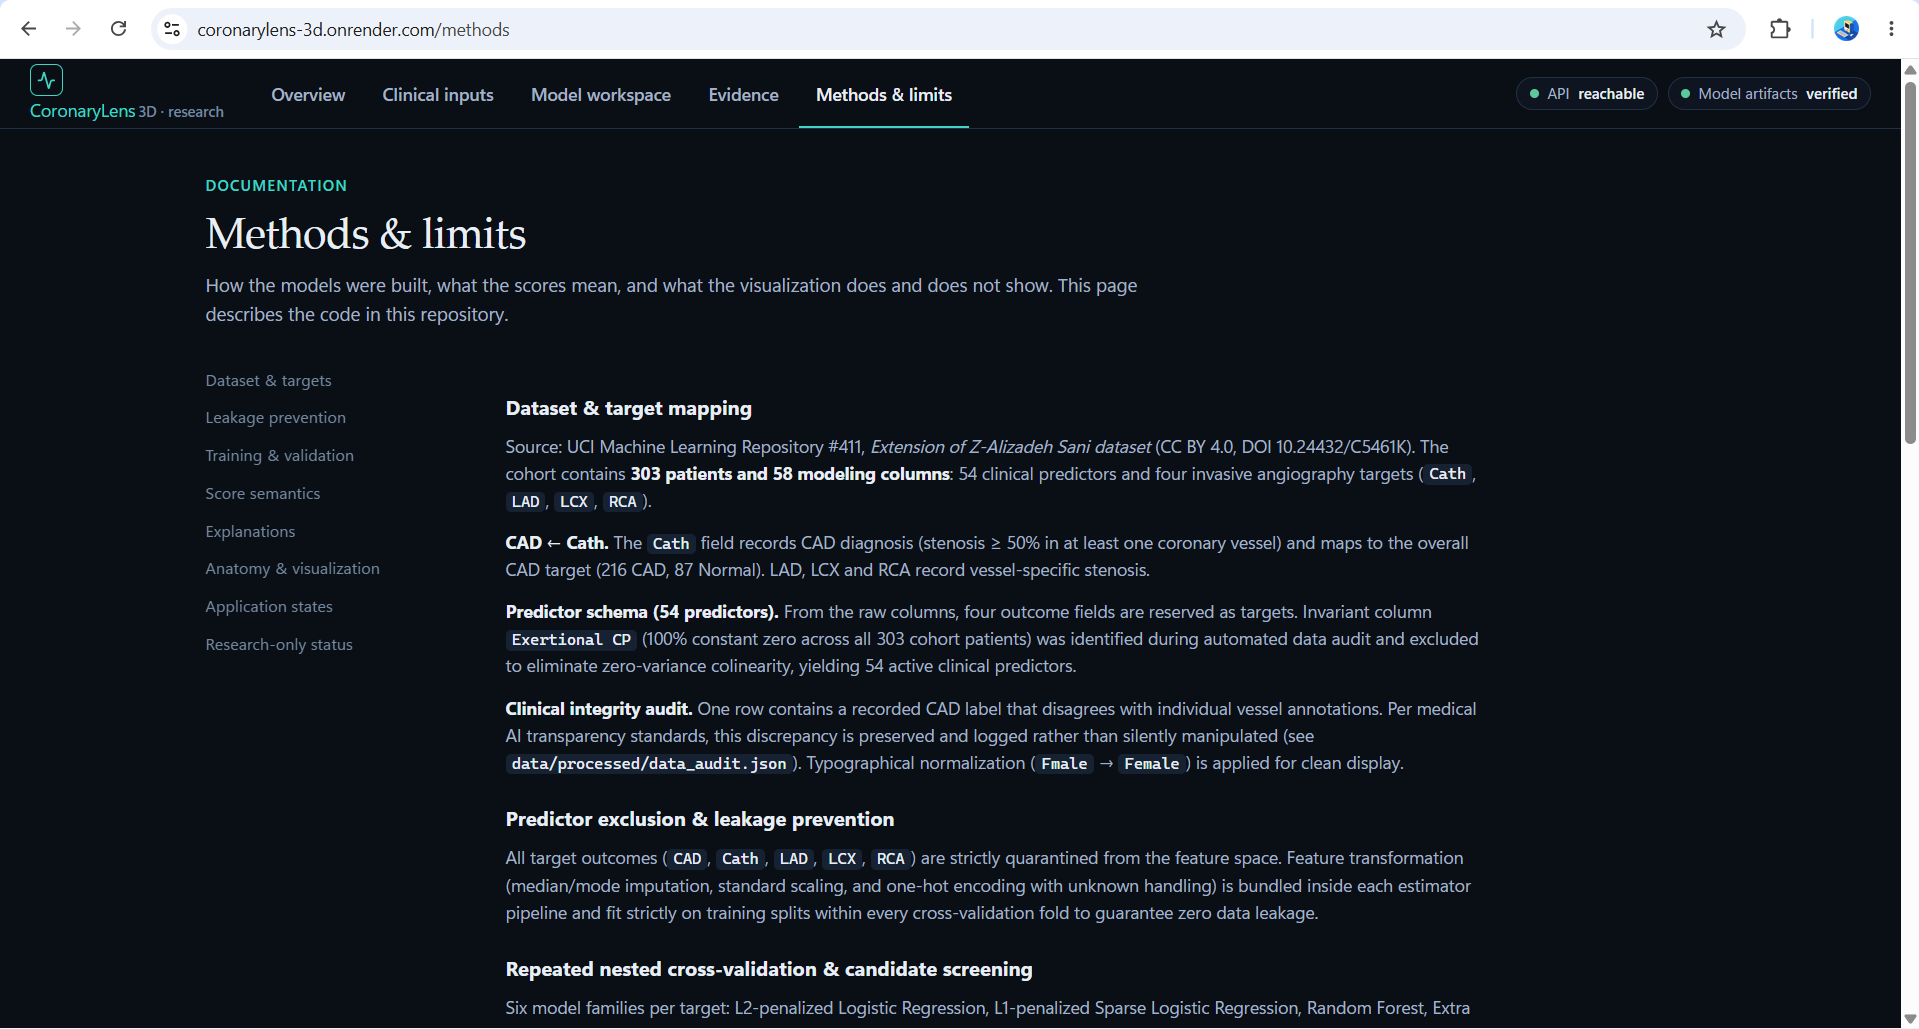
Dataset mapping, leakage prevention, and nested cross-validation document our 54 predictors, four targets, and training protocol.
Inspiration
Machine-learning models can produce a cardiovascular prediction, but a number alone does not explain how the model arrived at that result or how its output relates to coronary anatomy.
We built CoronaryLens 3D around a simple idea: bring cardiovascular prediction, anatomical visualization and model explainability into one interactive research workspace. Instead of viewing isolated scores, users can explore four distinct model outputs alongside a rotatable 3D heart and inspect the clinical features influencing an individual prediction.
Our goal is to make cardiovascular AI research more understandable, interactive and transparent.
What it does
CoronaryLens 3D is an interactive cardiovascular research application that evaluates four separate classification targets:
- CAD: Overall coronary artery disease status, mapped from the source dataset's
Cathlabel. - LAD: Stenosis status of the left anterior descending artery.
- LCX: Stenosis status of the left circumflex artery.
- RCA: Stenosis status of the right coronary artery.
Users can load a clearly labelled synthetic demonstration profile or enter clinical features covering demographics, symptoms, physical examination, ECG, laboratory measurements and echocardiography.
The application runs the corresponding prediction pipelines and presents their outputs in a 3D anatomical workspace. Users can rotate and inspect the heart, select named coronary arteries, explore model explanations and examine the evaluation evidence behind the prediction system.
Each target has its own model output. Overall CAD is treated as a cohort-level classification target rather than being painted onto an individual artery.
How we built it
CoronaryLens 3D combines a React and TypeScript frontend, a Node.js and Express API, a Python/scikit-learn machine-learning pipeline, and a Three.js/WebGL anatomical viewer.
The modeling workflow uses the Extension of the Z-Alizadeh Sani dataset from the UCI Machine Learning Repository. Its 303 retrospective records contain clinical predictors and coronary outcome labels.
The data pipeline separates permitted predictors from outcome columns, keeps preprocessing within the model pipelines, and evaluates candidate models using nested stratified cross-validation. The system also includes saved model artifacts, a model registry, schema validation, artifact-integrity checks and target-specific prediction handling.
For interpretability, the application provides feature-attribution explanations for individual predictions. The Evidence and Methods pages expose the evaluation methodology, model outputs, data limitations and the distinction between a research score and a clinical diagnosis.
The 3D scene uses a generic reference heart atlas derived from Z-Anatomy/BodyParts3D. Vessel colors represent the corresponding model outputs; they do not identify a patient's actual lesion location.
What makes it different
CoronaryLens 3D connects several components that are often presented separately:
- Four independently modeled cardiovascular classification targets.
- An interactive 3D coronary anatomy viewer with named vessel selection.
- Patient-specific model-behavior explanations.
- A dedicated evidence dashboard with target-wise performance metrics and confusion matrices.
- Explicit model-artifact, prediction-state and data-schema checks.
- Documentation of validation limitations and research-only use.
Rather than hiding uncertainty behind a single headline score, the application is designed to help users inspect what the model predicts, how it behaves and what the evidence does—and does not—establish.
Challenges we faced
One of the main challenges was working with a small, retrospective clinical dataset while avoiding misleading evaluation results. Outcome-related fields must not enter the predictor matrix, and preprocessing must be fitted appropriately within each training fold.
Another challenge was connecting the machine-learning outputs to the correct named objects in a 3D heart model. The anatomy is a generic reference atlas, so the visualization must remain a representation of model outputs rather than a claim about patient-specific lesions.
We also needed to keep the frontend, inference API, saved model artifacts and explanations consistent. Schema checks, explicit application states and artifact verification help prevent stale or unavailable results from being presented as valid predictions.
What we learned
We learned that an interactive medical-AI research tool requires more than a functioning classifier. Model evaluation, data provenance, explainability, visualization semantics and failure handling must all agree with one another.
We also learned to distinguish a model's prediction from a clinical finding. Even an informative 3D visualization cannot establish an actual coronary blockage without the appropriate patient-specific evidence.
What's next
Future work includes broader external validation, additional explanation-stability analysis, continued evaluation of probability calibration and operating thresholds, expanded automated browser testing, and further improvements to inference efficiency.
CoronaryLens 3D is a research and educational prototype. It is not clinically validated and is not intended to diagnose disease or guide treatment.
Built With
- express.js
- node.js
- numpy
- pandas
- python
- react
- scikit-learn
- shap
- three.js
- typescript
- uci-machine-learning
- uci-machine-learning-repository
- vite
- webgl


Log in or sign up for Devpost to join the conversation.