-
-
-
-
-
-
-
-
Architecture
Inspiration
Risk models for coronary artery disease often output one number for "CAD" and separate numbers for each artery. We noticed that these numbers can disagree: in our tests, separate models put the overall CAD risk below a single artery's risk for 5–32% of patients, which is impossible (for the strong ensemble, by up to 18 percentage points). We wanted a model whose numbers always fit together, shown on a real 3D heart.
What it does
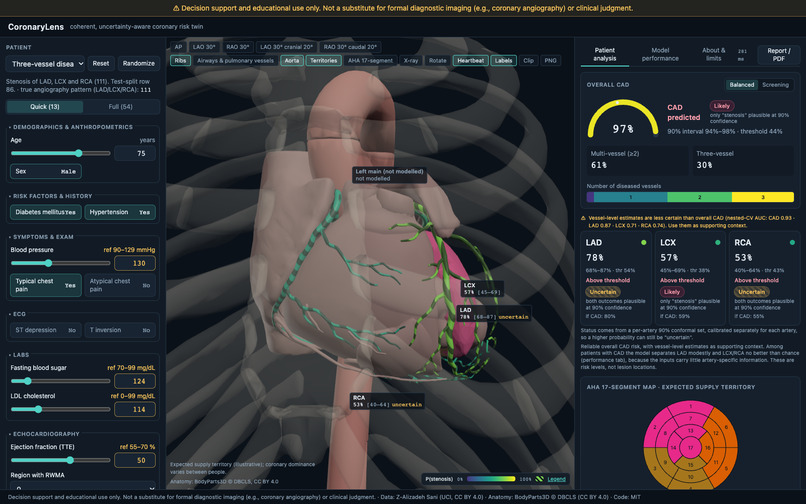
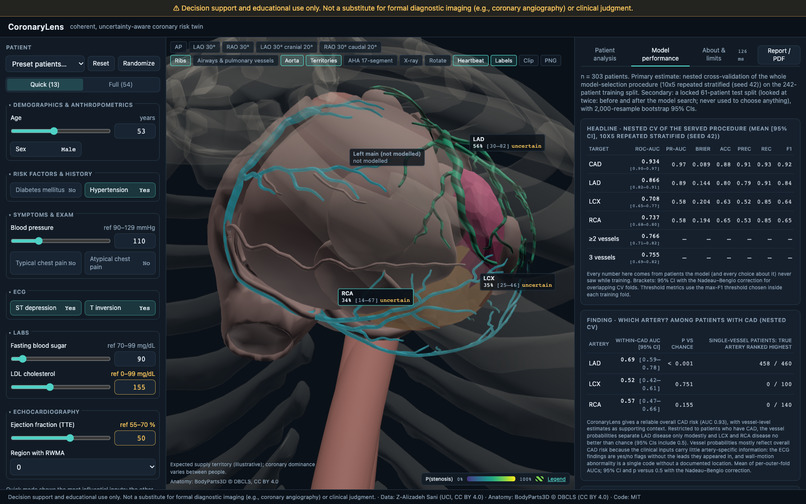
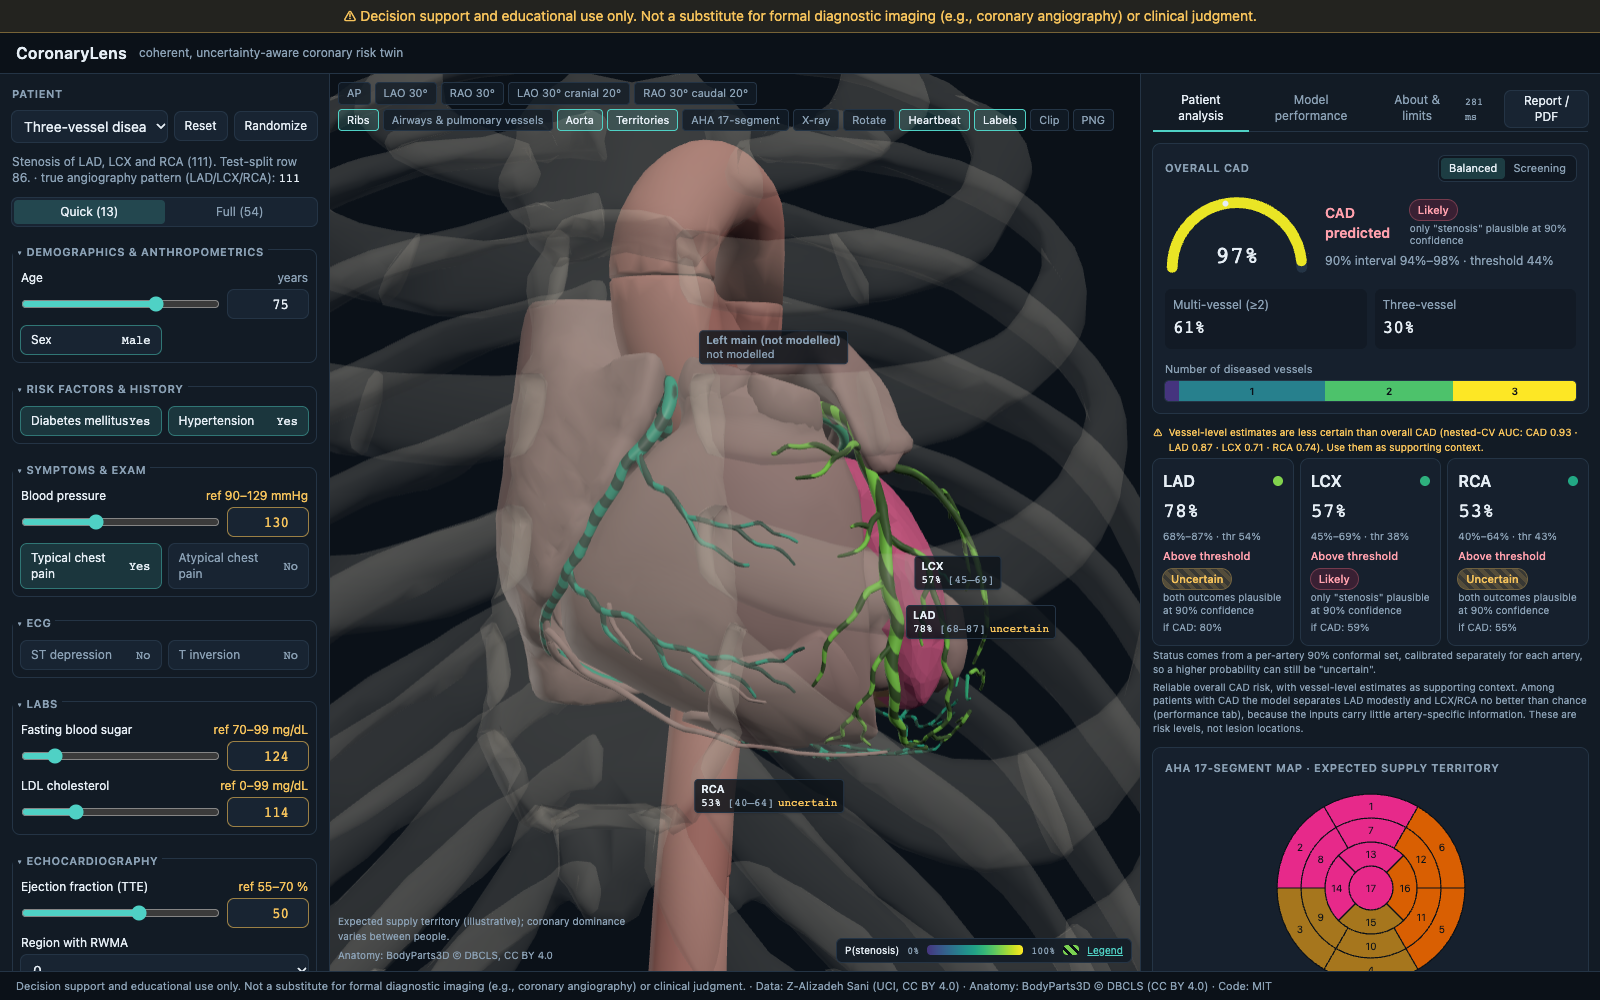
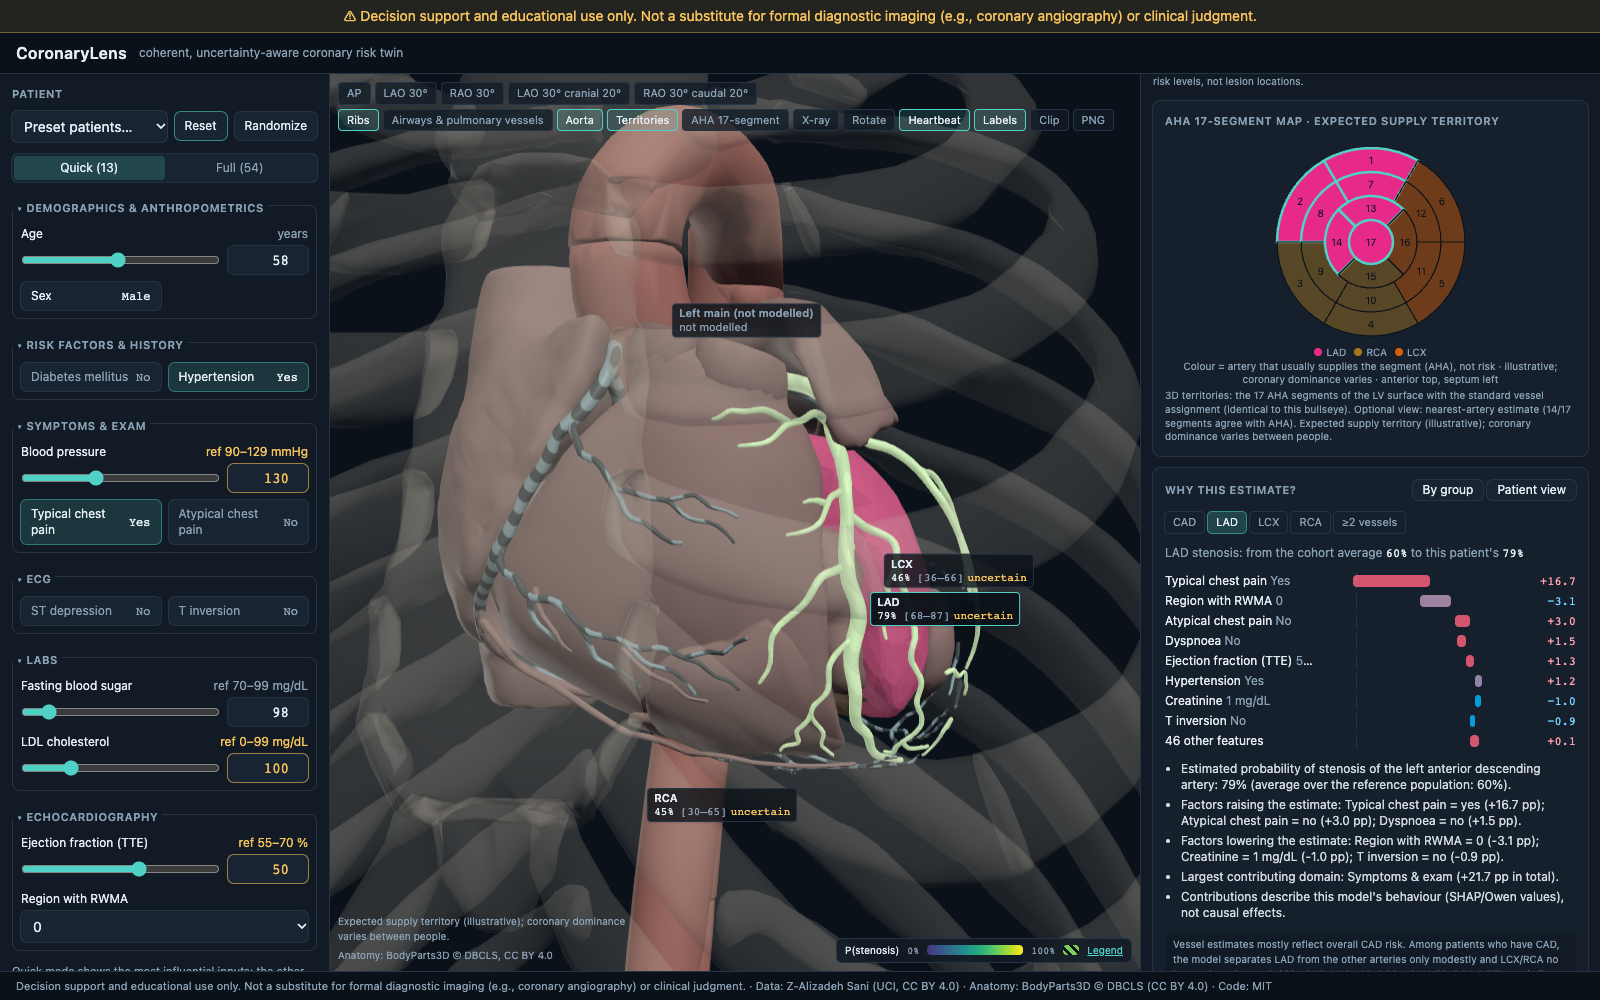
- Takes 54 clinical, ECG, laboratory and echo findings (or one of 7 preset patients) and estimates the probability of CAD and of stenosis in the LAD, LCX and RCA, plus the chance of 2- or 3-vessel disease.
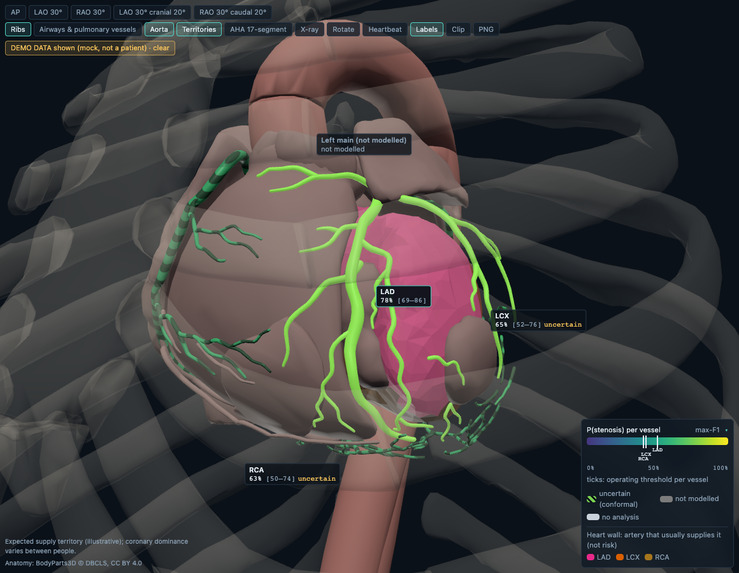
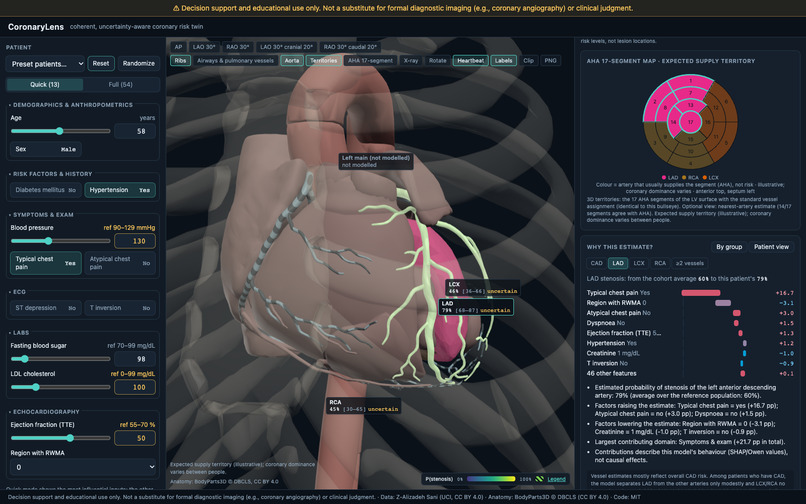
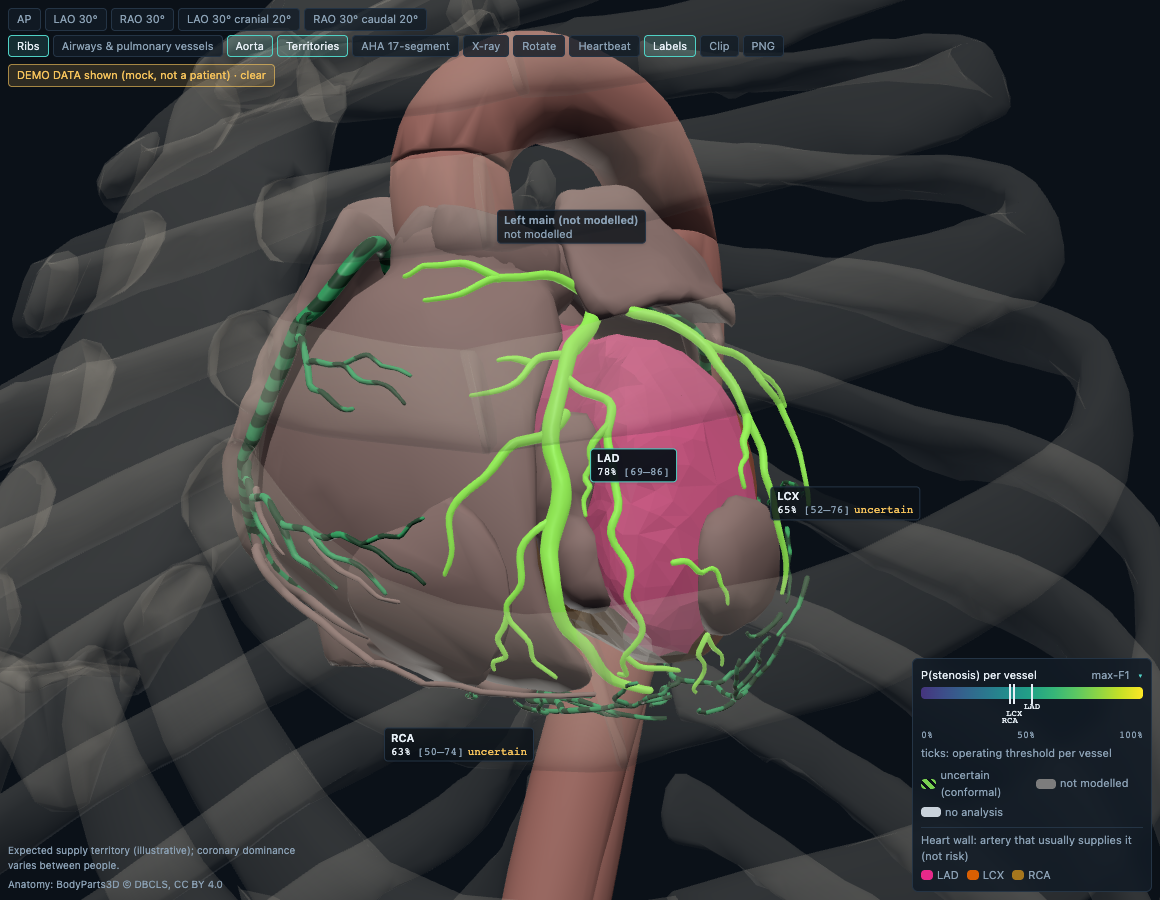
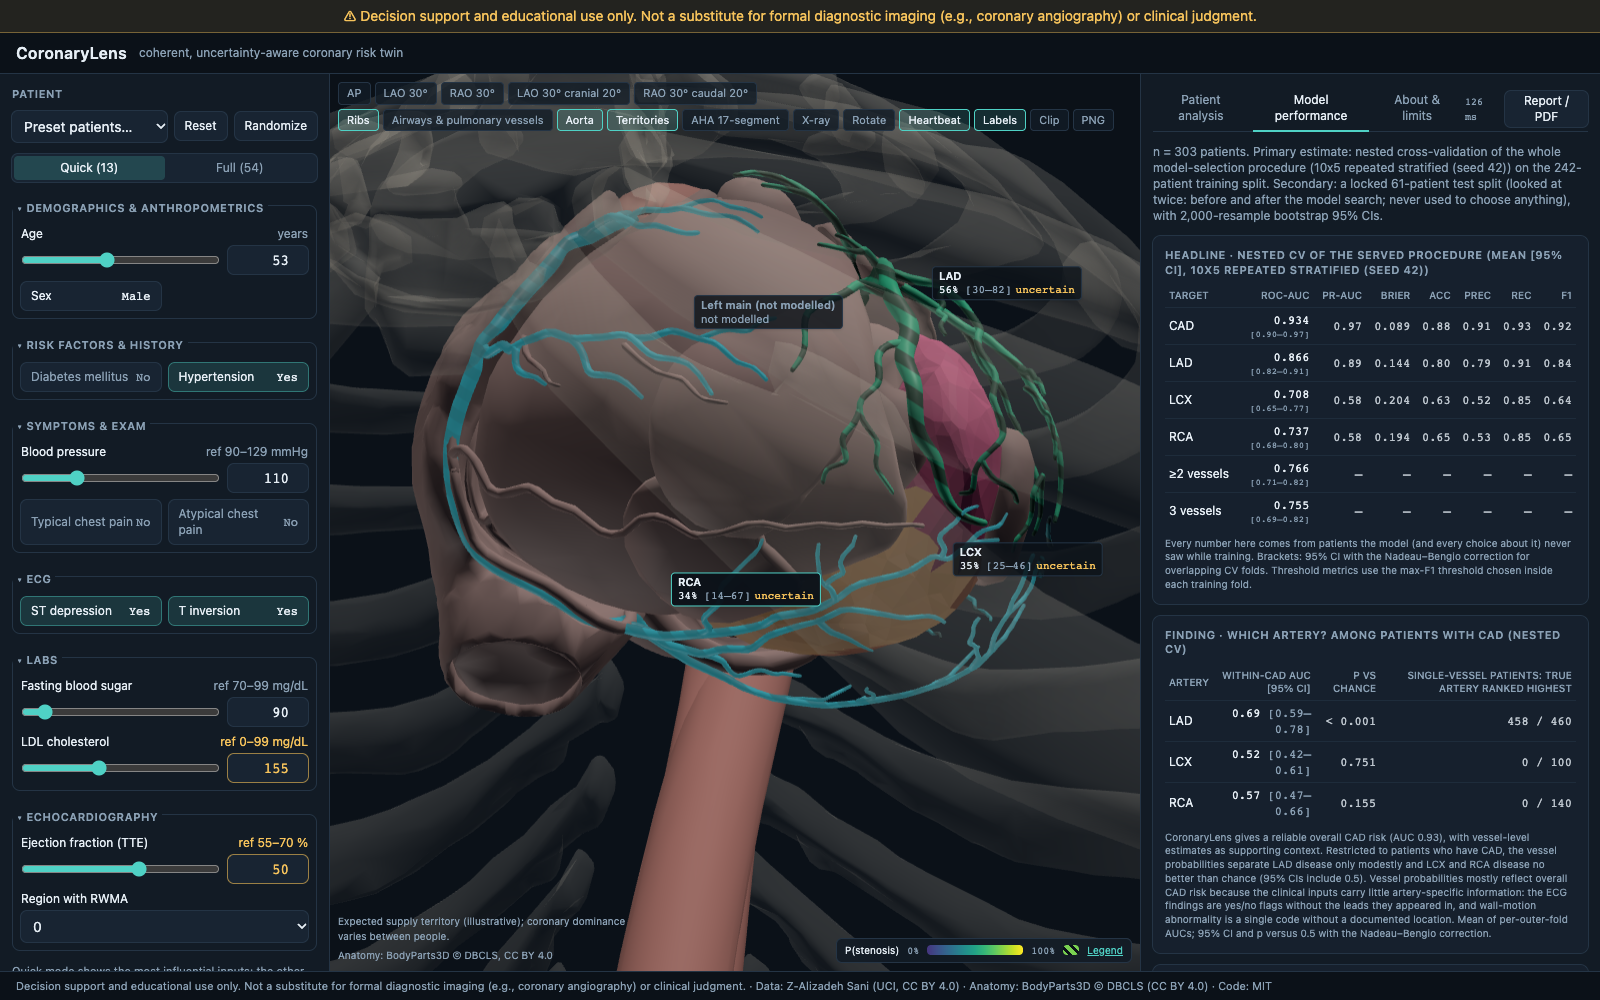
- Colours the three arteries on a real 3D heart (BodyParts3D) by their probability. Vessels where the data cannot decide get moving stripes. The left ventricle is split into the 17 standard AHA segments, synced with a 2D bullseye.
- Click any artery to see why: SHAP contributions on exactly the displayed probability, every measurement beside its contribution, and plain-language sentences.
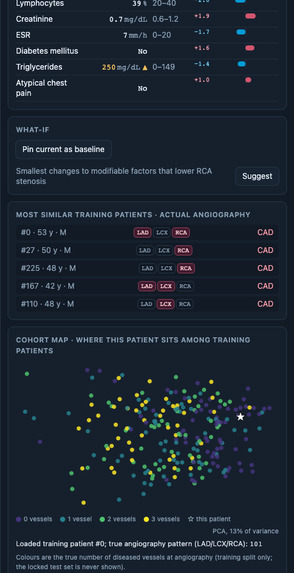
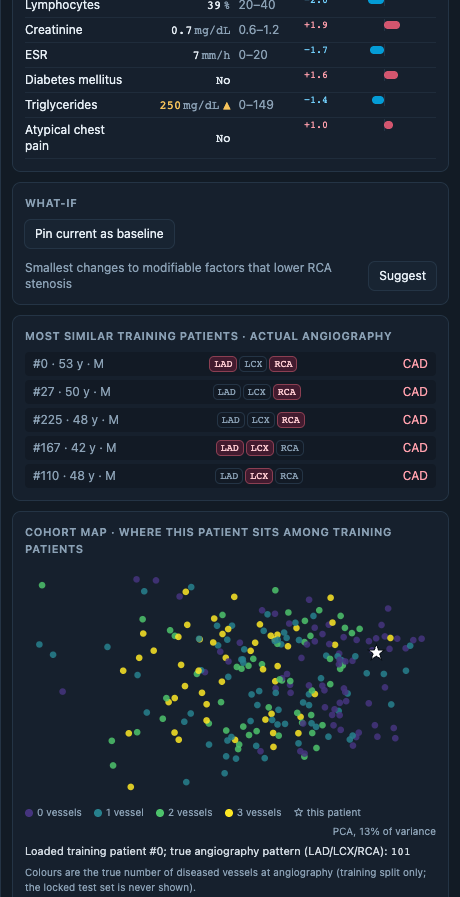
- Pin a patient and change any value to see every probability and colour update live. It also suggests the smallest changes to modifiable risk factors (model sensitivity, not advice), finds similar real patients with their true angiography, and warns when a patient is unlike the training data.
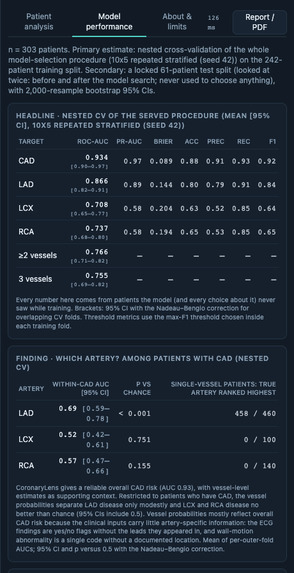
- A performance tab shows validation, calibration, decision curves, the model search and a leakage ablation.
How we built it
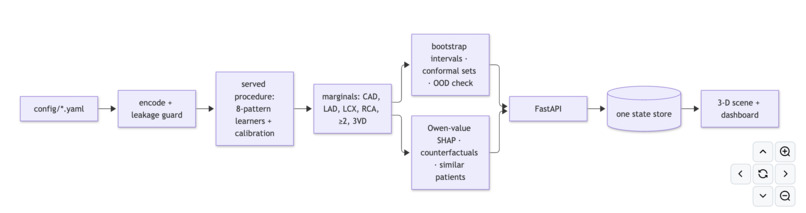
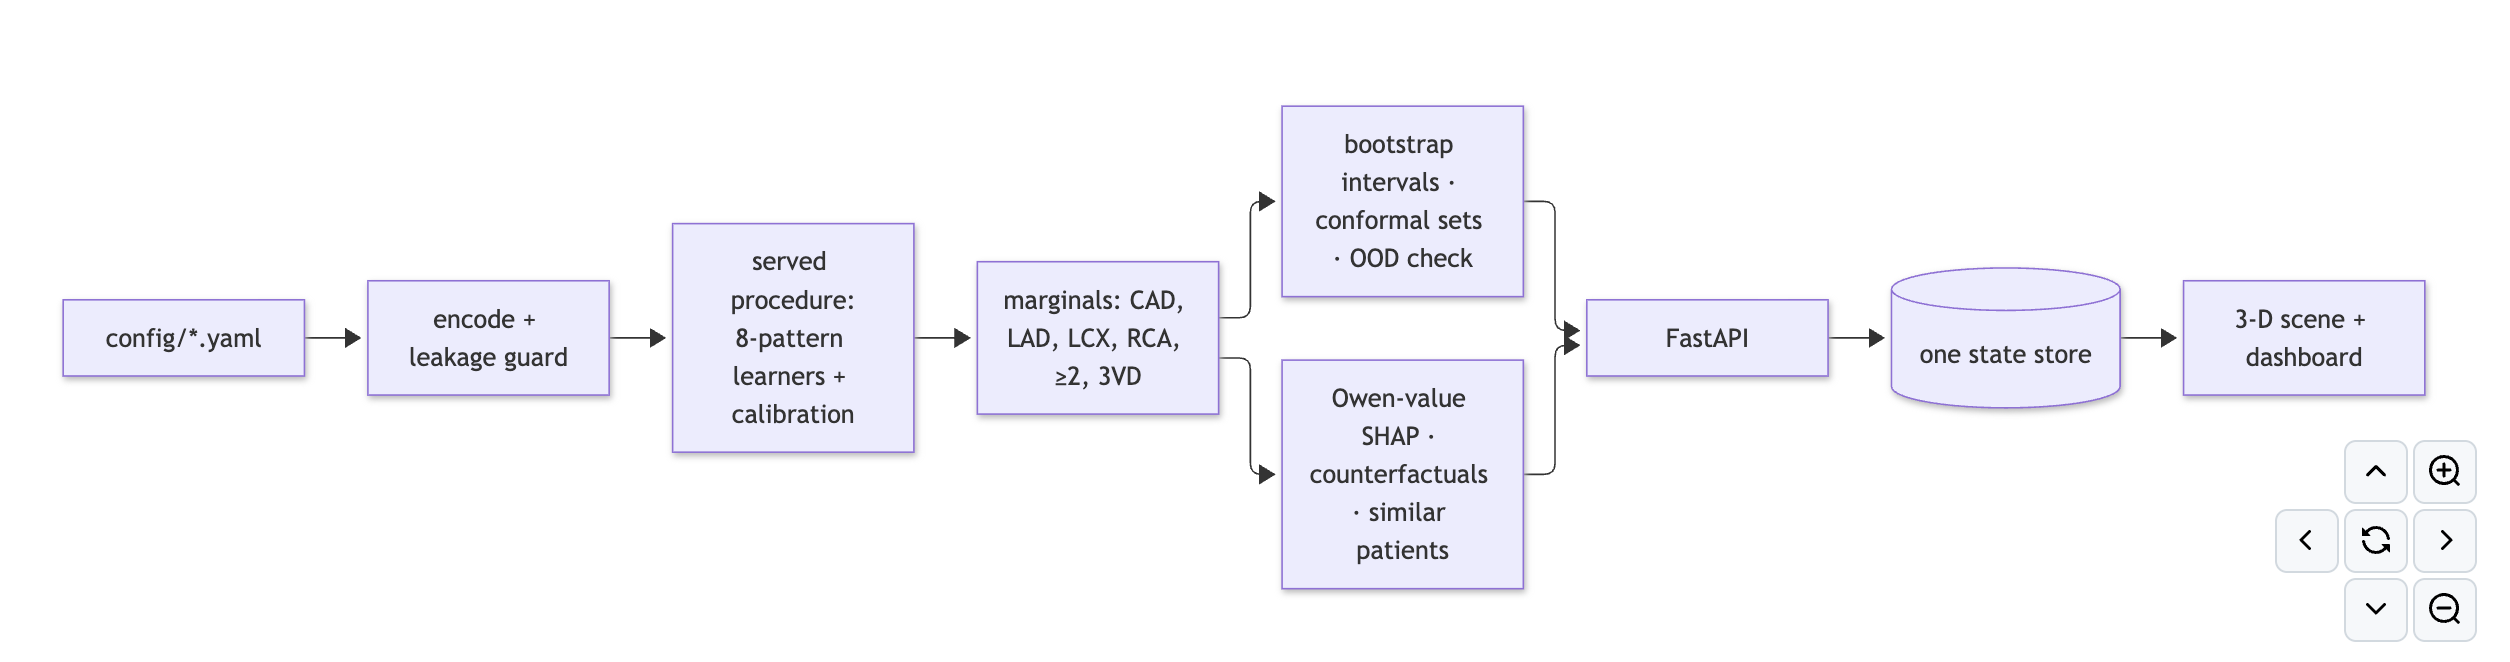
- Model: one model predicts all 8 possible LAD/LCX/RCA patterns, and every displayed number, including ≥2- and 3-vessel risk, is a sum of those 8 probabilities, so the numbers always fit together. Separate models put P(CAD) below a vessel's probability for 32.1% (naive logistic regression) to 5.4% (strong ensemble) of patients; ours for 0%.
- Validation: nested cross-validation with model selection inside every fold; 748 procedures screened on the training split; 10 finalists chosen by a rule written down before the second screening round's results were read; a 61-patient test set held out from the start; Nadeau–Bengio corrected statistics.
- Served model: CatBoost + CatBoost (depth 3) + SVM, averaged and calibrated, chosen by the validated selection procedure.
- Stack: Python, scikit-learn, CatBoost, FastAPI; React, TypeScript, React Three Fiber, Tailwind; Playwright and pytest; Docker. Explanations run in a separate worker process. An exact vectorised SVM probability routine keeps them fast.
Results (nested CV, served model)
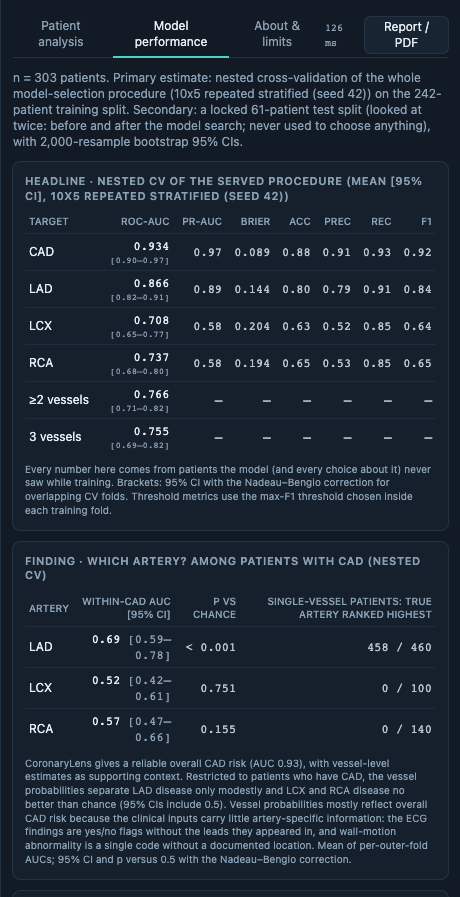
ROC-AUC: CAD 0.934 [0.896, 0.973] · LAD 0.866 [0.820, 0.911] · LCX 0.708 [0.647, 0.769] · RCA 0.737 [0.679, 0.796]. Locked test set (n = 61): CAD 0.898, LAD 0.829, LCX 0.761, RCA 0.661. Compared with a strong ensemble of separate models on the same folds, AUC is equal and log-loss and Brier score are significantly better (p = 0.0003 and 0.049). Live updates on a laptop CPU: colours 226 ms, explanation 360 ms (p95).
Challenges we ran into
- LCX and RCA are hard to predict from clinical data. We screened 748 approaches and their AUC stayed at 0.71–0.74. Among patients with CAD, the vessel probabilities separate LAD modestly and LCX/RCA no better than chance (within-CAD AUC LAD 0.69 [0.59–0.78], LCX 0.52 [0.42–0.61], RCA 0.5he clinical inputs carry little artery-specific information: the ECG findings are yes/noflags without the leads they appeared in, and wall-motion abnormality is a single code without a documented location. So CoronaryLens gives a reliable overall CAD risk, with vessel-level estimates as supporting context, and the app says so.
- Leakage is easy to fall into on this dataset. In our ablation, oversampling and feature selection on the full data raise CAD AUC from 0.930 to 0.968.
- Keeping explanations fast (p95 360 ms from slider to SHAP panel) while they are comyed output.
Accomplishments we're proud of
- A model that is coherent by construction and scores as well as the alternatives.
- Real anatomical mapping by FMA identifiers, and AHA segments in 3D that always match the bullseye.
- Every number in our docs is measured and reproducible (
make train; the test suites ru
What we learned
Validation design matters more than model choice on 303 patients. Correcting for overlapph gains are real. In our search only the calibration gain survived; the small AUC gains did not.
What's next
External validation on another centre, vessel-level imaging data, and a prospective evaluation of whether the visual explanation helps users understand risk.
Built With
- 3d
- catboost
- docker
- fastapi
- hugging-face
- playwright
- pytest
- python
- react
- react-three-fiber
- scikit-learn
- tailwindcss
- three.js
- typescript
- vite

Log in or sign up for Devpost to join the conversation.