-
-
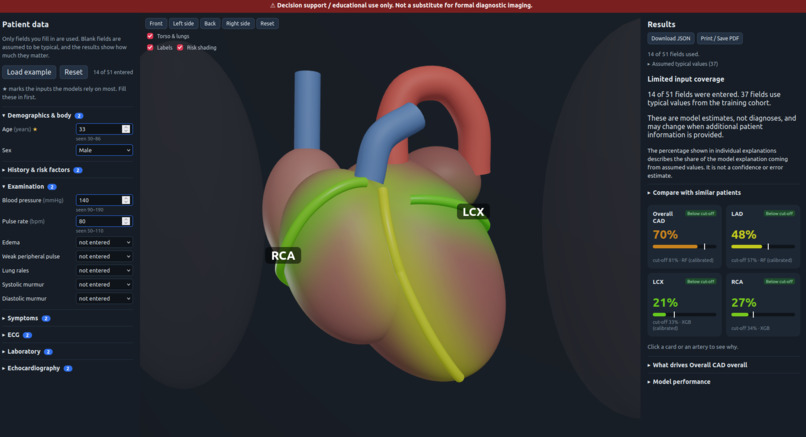
Interactive 3D heart visualization with model-estimated CAD and coronary-artery risk probabilities
-
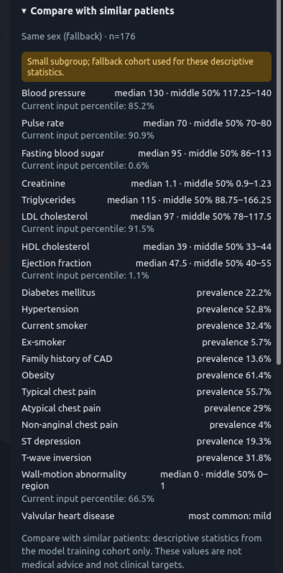
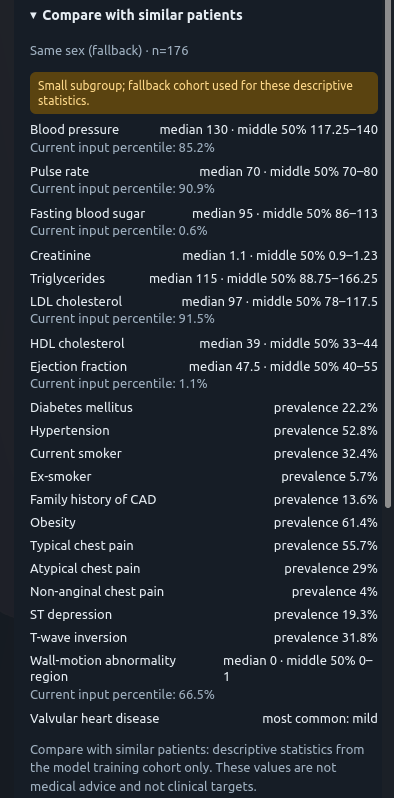
Comparison with other patients section
-
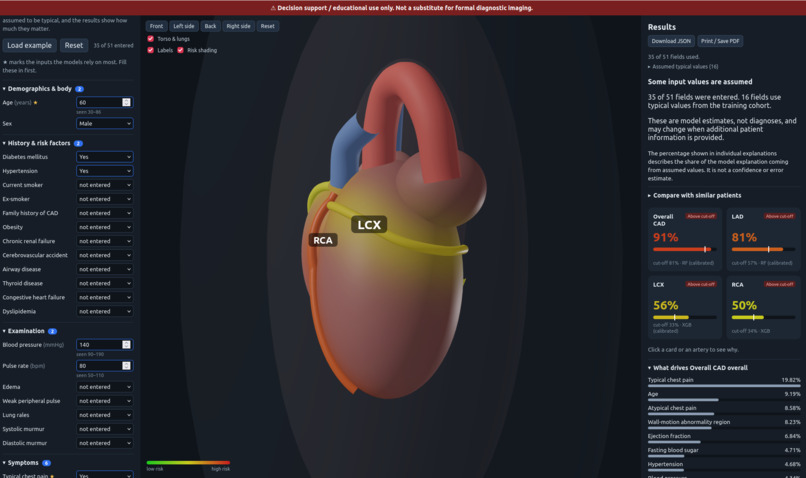
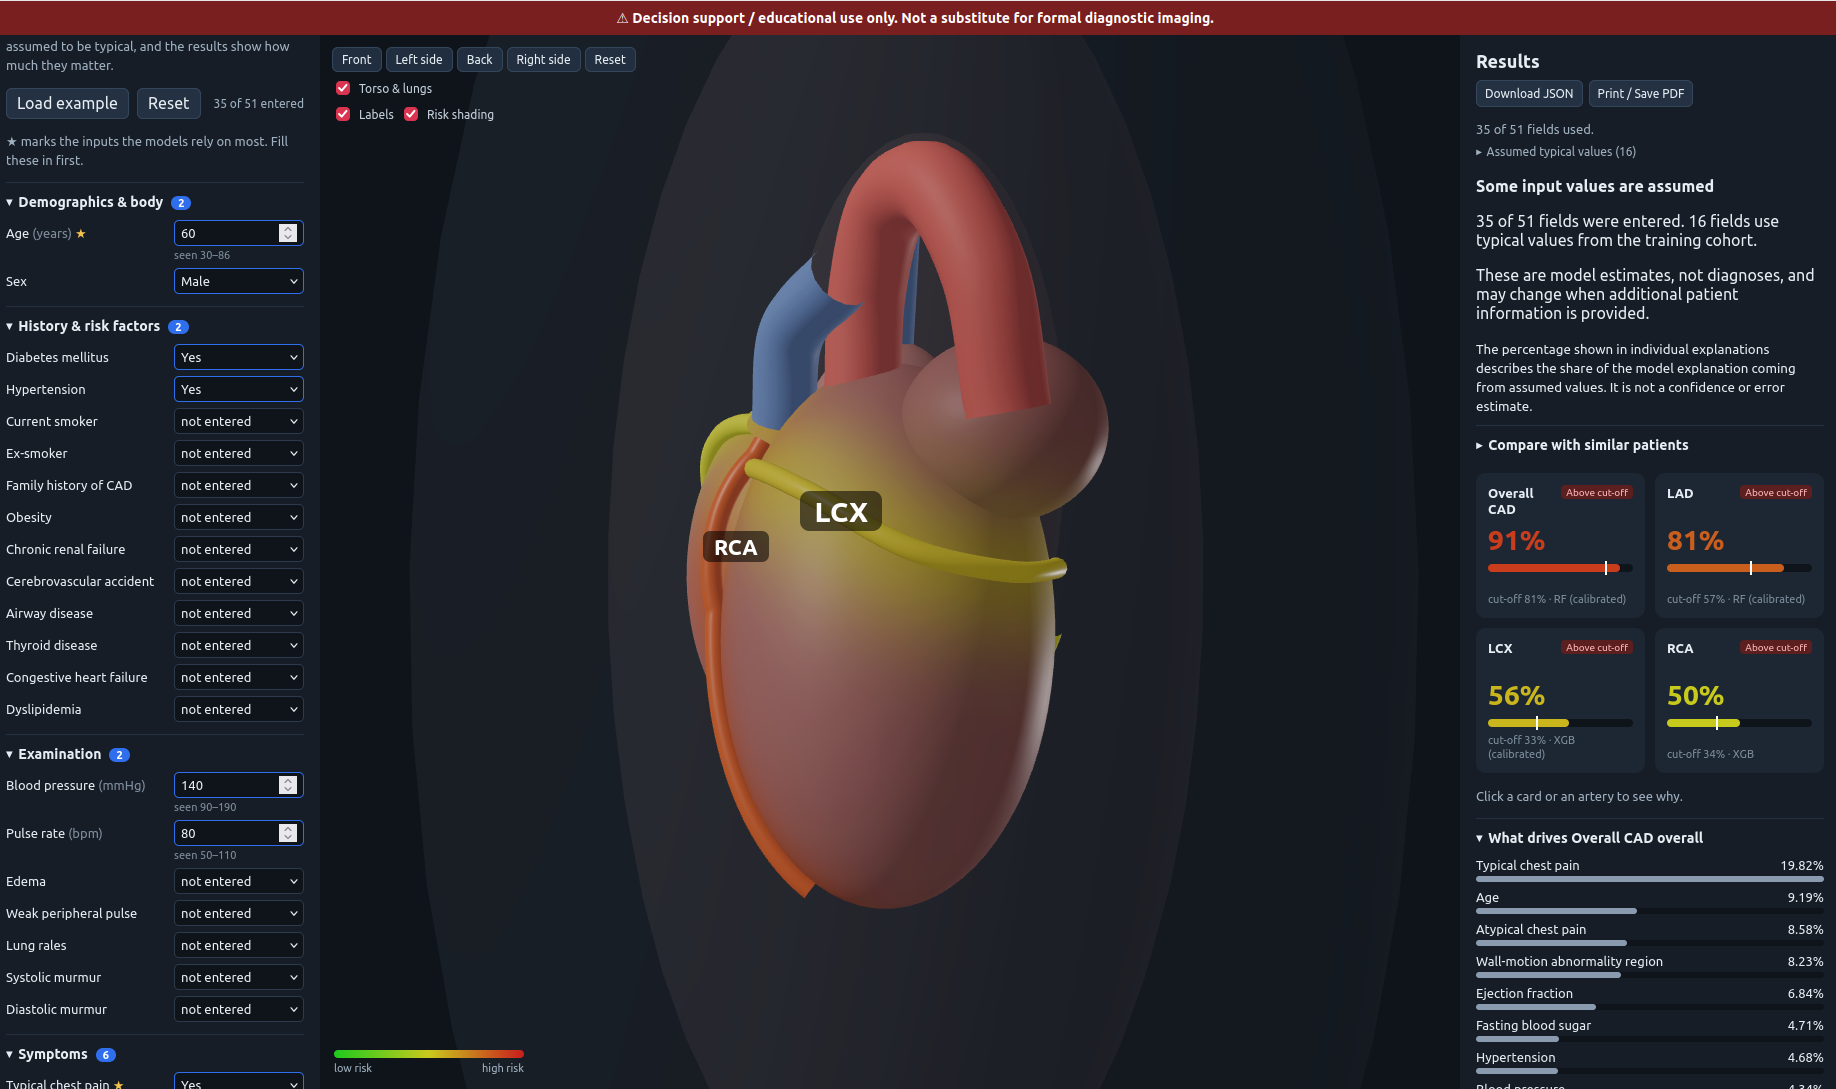
Side view
-
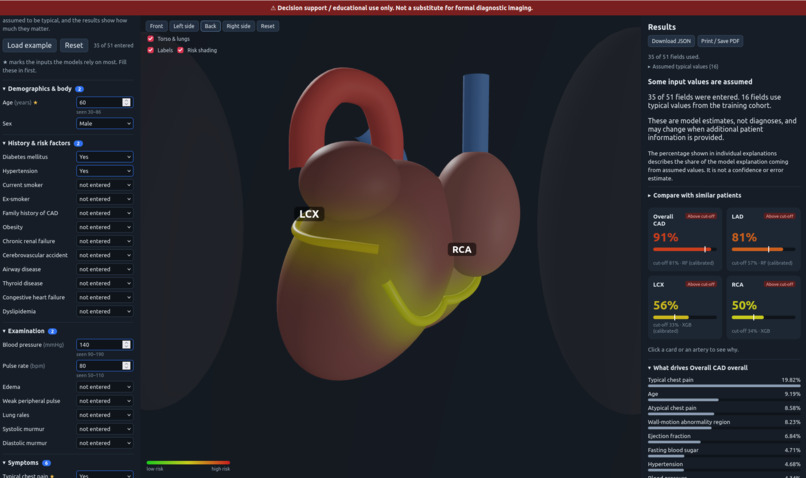
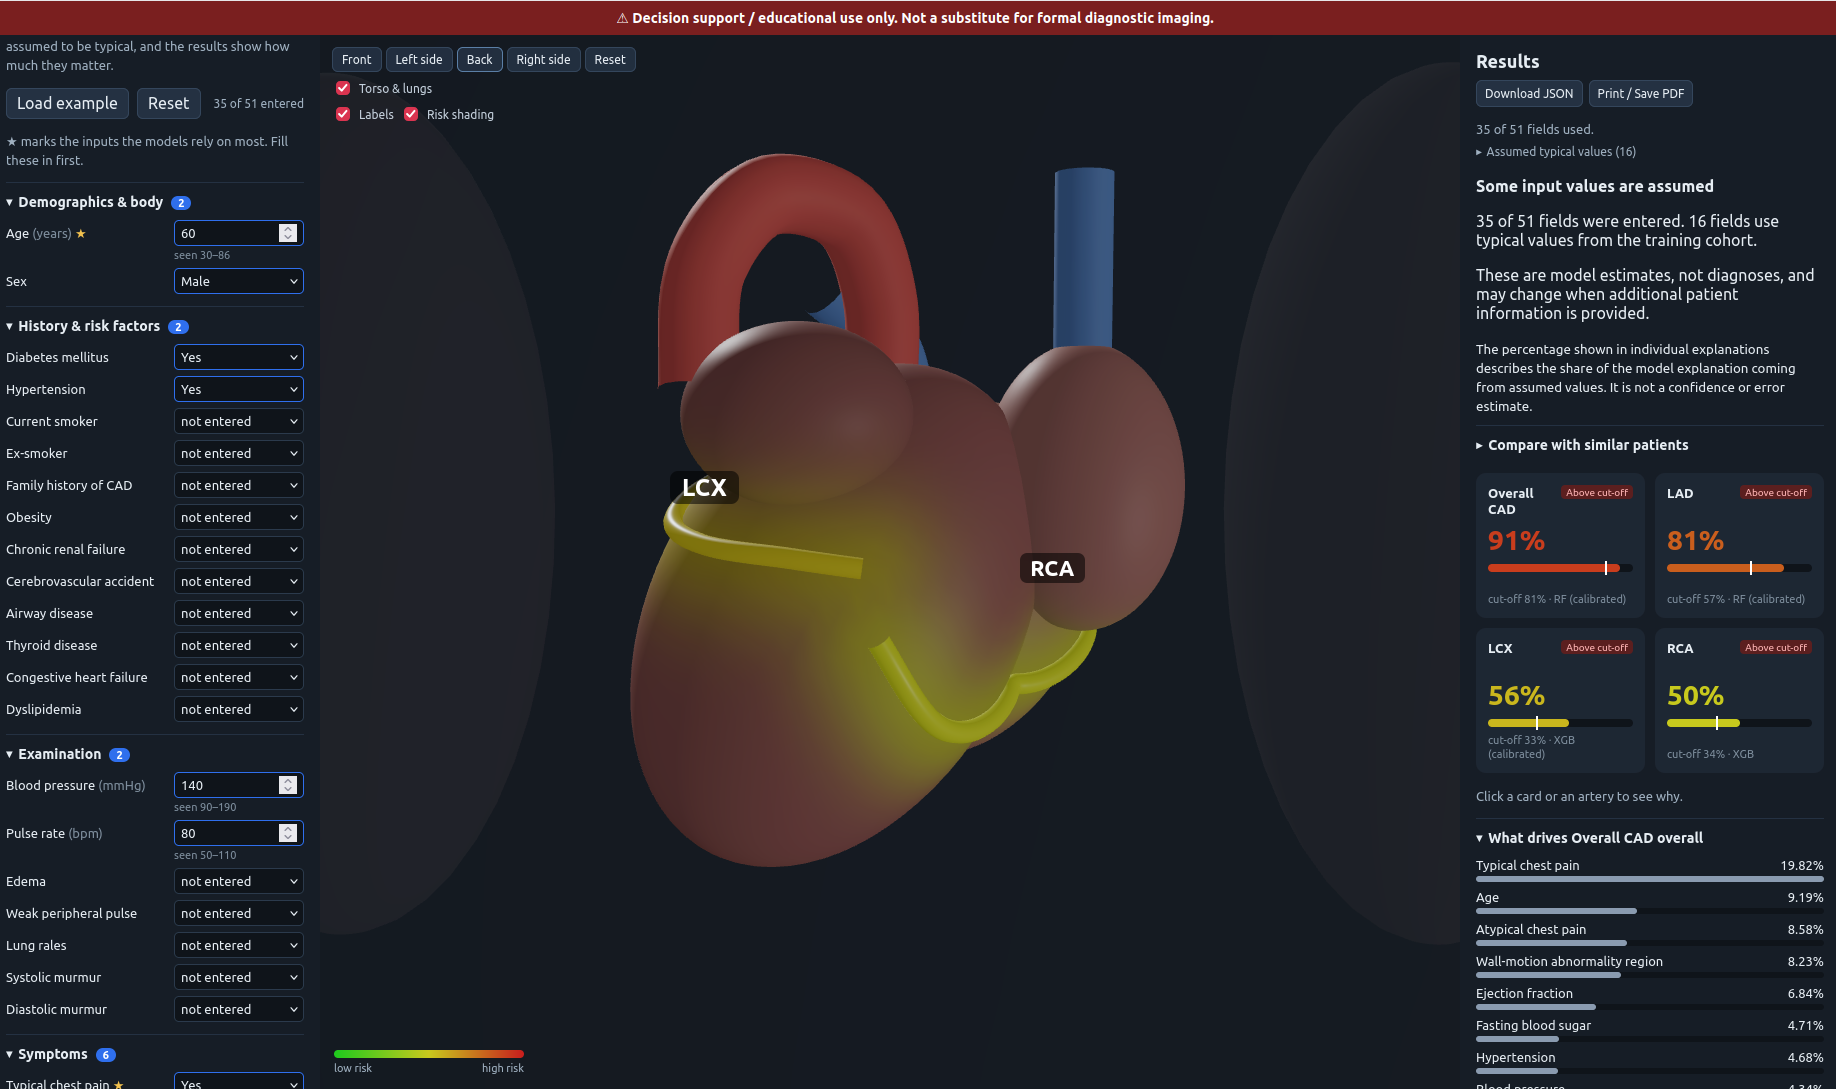
Rear view
-
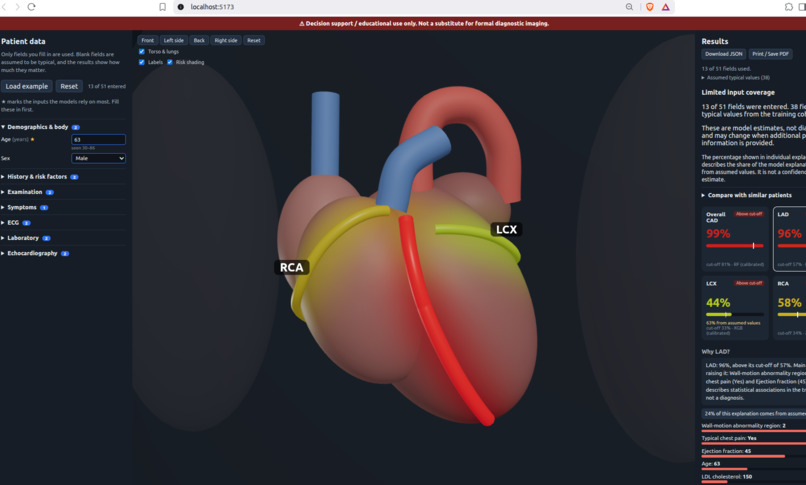
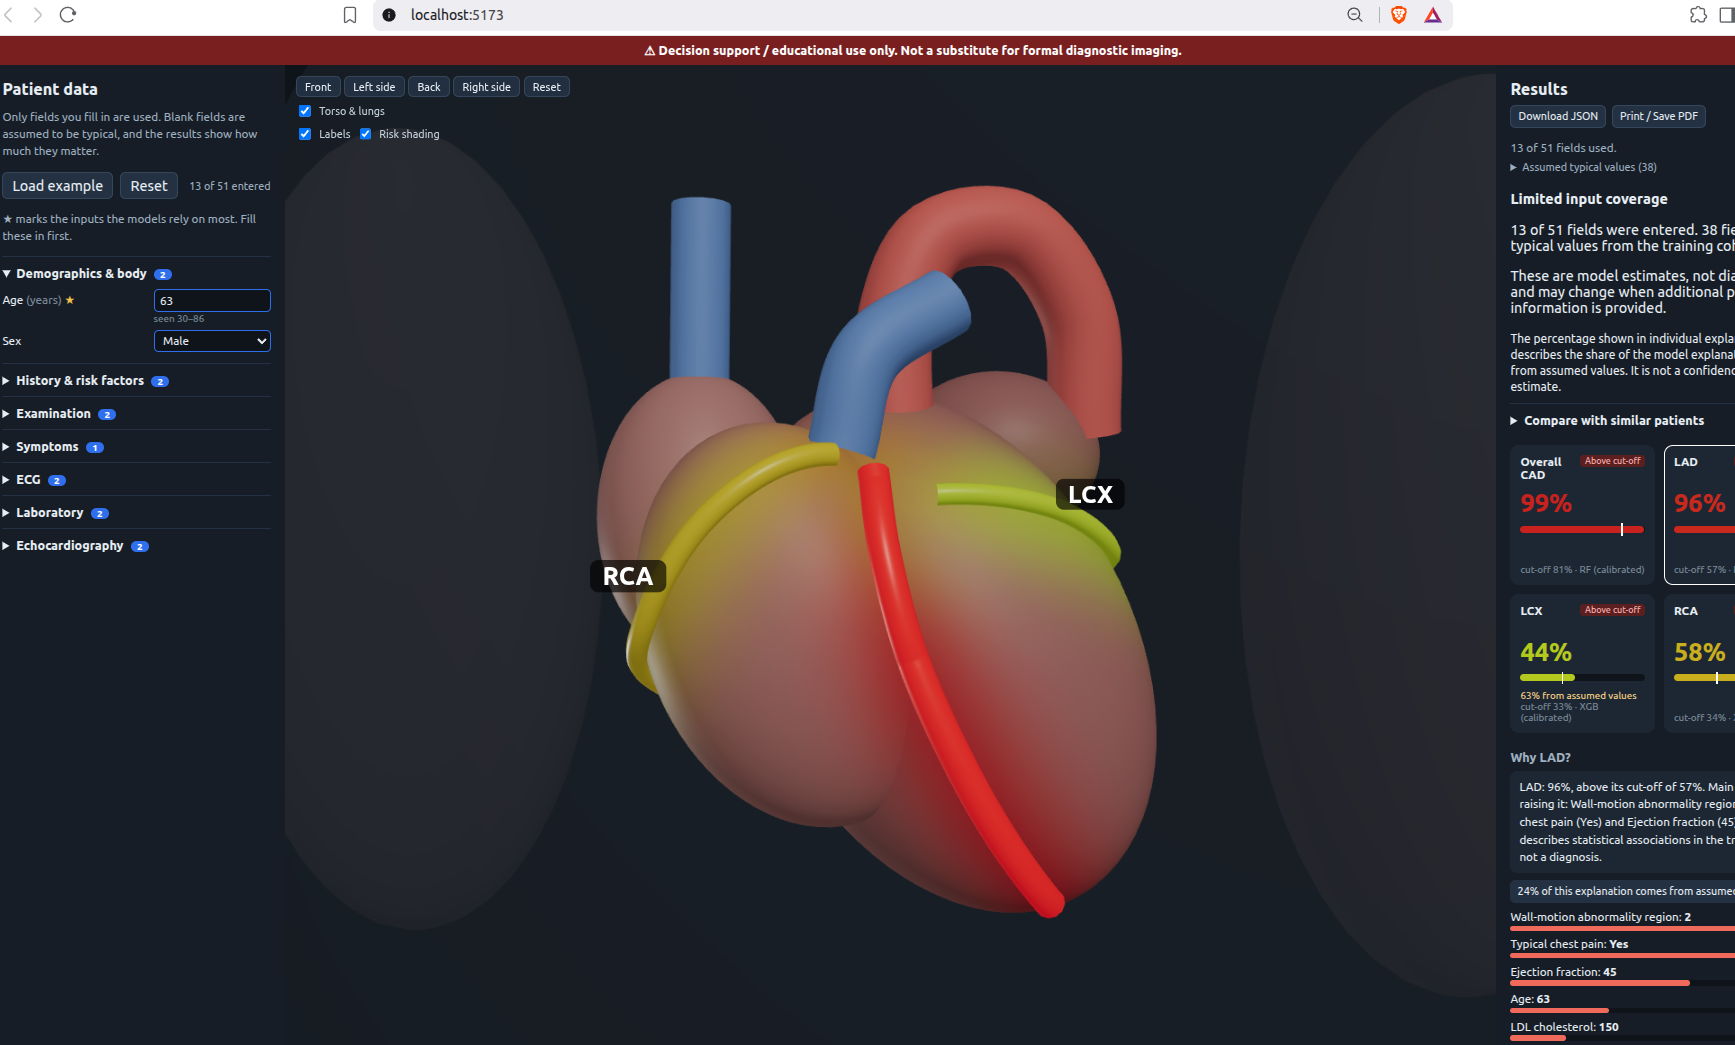
LAD(left anterior descending artery) for a 63 year old male)
-
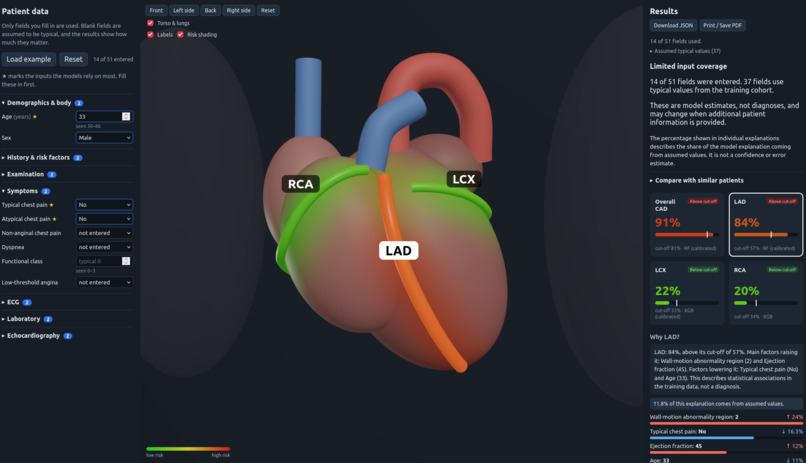
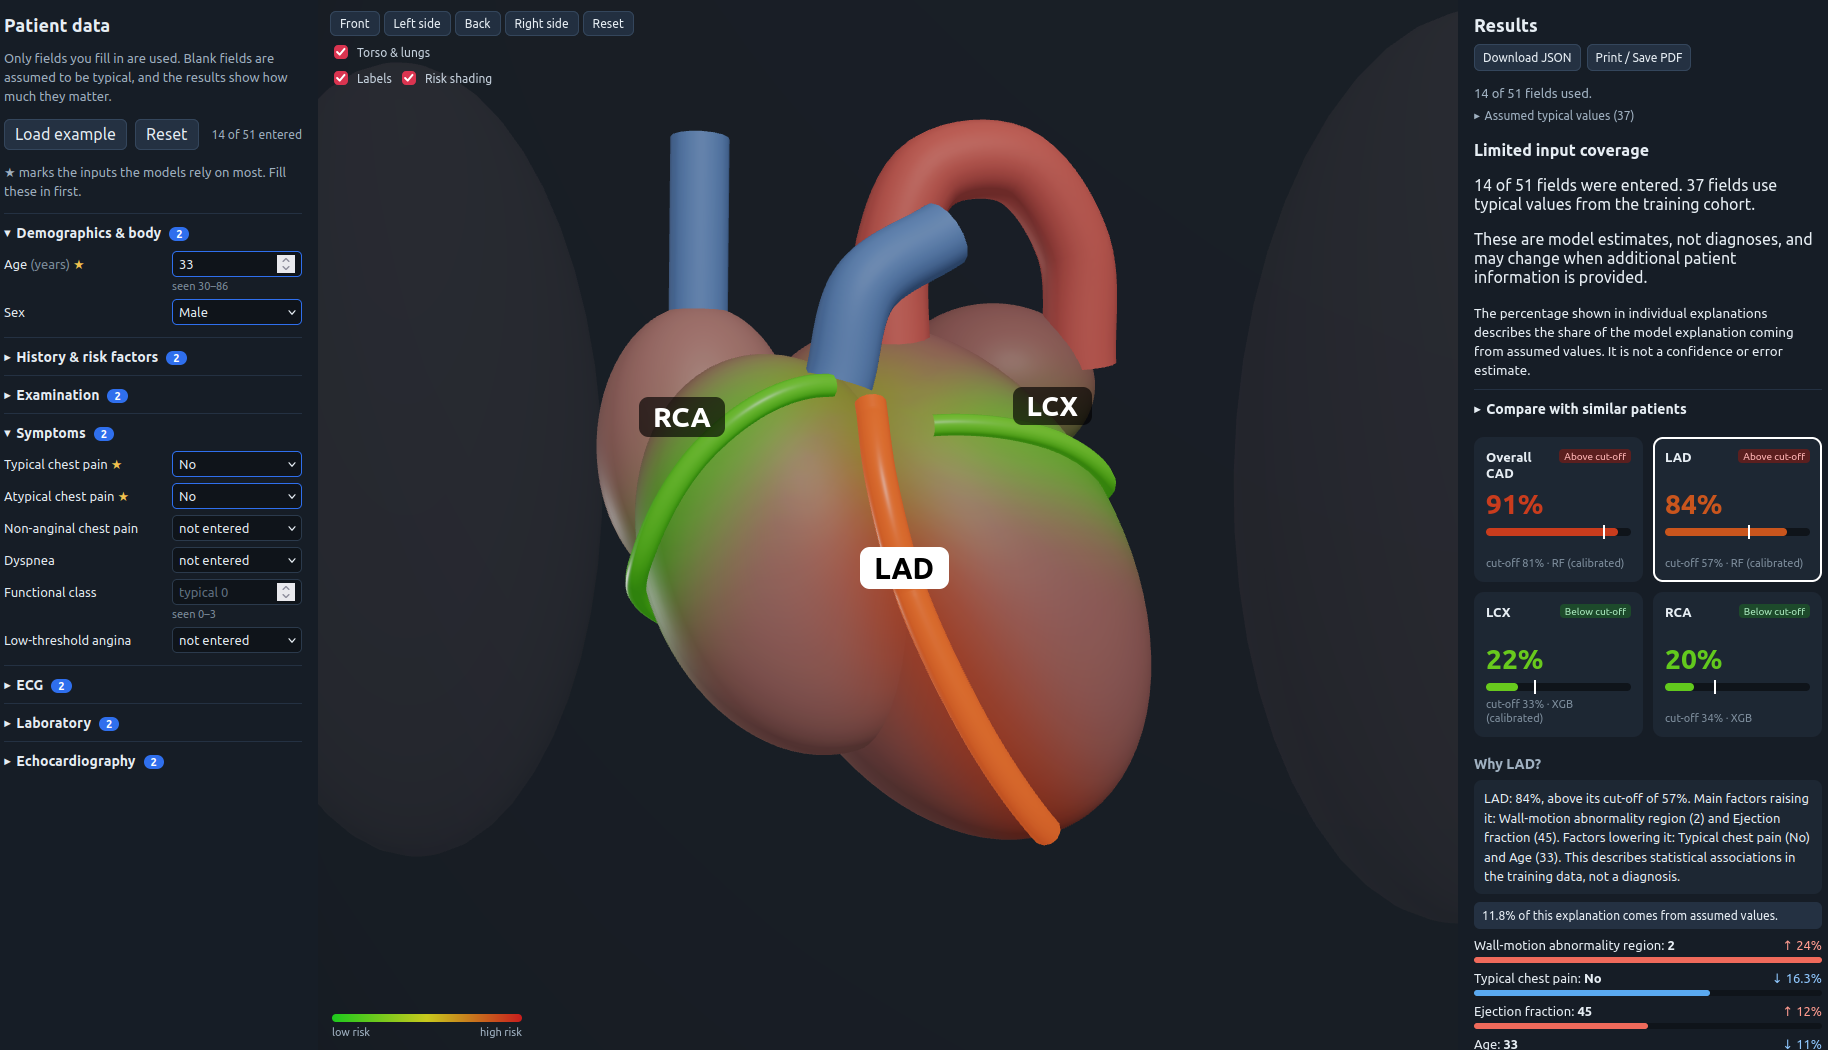
LAD for a 33 year old male, no typical or atypical chest pain
-
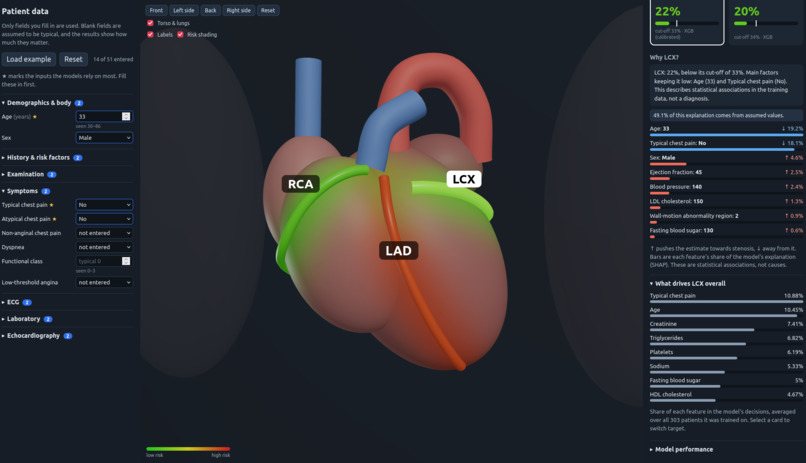
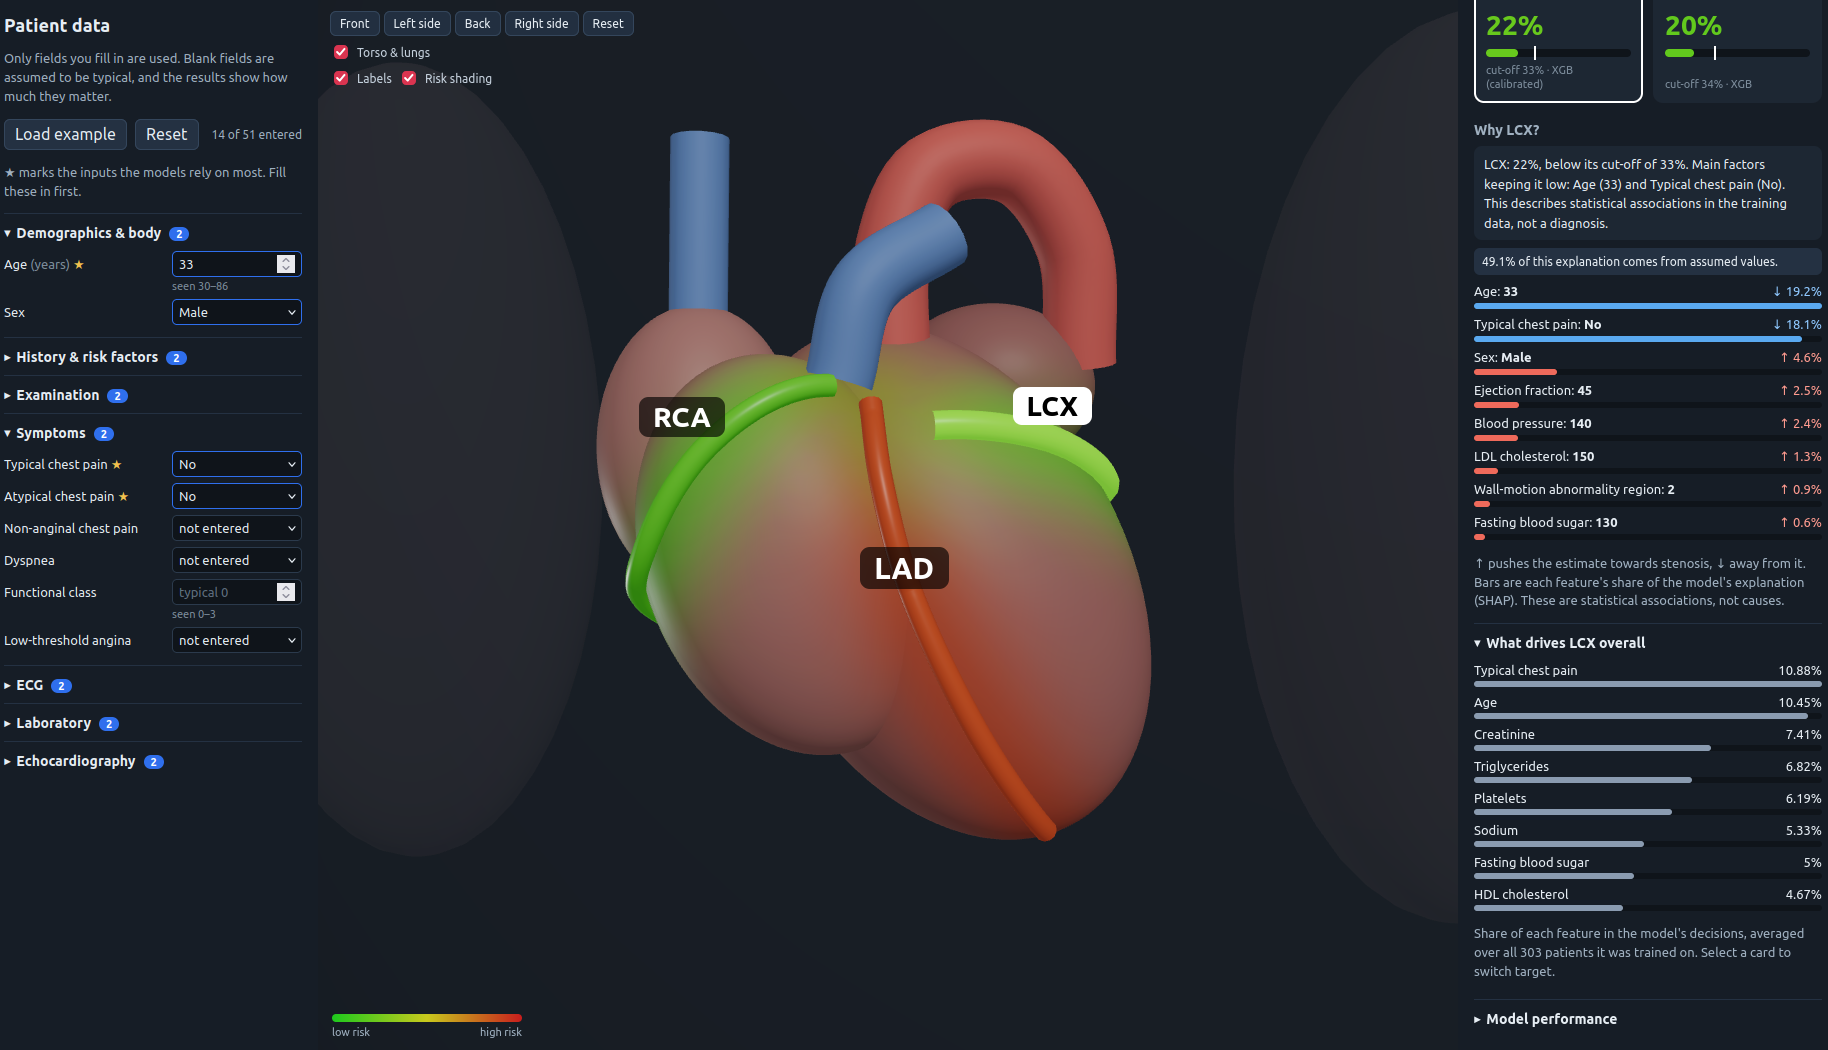
LCX(left circumflex) artery for a 33 year old man, no chest pain
-
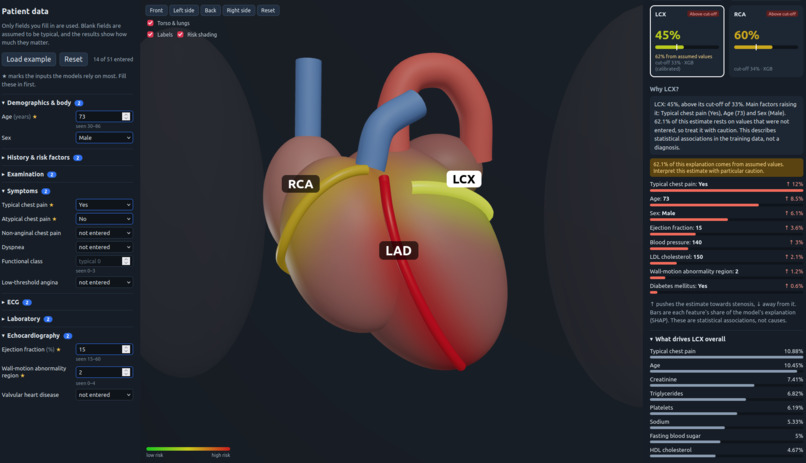
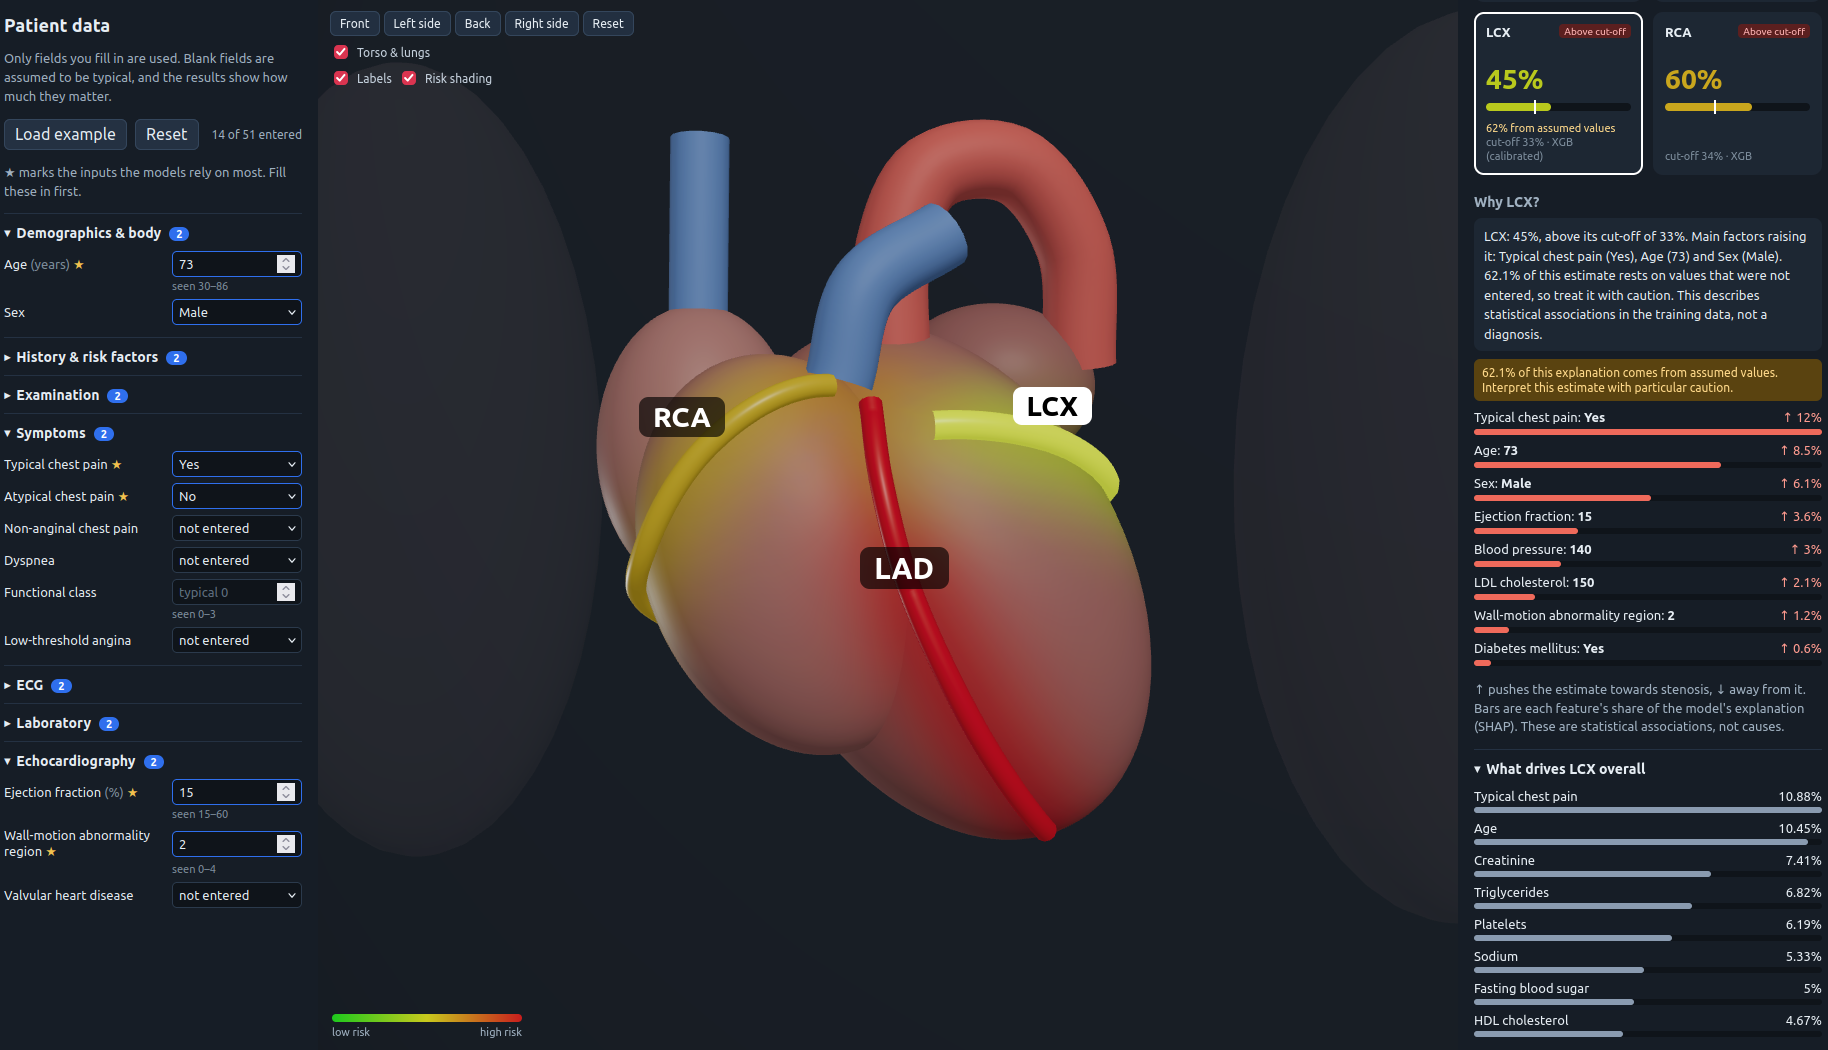
LCX of a 73 year old man with typical chest pains(45%)
-
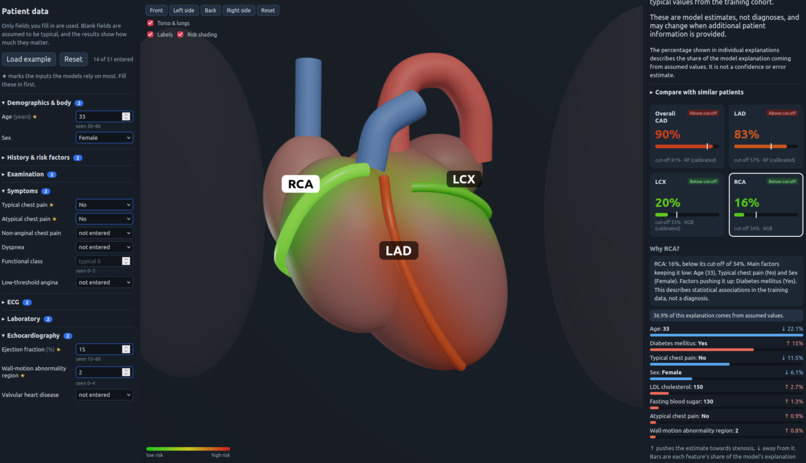
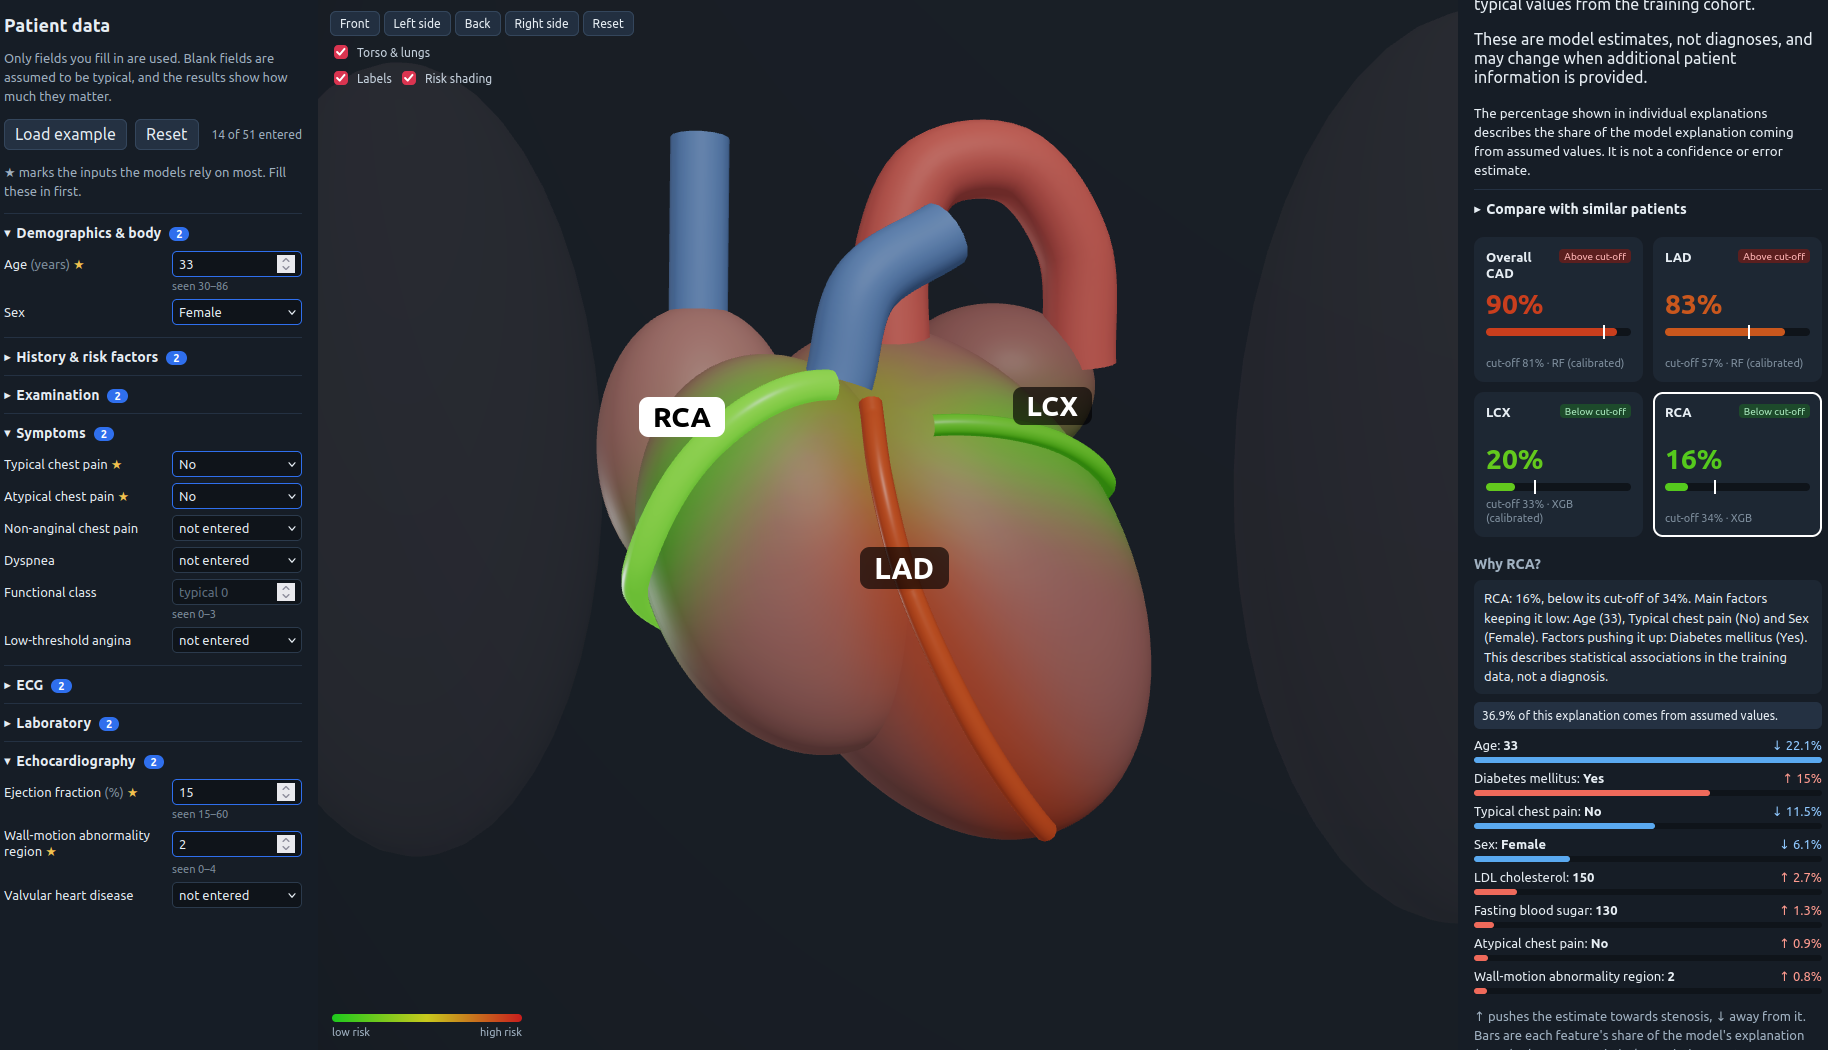
RCA(right coronary artery) of a 33 year old woman, no chest pains(20%)
-
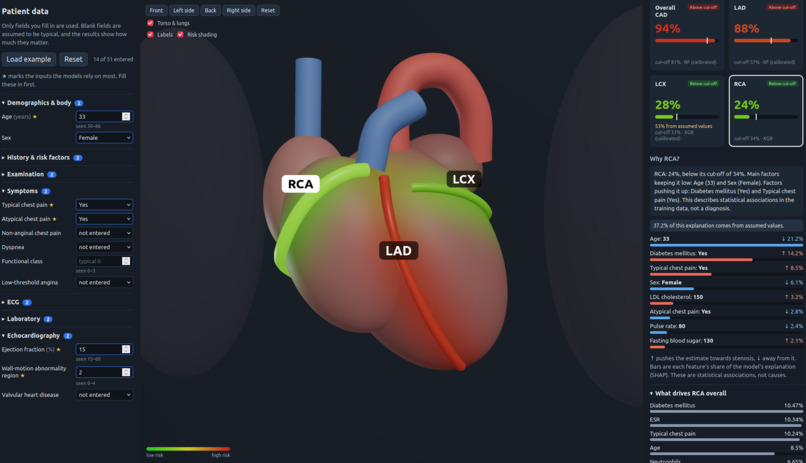
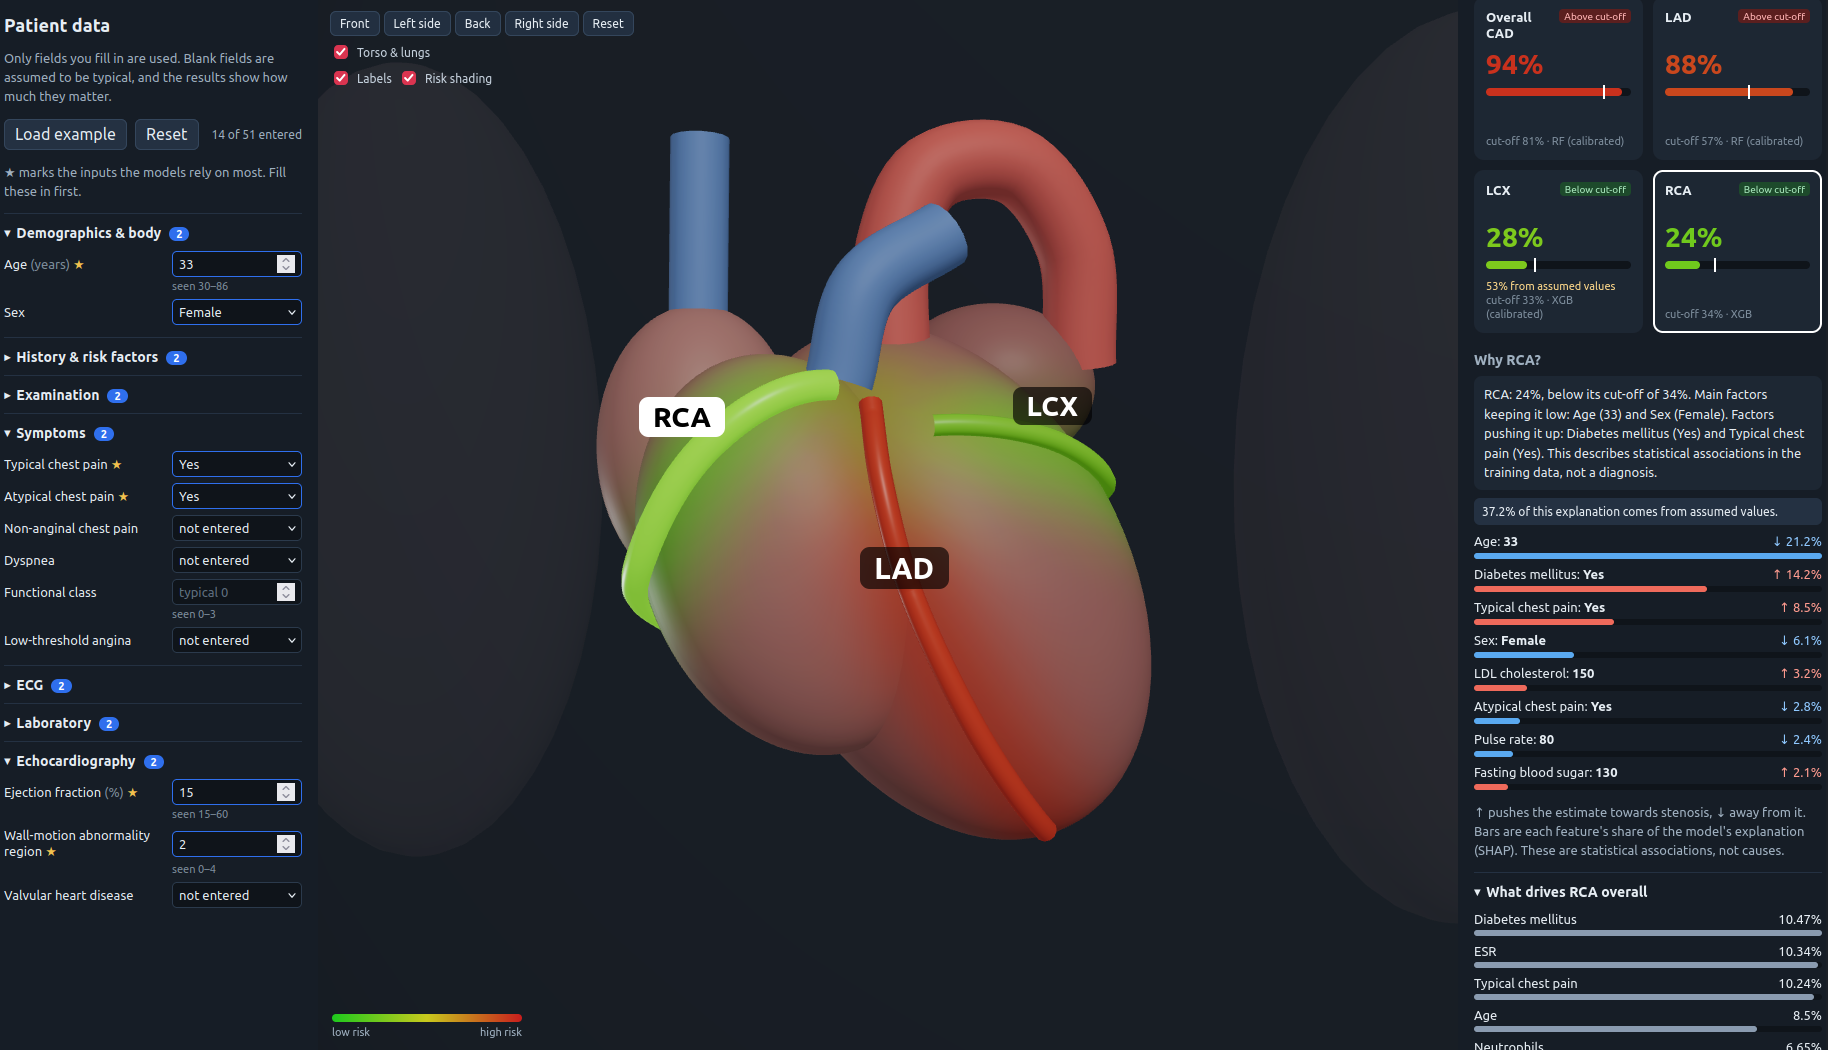
RCA of a 33 year old woman, both atypical and typical chest pains(24%)
Inspiration
Cardiovascular disease is one of the most important health challenges worldwide, but clinical information is often difficult to interpret when it is presented only as tables and numbers. I wanted to create a more intuitive way to explore cardiovascular risk by combining machine learning with an interactive 3D visualization of the heart.
My project, CoronaryCode, was built for Track A (cardiovascular risk 3D visualization). It was inspired by the idea that medical AI should not only produce a prediction, but also help users understand what the prediction represents anatomically. Instead of displaying a single risk score, the system maps predictions onto the major coronary arteries (LAD, LCX, and RCA) while also showing an overall coronary artery disease estimate.
What I Learned
During development, I learned how to build an end-to-end machine-learning application, including:
- Cleaning and preparing clinical datasets
- Converting medical features into model-ready numerical and categorical data
- Preventing target leakage during model training
- Training separate models for overall CAD and individual coronary arteries
- Comparing Random Forest, XGBoost, and logistic regression models
- Calibrating predicted probabilities
- Evaluating models using ROC-AUC, precision, recall, F1 score, and Brier score
- Connecting a Python inference service to an interactive JavaScript frontend
- Designing a user interface that communicates uncertainty and missing information clearly
The system represents each prediction as a probability:
$$P(\text{CAD} \mid \text{patient features})$$
This probability is an estimate produced by a model trained on clinical data. It is not a diagnosis, and it should not be interpreted as a guarantee that a patient has or will develop heart disease.
How I Built It
I used the Extension of the Z-Alizadeh Sani cardiovascular dataset (UCI Machine Learning Repository) as the foundation for the project. The data-processing pipeline cleans the source data, identifies feature types, handles missing values, and separates the prediction targets from the model inputs.
I trained four independent prediction models:
- Overall coronary artery disease
- LAD stenosis
- LCX stenosis
- RCA stenosis
The models are trained without using target columns such as CAD, LAD, LCX, RCA, or Cath as input features. This prevents information from the answer column from leaking into the prediction.
For each target, the application calculates a model probability and compares it with a target-specific decision threshold. The threshold is selected using Youden's J statistic:
$$J = \text{sensitivity} + \text{specificity} - 1$$
The backend processes patient inputs and returns the predictions, thresholds, warnings, and feature explanations. The frontend then displays the results in an interactive dashboard. A 3D heart model allows users to rotate the anatomy, view the coronary arteries, and see risk shading mapped onto the relevant regions.
The project is multimodal in the sense that it combines structured clinical inputs (demographics, history, examination, symptoms, ECG, laboratory, and echocardiography fields) with an anatomical 3D visualization, feature-level explanations, and comparison against similar patients in the training cohort.
When information is not provided, the system uses typical values from the training cohort. The interface clearly reports how many fields were entered and how many values were assumed so that users can understand the limitations of the estimate.
Example
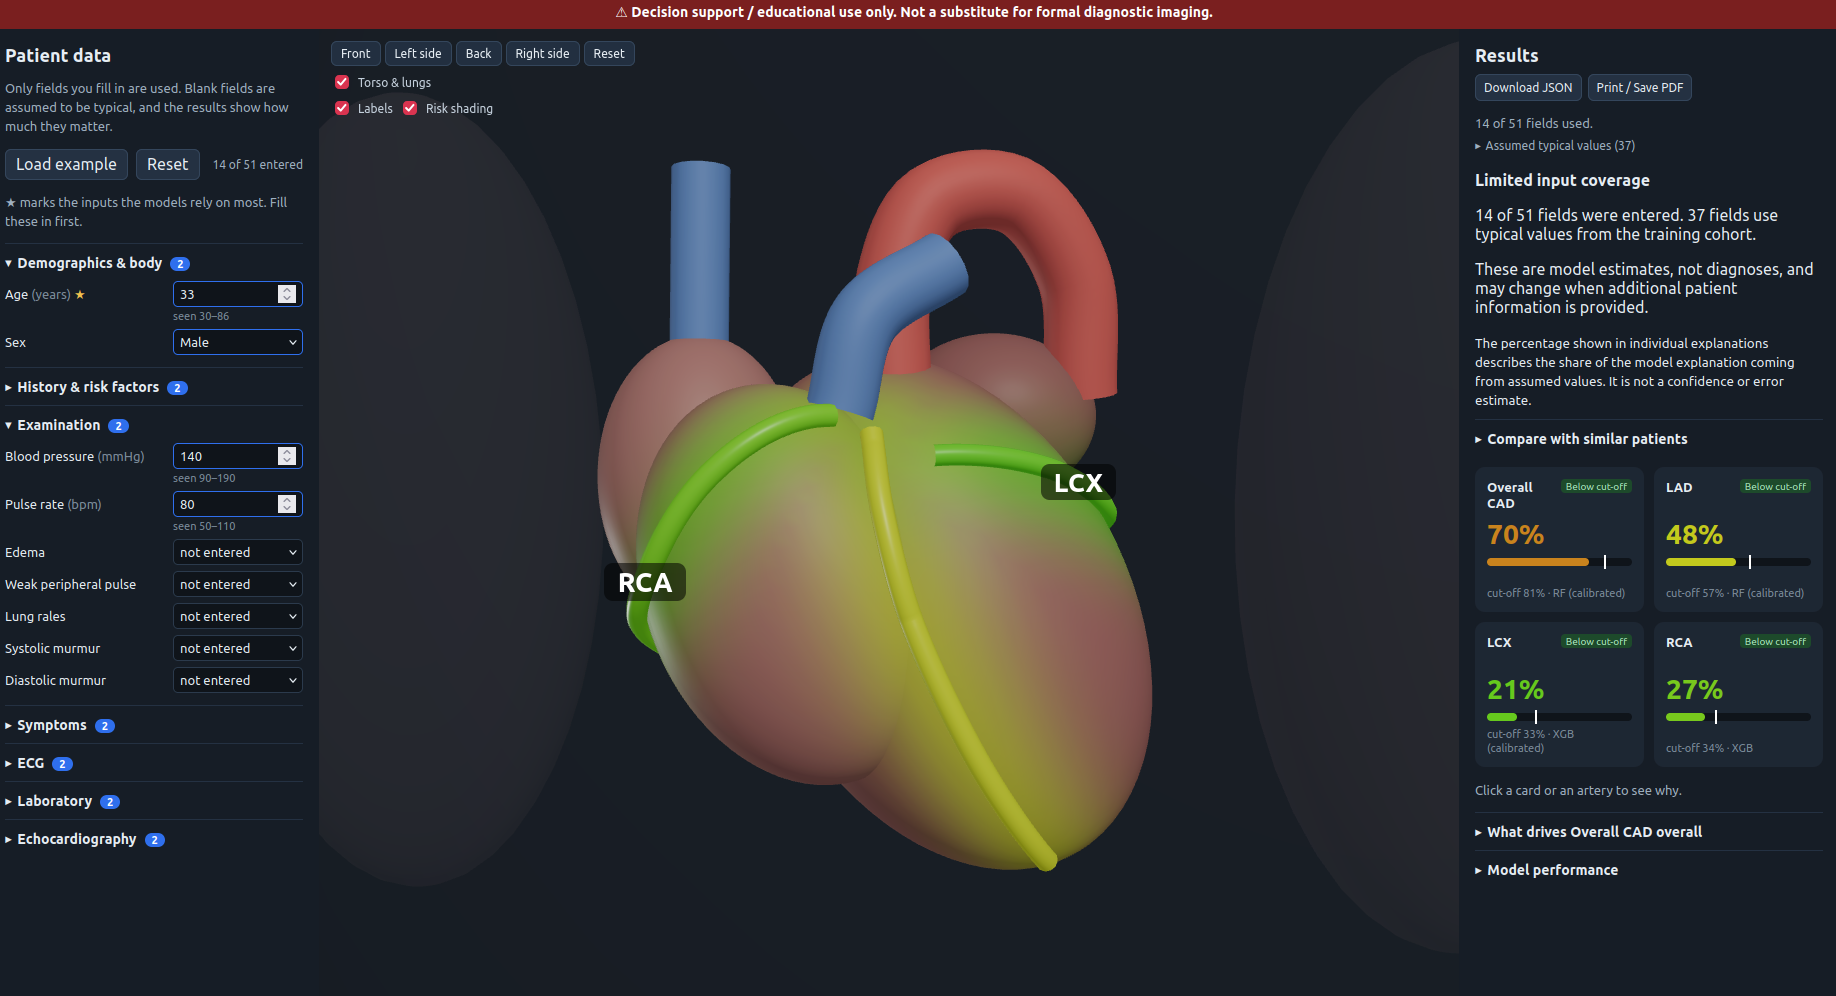
The app responds as more clinical information is entered. In one test with only 14 of 51 fields entered (a 33-year-old male with a few examination values), the models returned:
| Target | Probability | Decision cut-off | Result |
|---|---|---|---|
| Overall CAD | 70% | 81% | Below cut-off |
| LAD | 48% | 57% | Below cut-off |
| LCX | 21% | 33% | Below cut-off |
| RCA | 27% | 34% | Below cut-off |
In another test, a 63-year-old male with 13 fields entered pushed the overall CAD estimate to 99% and the LAD estimate to 96%, both well above their cut-offs, and the corresponding arteries turned red on the 3D heart.
Note that the percentages are relative to the training cohort, which is a hospital referral population with a high CAD prevalence. That is why the overall CAD decision cut-off is as high as 81%. The percentages are not population-level risk.
Challenges I Faced
One of my biggest challenges was working with incomplete patient information. A prediction based on only a few fields can be substantially less informative than one based on a complete clinical profile. To address this, I added input-coverage warnings and identified which results rely heavily on assumed values.
Another challenge was preventing data leakage. Medical datasets often contain columns that are closely related to the desired prediction, so I created explicit leakage checks to ensure that target labels and diagnostic result columns never become model inputs.
I also had to balance predictive performance with interpretability. A model that produces a probability is more useful when users can understand what influenced that probability. I therefore added feature explanations, calibrated outputs where appropriate, target-specific thresholds, and visual risk mapping.
Finally, integrating machine learning with a 3D visualization introduced both technical and design challenges. The system needed to remain responsive while presenting complex medical information in a way that was understandable and visually clear.
What I Built
CoronaryCode is an educational decision-support prototype that combines:
- Clinical data input
- Machine-learning predictions
- Calibrated CAD probability estimates
- Separate coronary-vessel predictions
- Interactive 3D heart visualization
- Feature-level explanations
- Comparison with similar patients
- Missing-input and uncertainty warnings
- JSON and PDF result exports
The project is intended for visualization, experimentation, and education. It is not a substitute for professional medical advice, diagnostic imaging, or clinical decision-making.
What's Next
- Validate the models on external datasets beyond the single hospital cohort
- Accept ECG and Echocardiography images or waveforms as direct inputs
- Show uncertainty ranges alongside the probabilities
- Review the explanations and thresholds with clinicians
Built With
- fastapi
- javascript
- python
- react
- react-three-fiber
- scikit-learn
- shap
- three.js
- vite
- xgboost

Log in or sign up for Devpost to join the conversation.