-
-
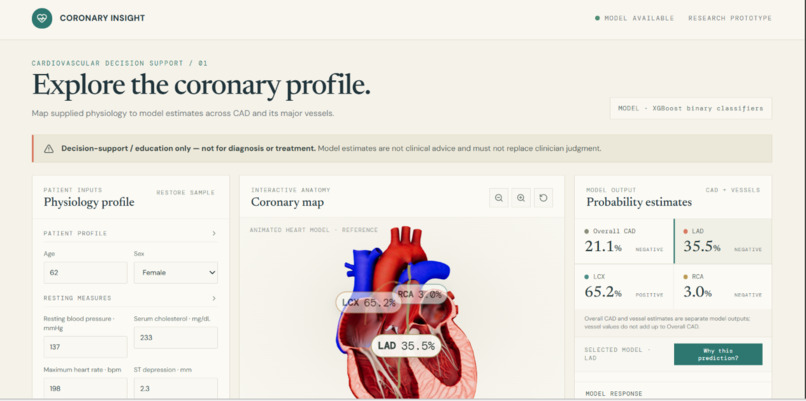
Website UI
-
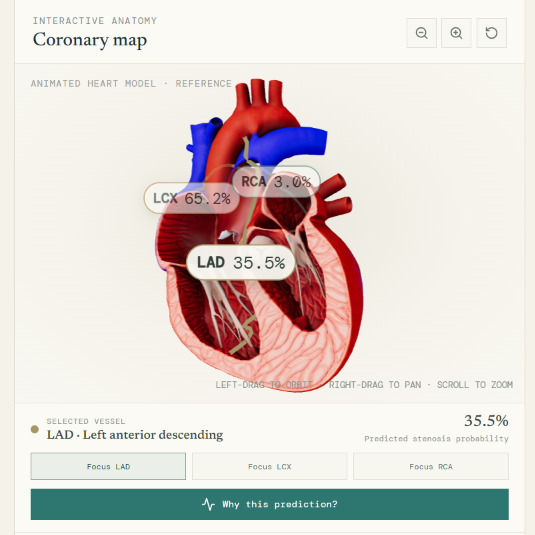
Heart working 3D model
Inspiration
Cardiovascular disease remains a leading cause of global mortality, yet communicating heart disease risk often relies on static charts and complex statistical tables. Probability scores alone can feel abstract and detached from physical anatomy.
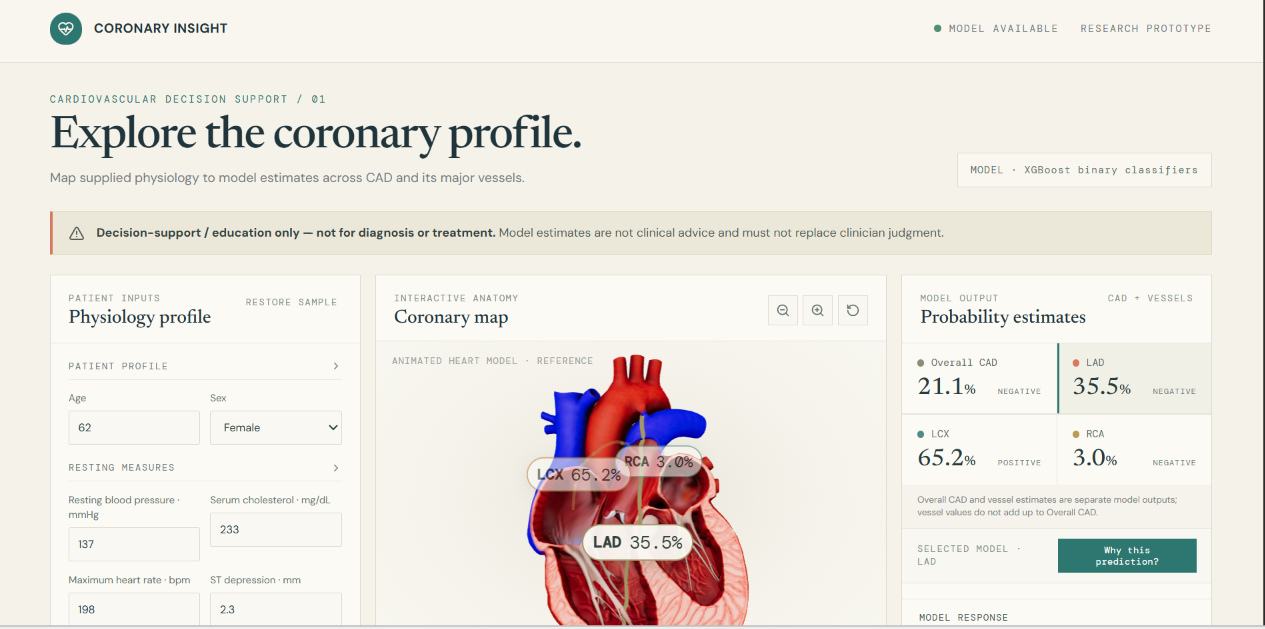
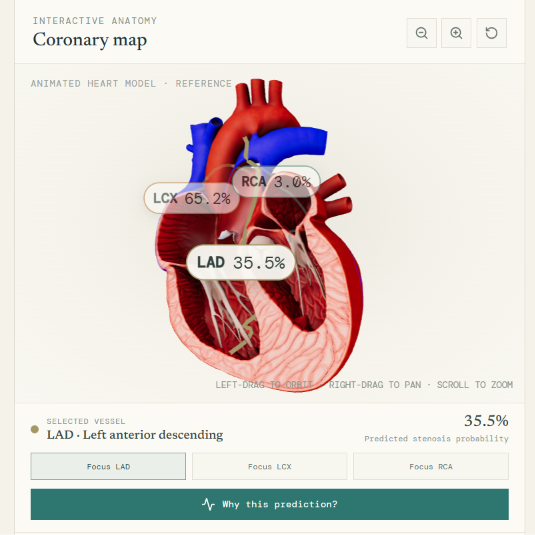
We were inspired to create Coronary Insight to bridge the gap between machine learning diagnostics and anatomical spatial visualization. By merging XGBoost predictive models with an interactive 3D digital twin of the heart, we aimed to transform black-box numerical estimates into intuitive visual insights, helping clinicians and students explore how key physiological markers relate directly to individual coronary arteries.
What it does
Coronary Insight is a real-time, interactive decision-support and educational prototype that maps patient-specific clinical inputs to CAD and vessel-level stenosis risk:
- Interactive 3D Coronary Mapping: Renders an orbitable, zoomable 3D heart model with dynamic screen-space overlay labels anchored directly to major coronary branches: the Left Anterior Descending (LAD), Left Circumflex (LCX), and Right Coronary Artery (RCA).
- Multi-Target Prediction Engine: Runs independent binary classification models for overall CAD risk alongside individual predictions for the LAD, LCX, and RCA arteries.
- Patient-Specific Explainability: Features a Why this prediction panel powered by TreeSHAP that breaks down exact clinical risk drivers such as ST depression, resting blood pressure, cholesterol, and exercise-induced angina for each target vessel.
How I built it
- Frontend and Visualizations: Built with React, TypeScript, and Tailwind CSS. The 3D scene is driven by WebGL via React Three Fiber and Drei using GLTF and GLB heart assets.
- Coordinate Anchoring: Real-time projected labels map world space mesh coordinates to screen space using full projection matrices.
- Machine Learning and Inference: Python backend leveraging serialized XGBoost ensemble classifiers to evaluate independent multi-target stenosis probabilities.
- Explainability Layer: Integrated TreeSHAP to calculate feature contribution values relative to the expected model baseline.
Challenges we ran into
- Overlay Drift During Camera Manipulation: Anchoring HTML and SVG UI overlays to a rotating, zooming 3D model caused visual drift. We resolved this by syncing coordinate projections inside the Three.js frame loop and maintaining proper HTML portal teardown on camera resets.
- Multi-Target Disambiguation: Overall CAD risk and specific vessel predictions operate on independent binary targets rather than mutually exclusive probabilities. Designing the UI to clearly show that vessel estimates do not algebraically sum to Overall CAD was essential for clinical clarity.
- SHAP Bias Handling: Managing XGBoost trailing intercept and bias terms across API response formats while sorting patient-specific positive and negative feature contributors dynamically without breaking UI state synchronization.
Accomplishments that I am proud of
- Seamless 3D Spatial Synchronization: Successfully locked dynamic risk labels to specific 3D mesh coordinates across full 360-degree orbit, pan, and zoom operations.
- Interpretable AI Design: Integrated local TreeSHAP feature contributions into a clean, collapsible UI panel, allowing users to immediately understand why a particular vessel risk score changed.
- Responsive Multi-Panel Interface: Built a unified decision-support UI that responds dynamically to patient physiological adjustments in real time.
What I learned
- 3D Performance and React Lifecycle Optimization: Gained deep experience in synchronizing Three.js render states with React component lifecycles to prevent memory leaks and unneeded re-renders.
- Clinical Interpretability in AI: Learned the value of pairing raw probability scores with actionable, localized feature breakdowns rather than delivering standalone numbers.
- Multi-Label Modeling Dynamics: Refined methods for presenting distinct multi-target outputs clearly without confusing non-additive probability distributions.
What's next for Coronary Insight
- Patient Cohort Validation: Integrating benchmark datasets to establish formal validation metrics, including ROC-AUC, sensitivity, and calibration curves.
- Enhanced Anatomical Mapping: Expanding 3D mesh coverage to include secondary branch vessels like diagonal and obtuse marginal branches.
- Clinical EHR Integration: Adding FHIR and HL7 interoperability standards to allow automatic ingestion of patient physiological data directly from Electronic Health Record platforms.
Built With
- ml
- python
- react
- three.js
- typescript
- webgl
- xgboost

Log in or sign up for Devpost to join the conversation.