Inspiration
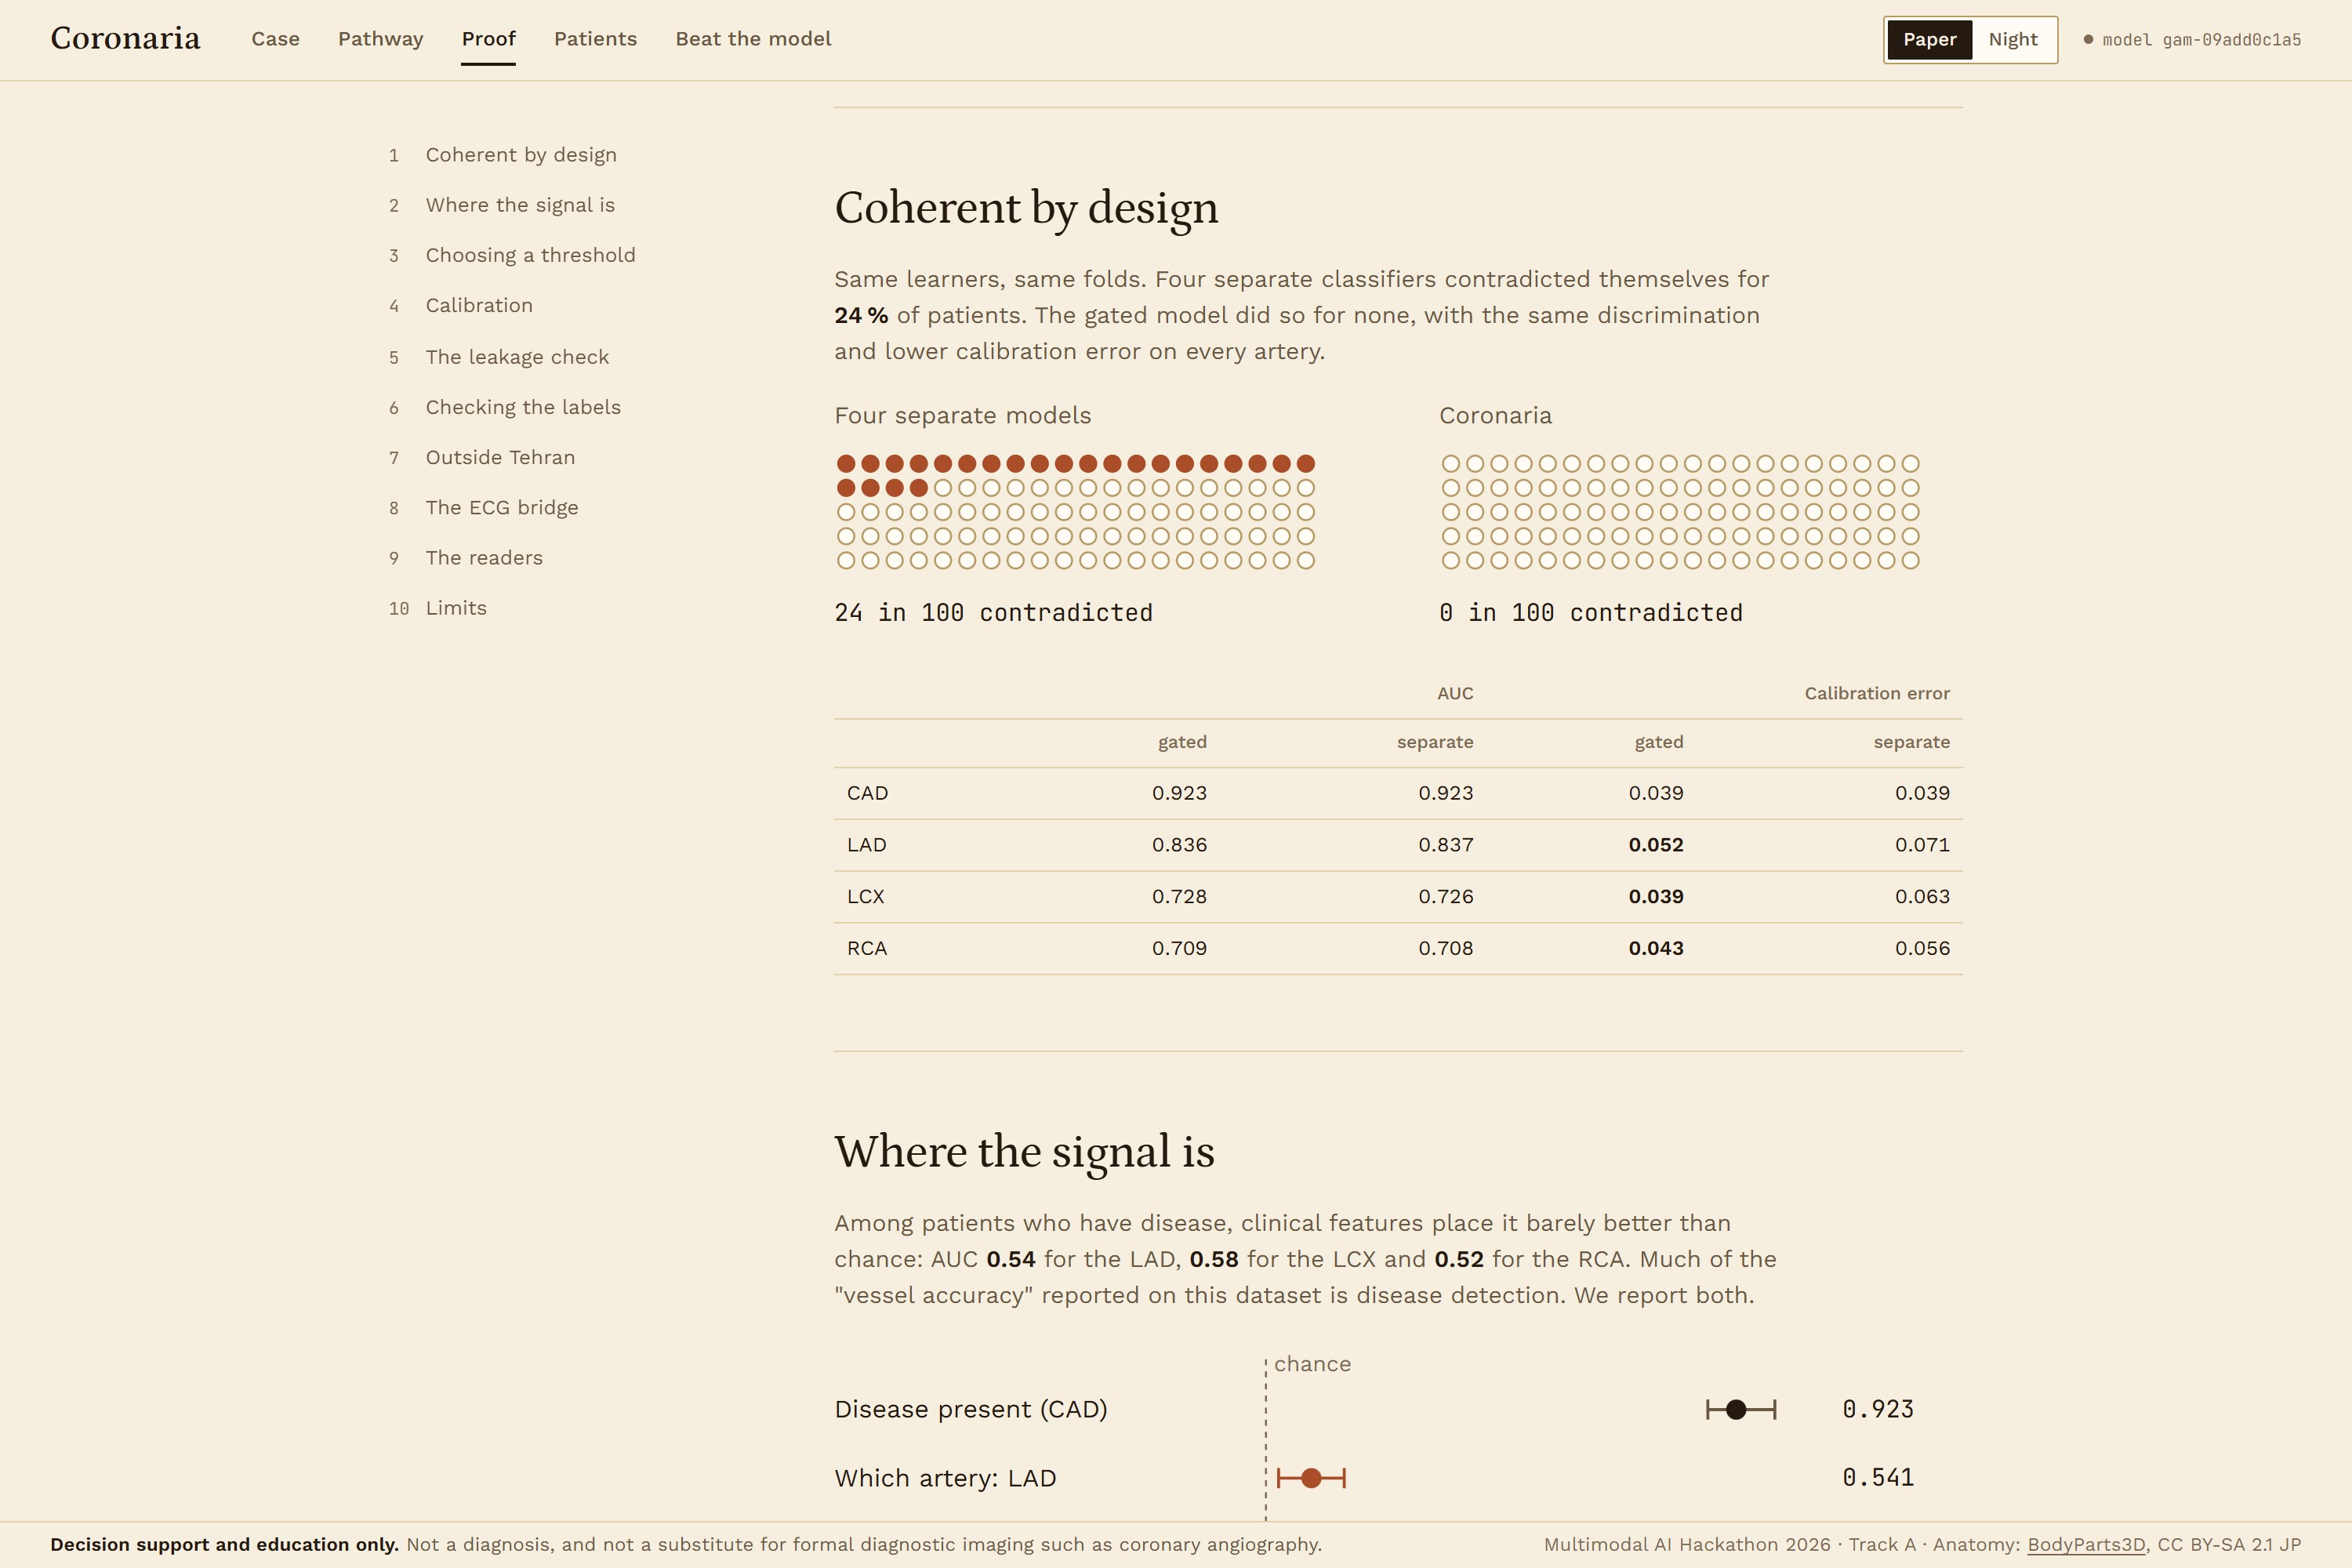
A risk score of 78% tells a cardiologist very little about where the disease is. The Track A brief made that point, and reading the published work on the Z-Alizadeh Sani dataset turned up two more problems. Many papers report 95 to 98% accuracy, but they select features and oversample on all rows before cross-validation, so the test data leaks into training. And the usual design trains four separate classifiers for CAD, LAD, LCX and RCA, which can rate an artery as more likely narrowed than the patient is to have CAD at all. In our nested CV that happened for 24% of patients.
We wanted numbers that can't contradict each other, validated so nothing from a test fold reaches training, and drawn on a heart that shows which artery is at risk and how sure the model is.
What it does
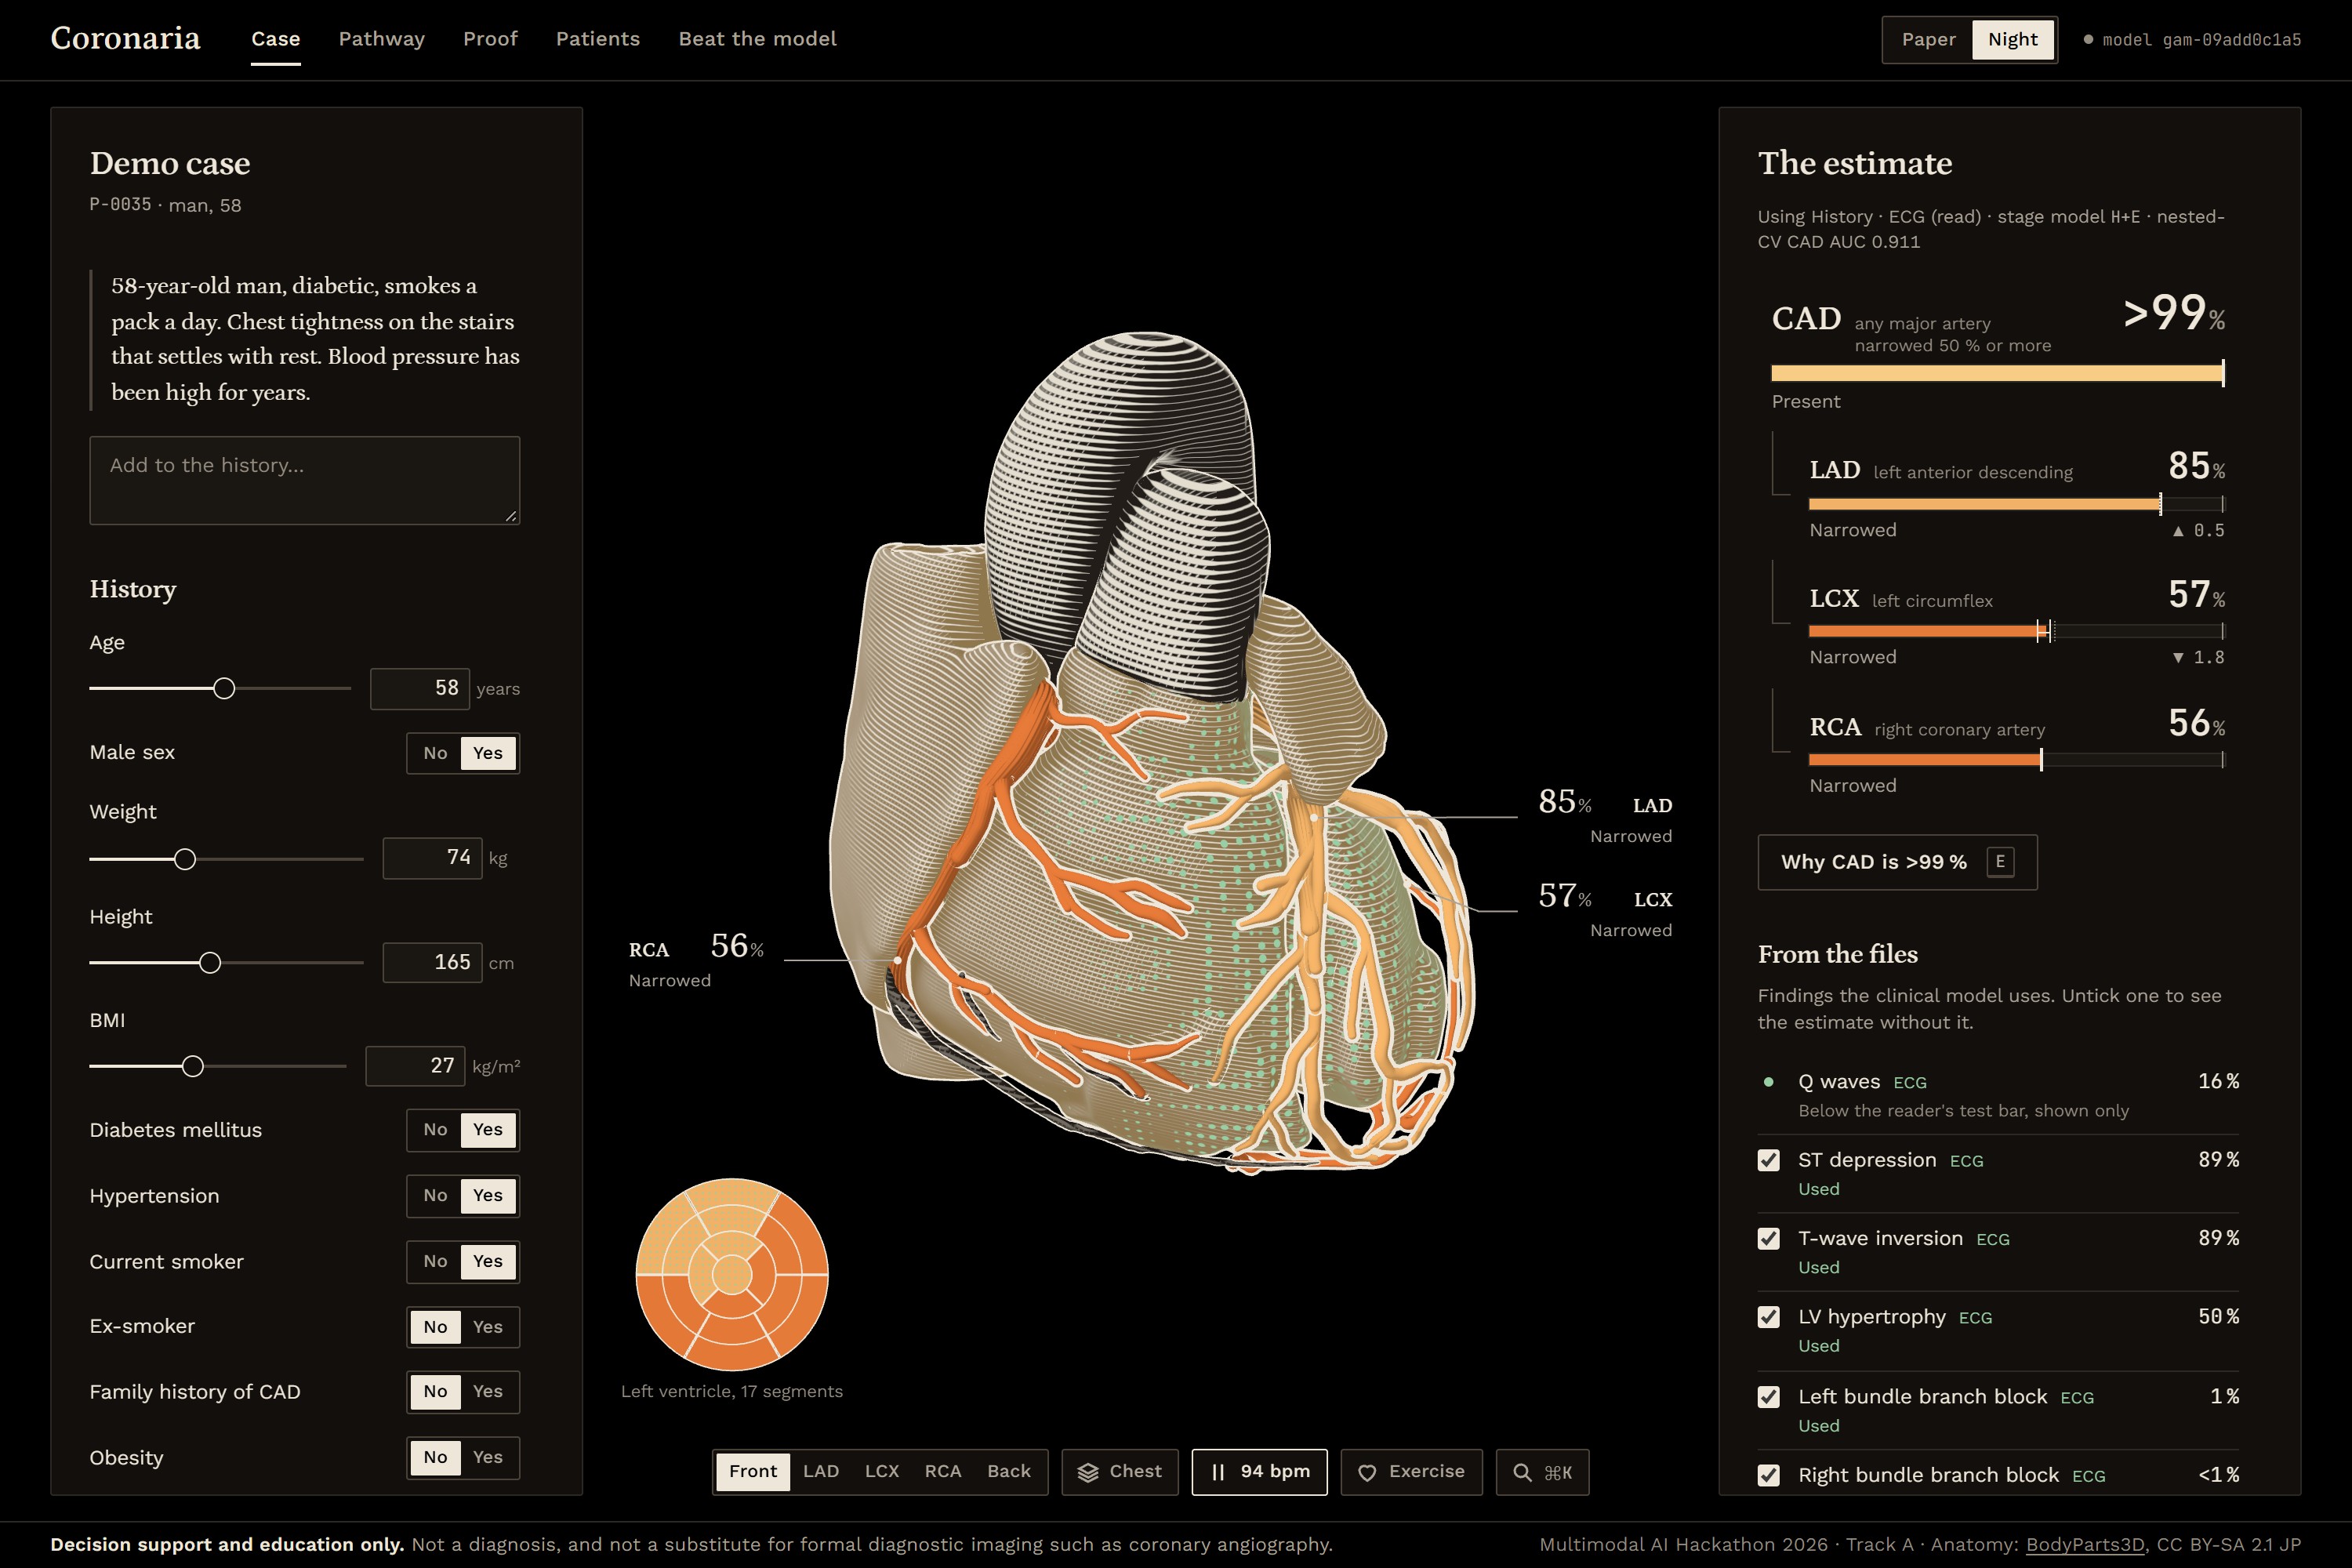
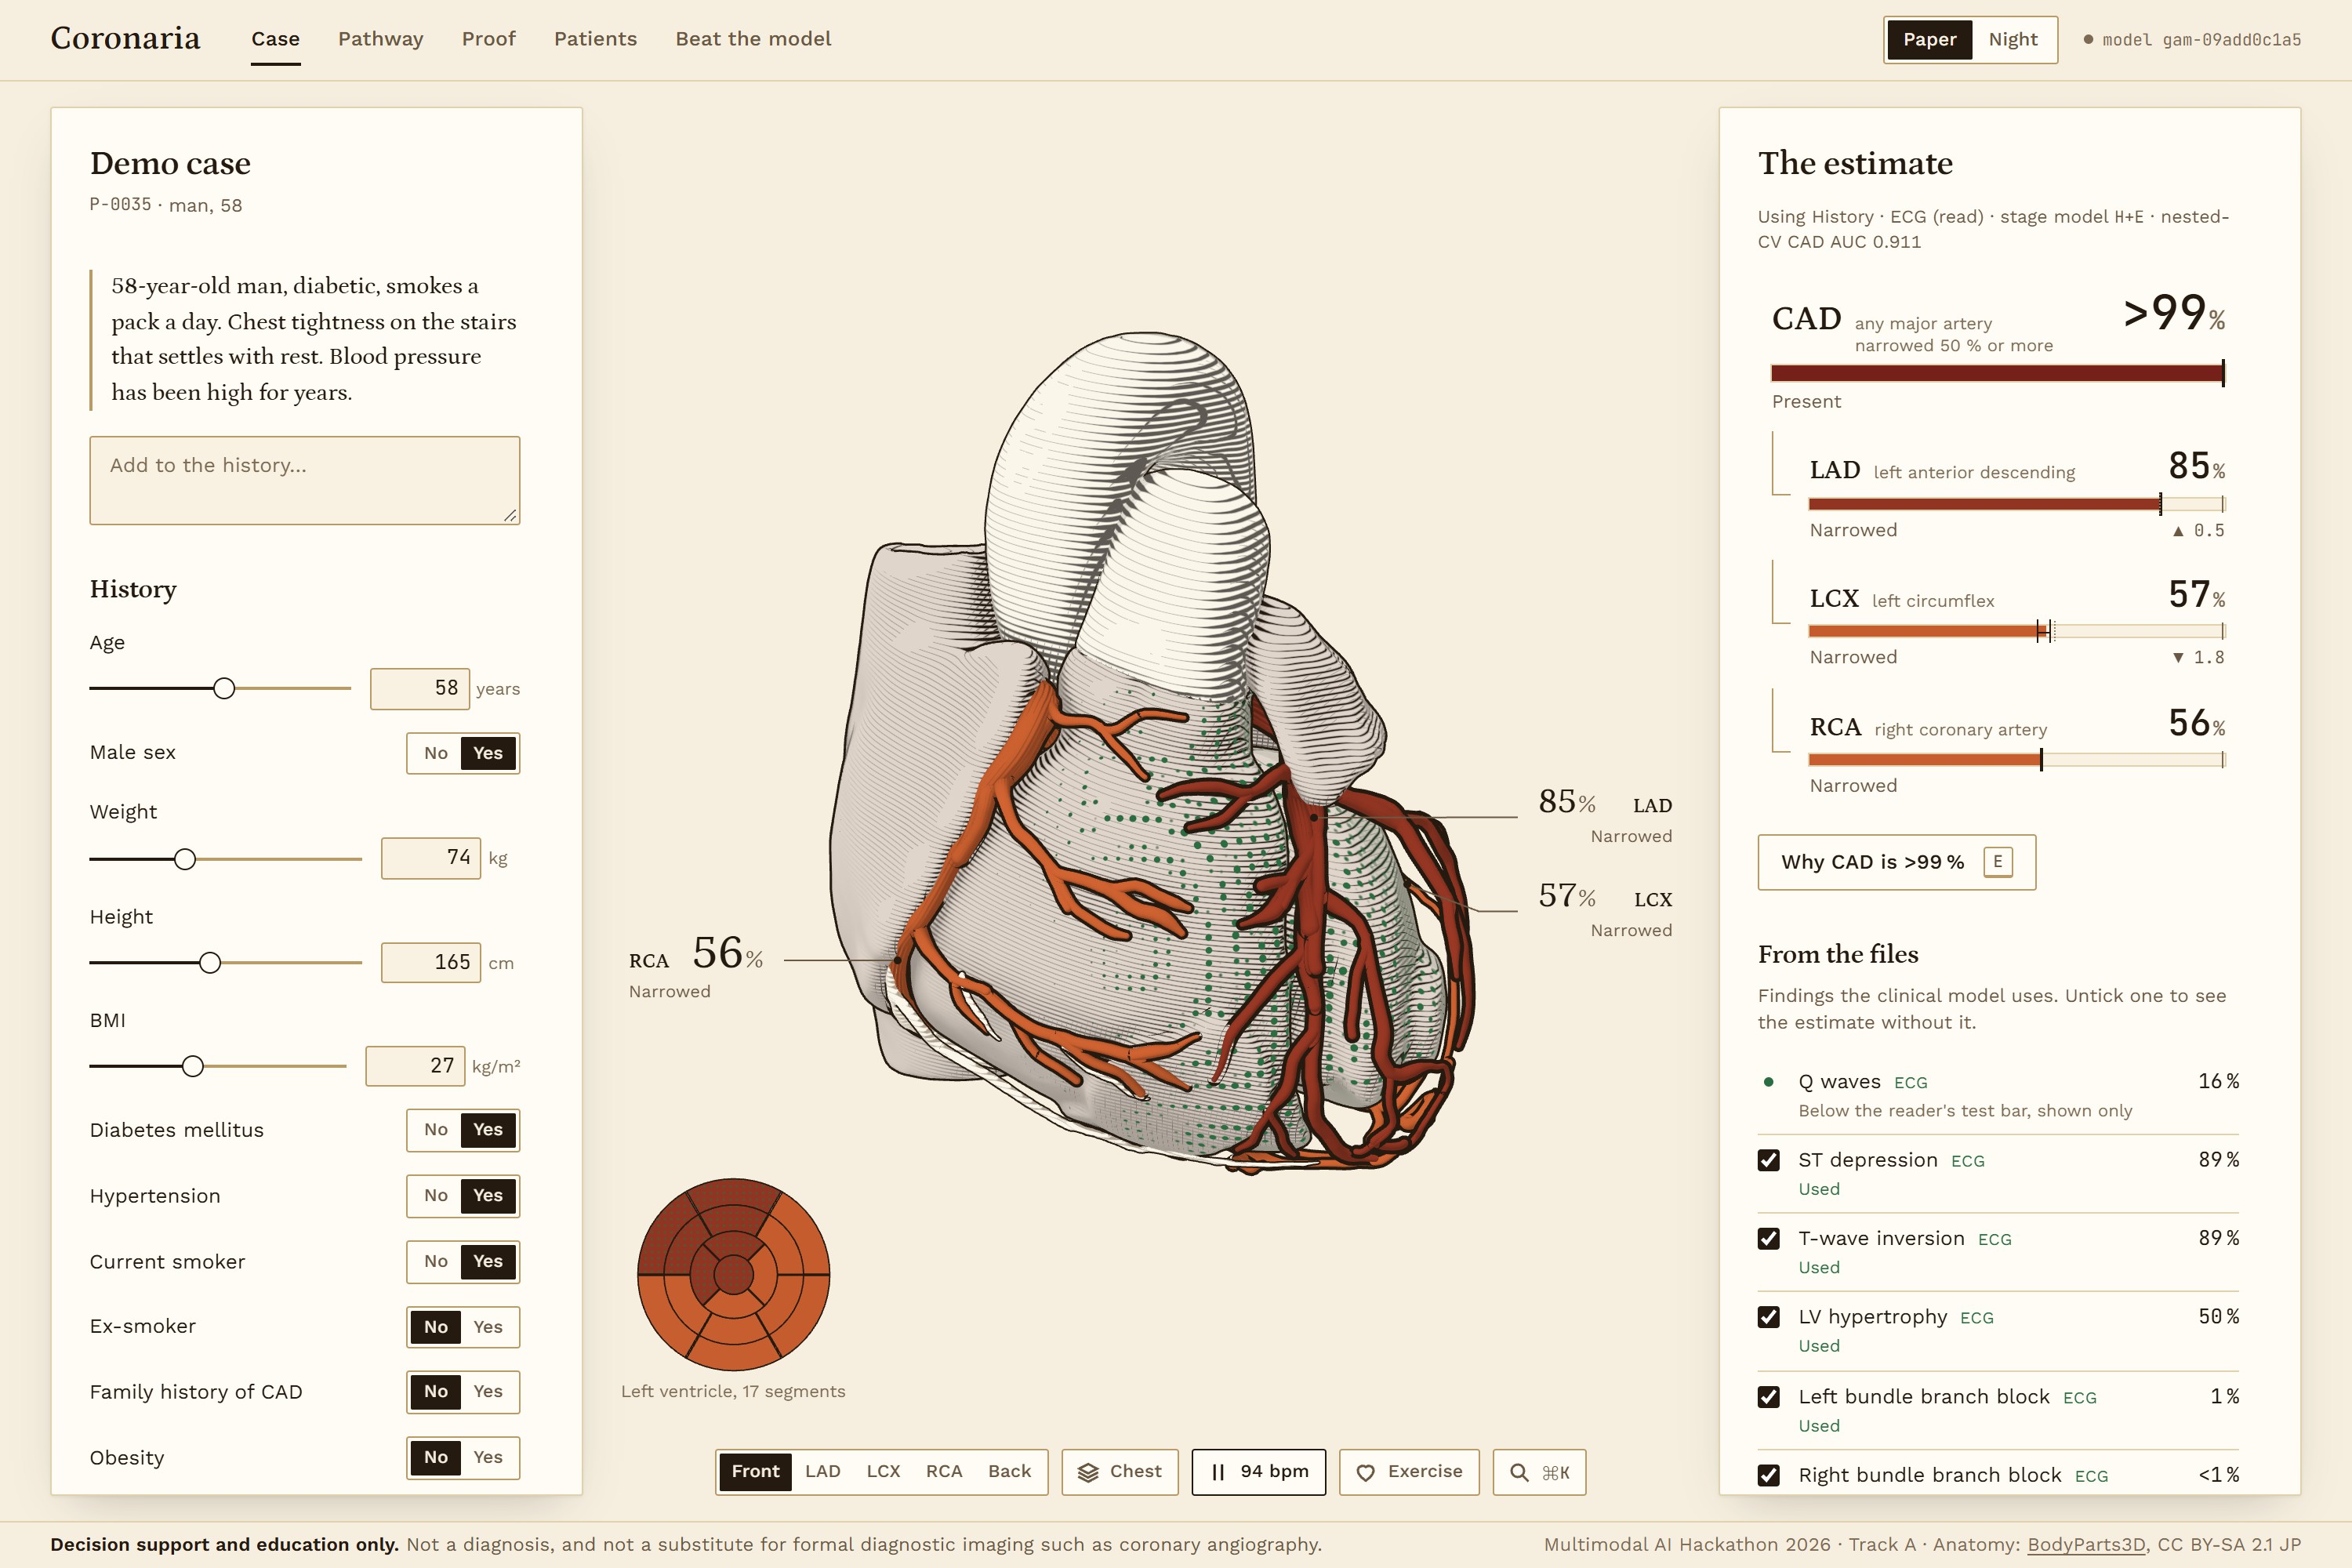
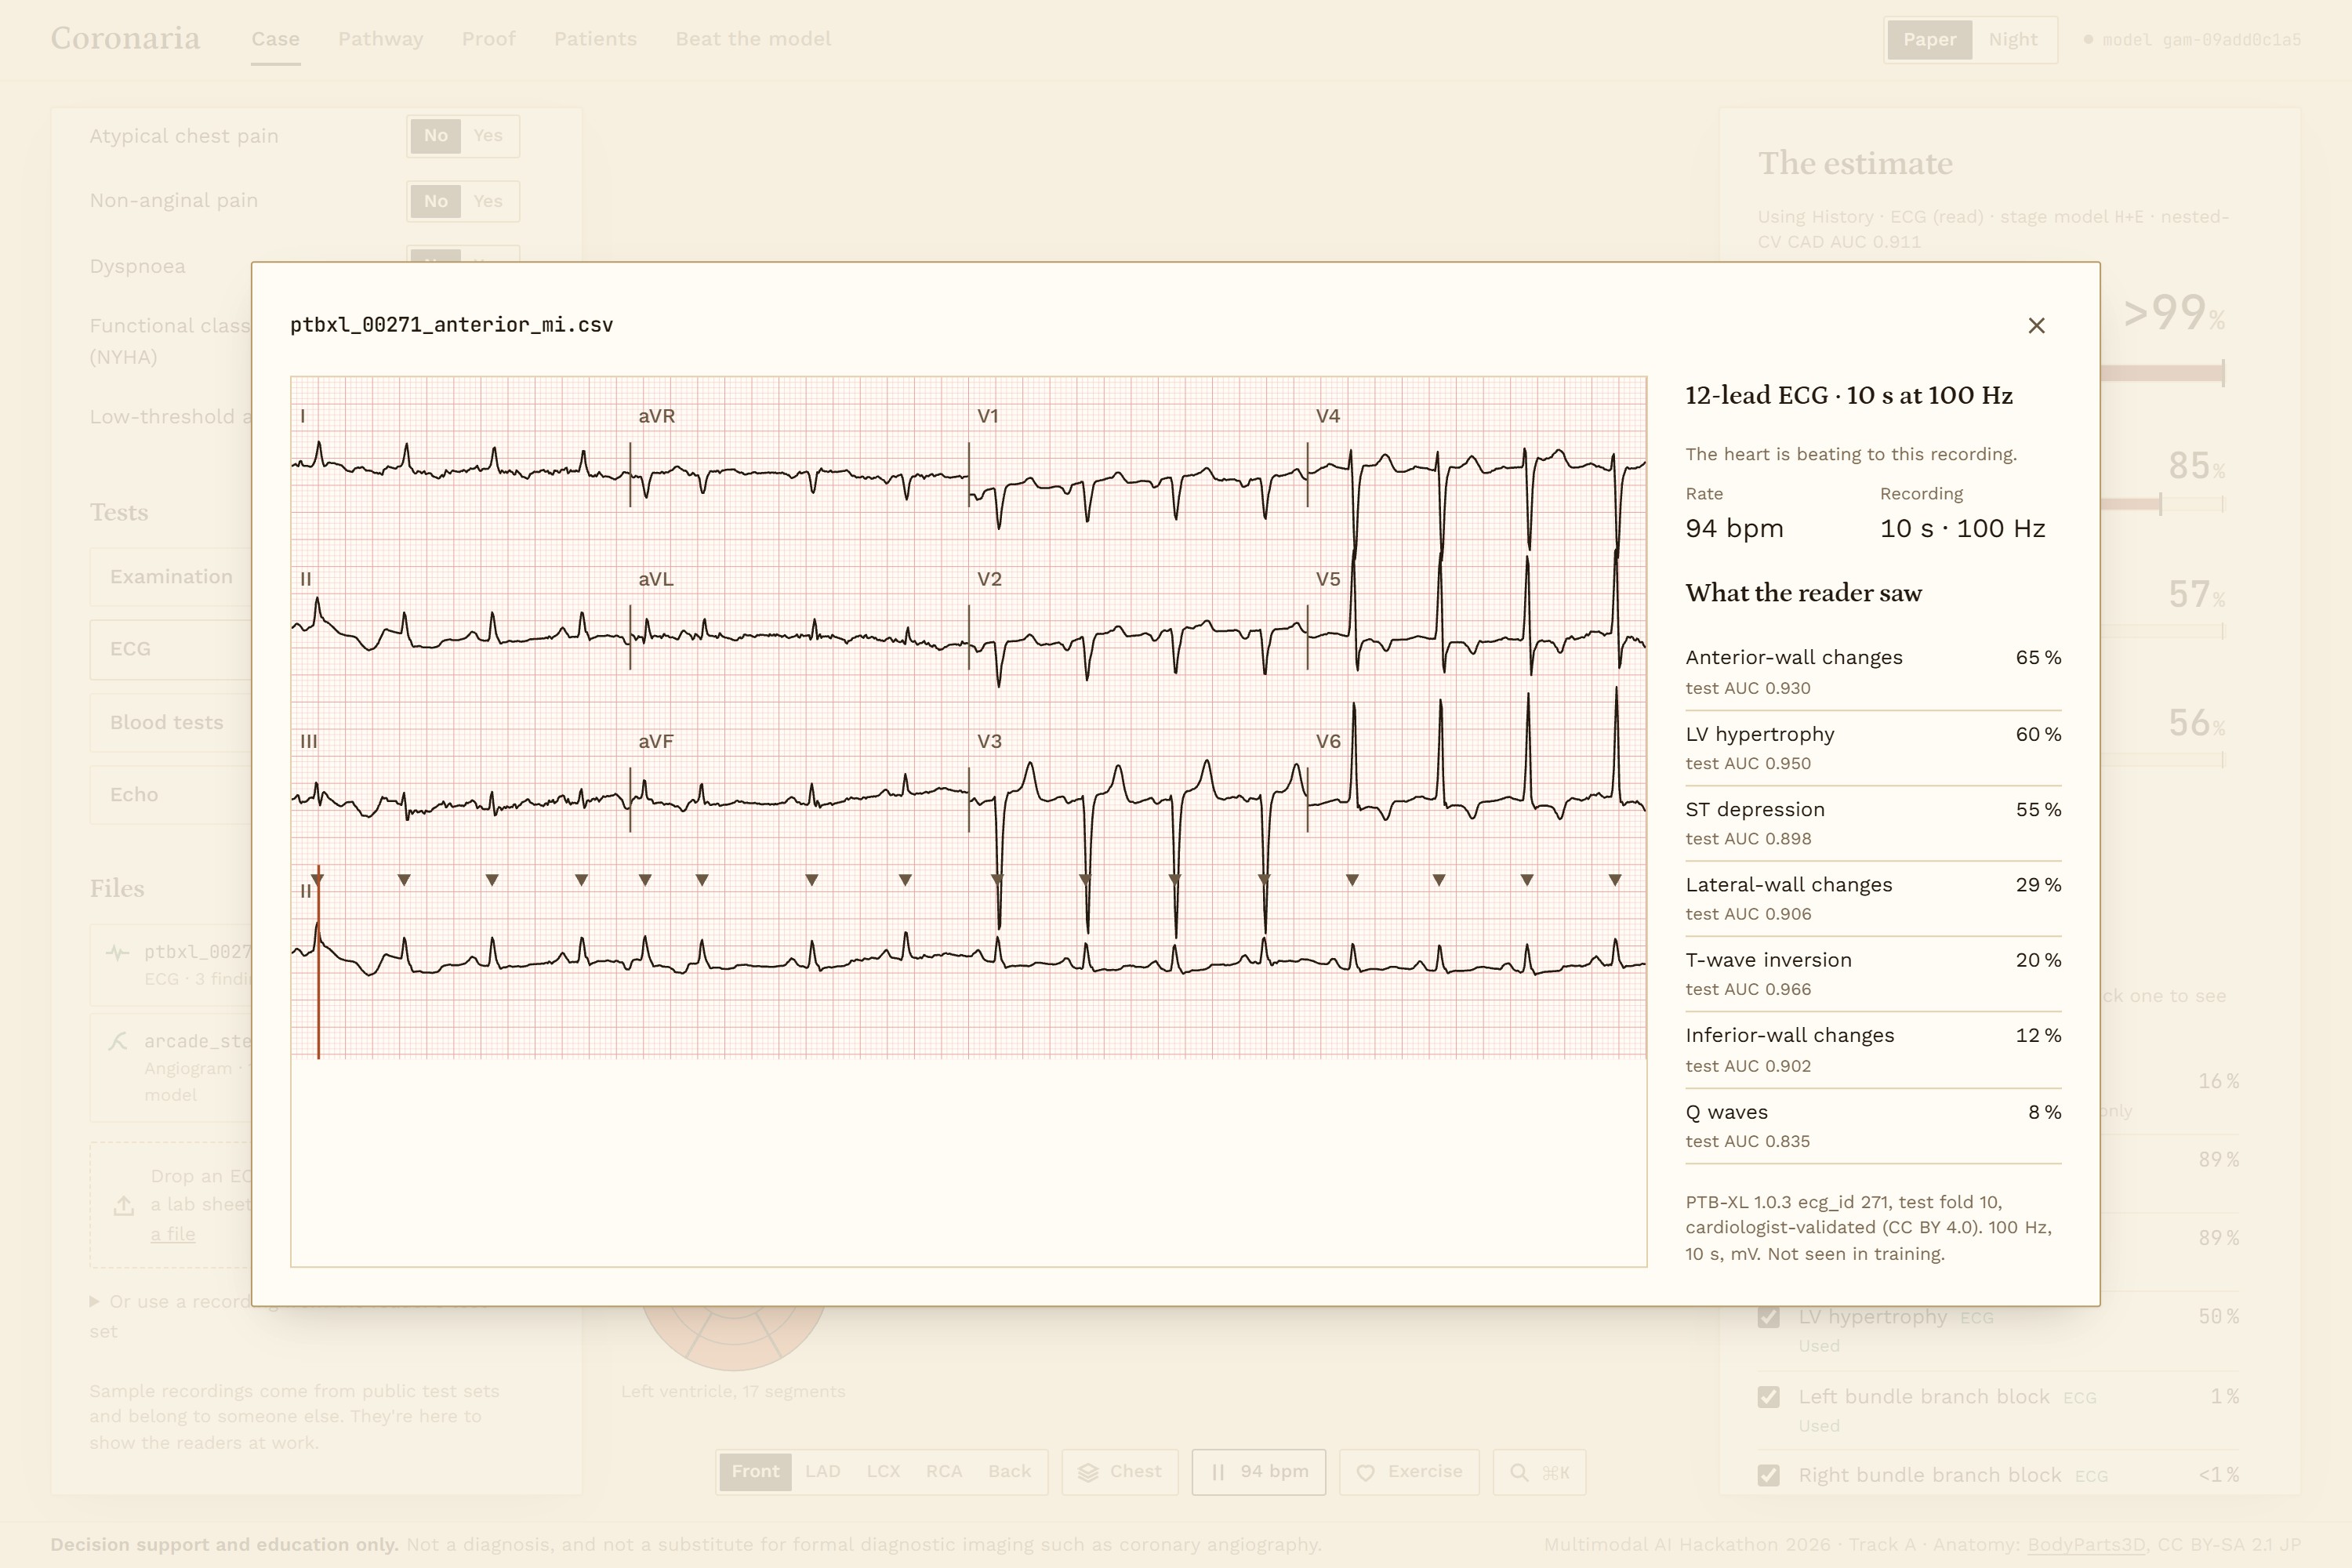
You describe the patient by typing or speaking. Coronaria pulls out the history, quotes the phrase each value came from, and gives a first estimate. You can then add a 12-lead ECG file, an angiogram frame, typed lab and echo results, or a scanned report.
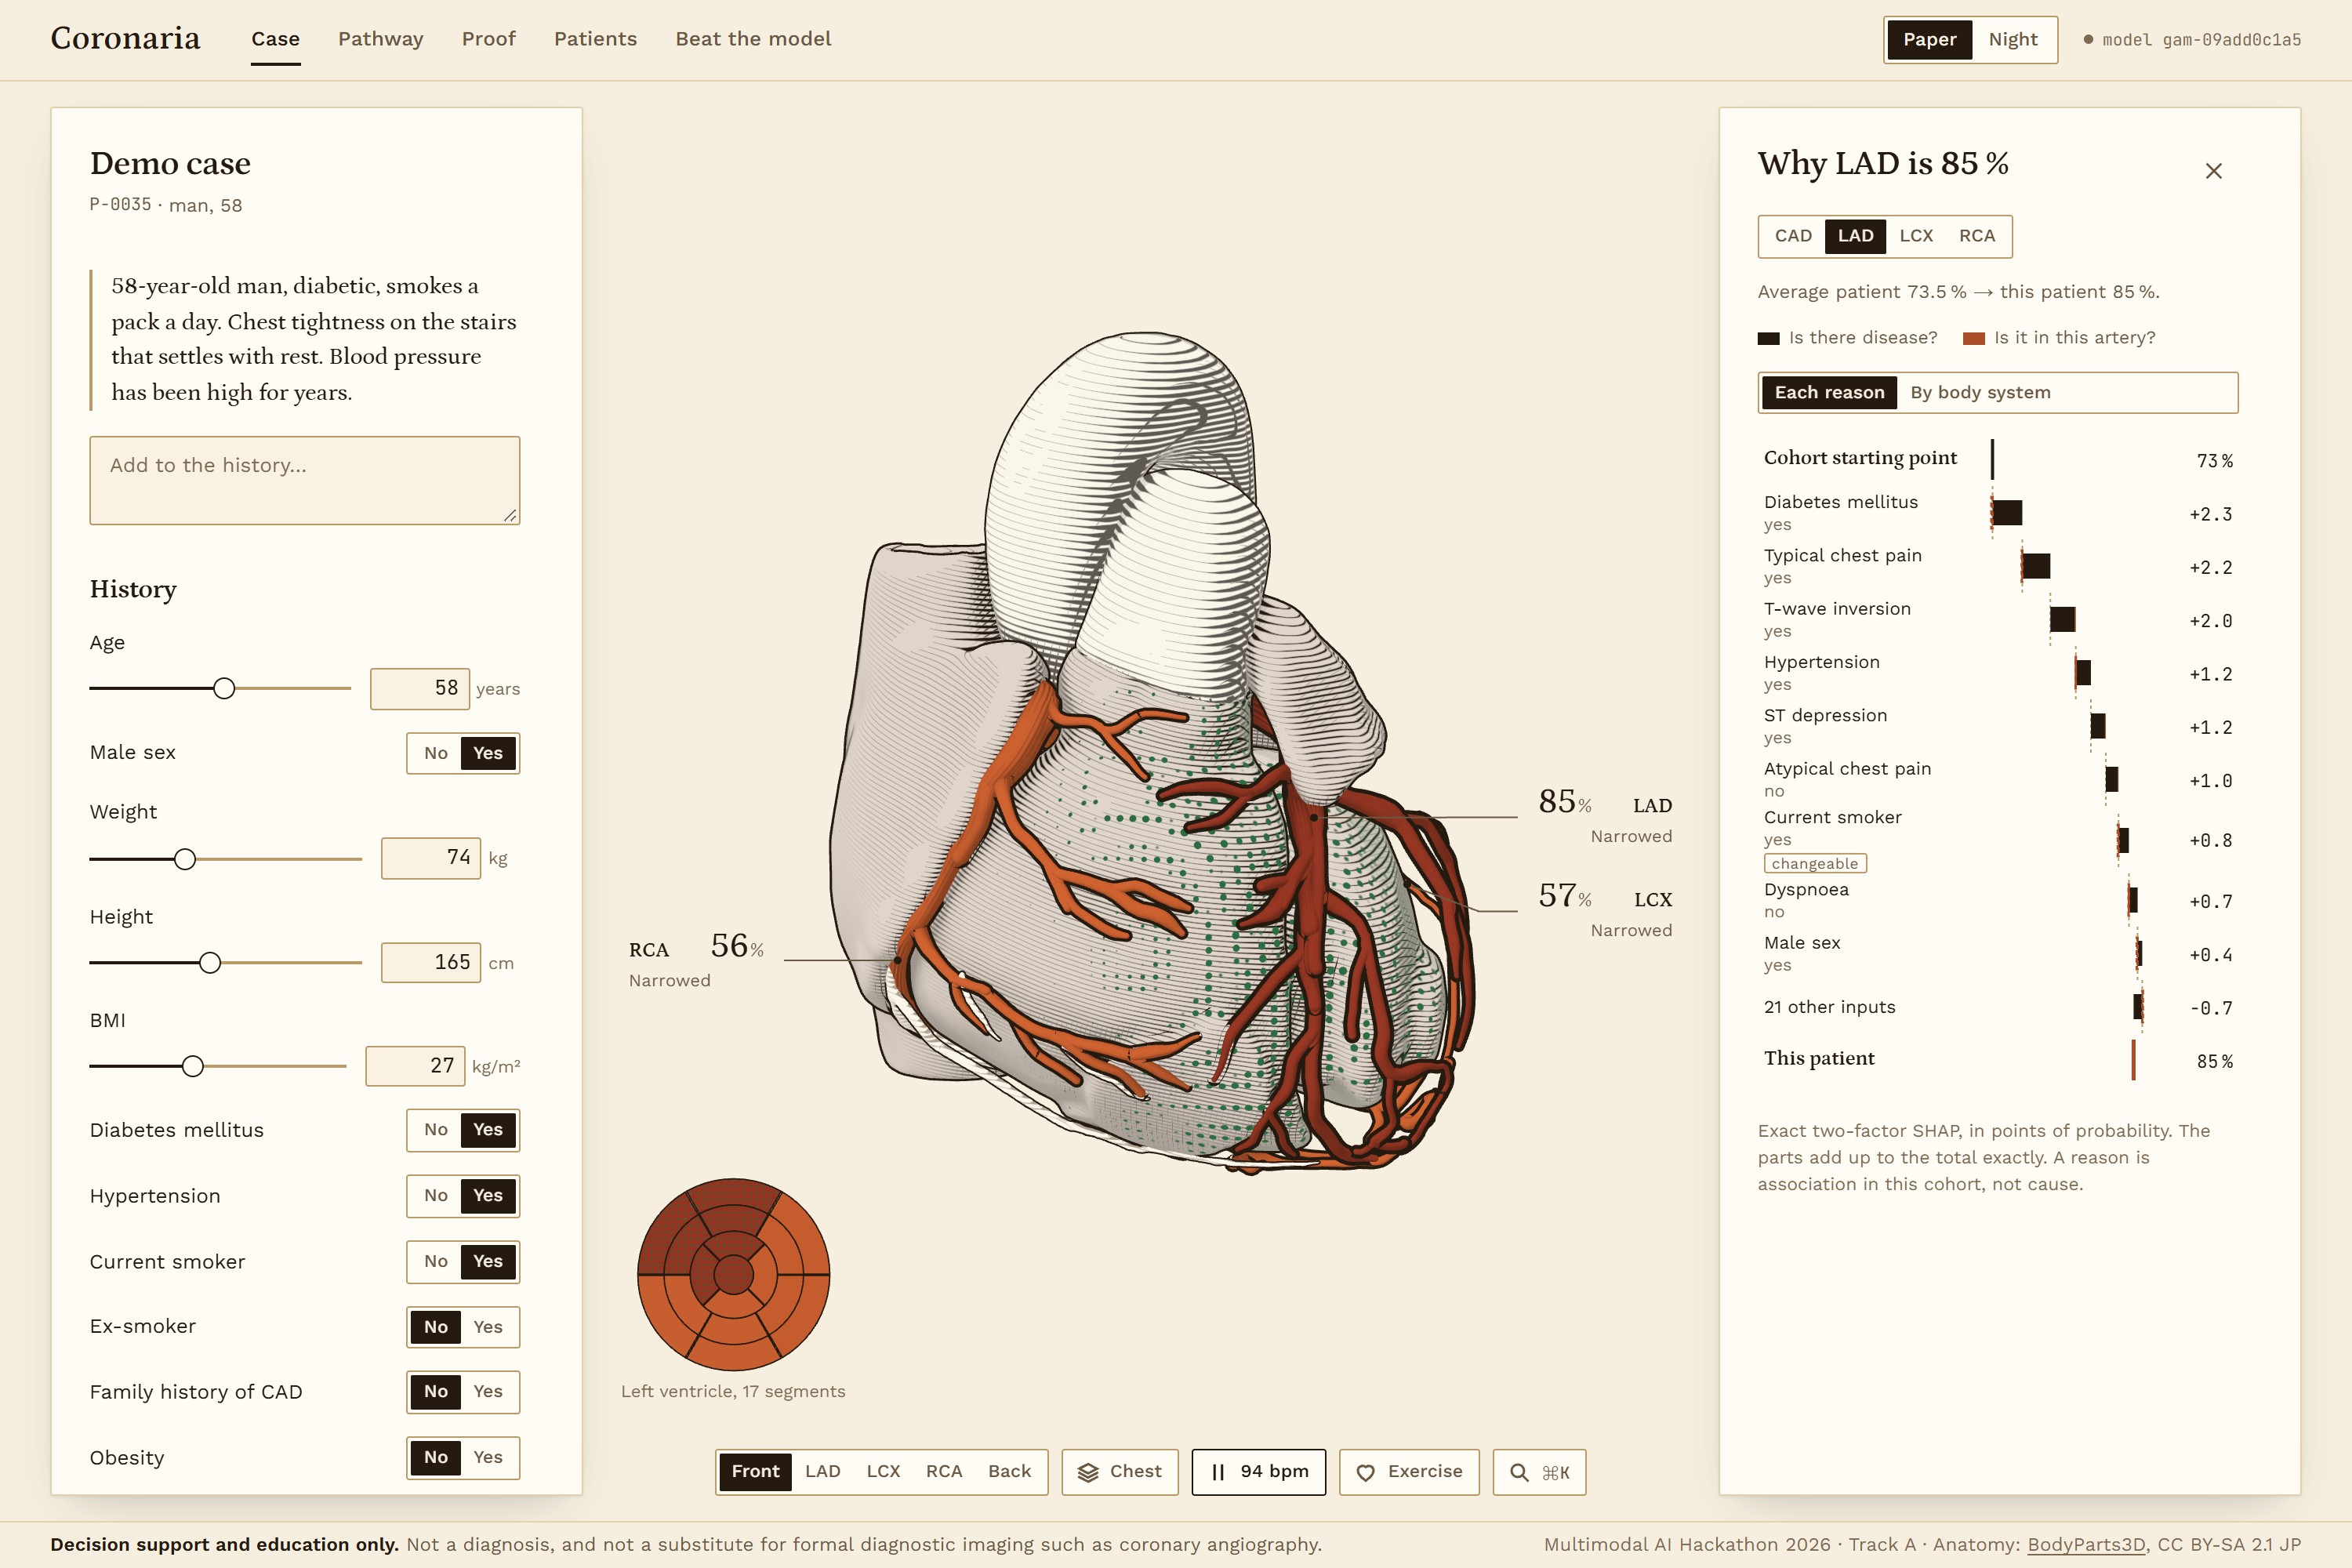
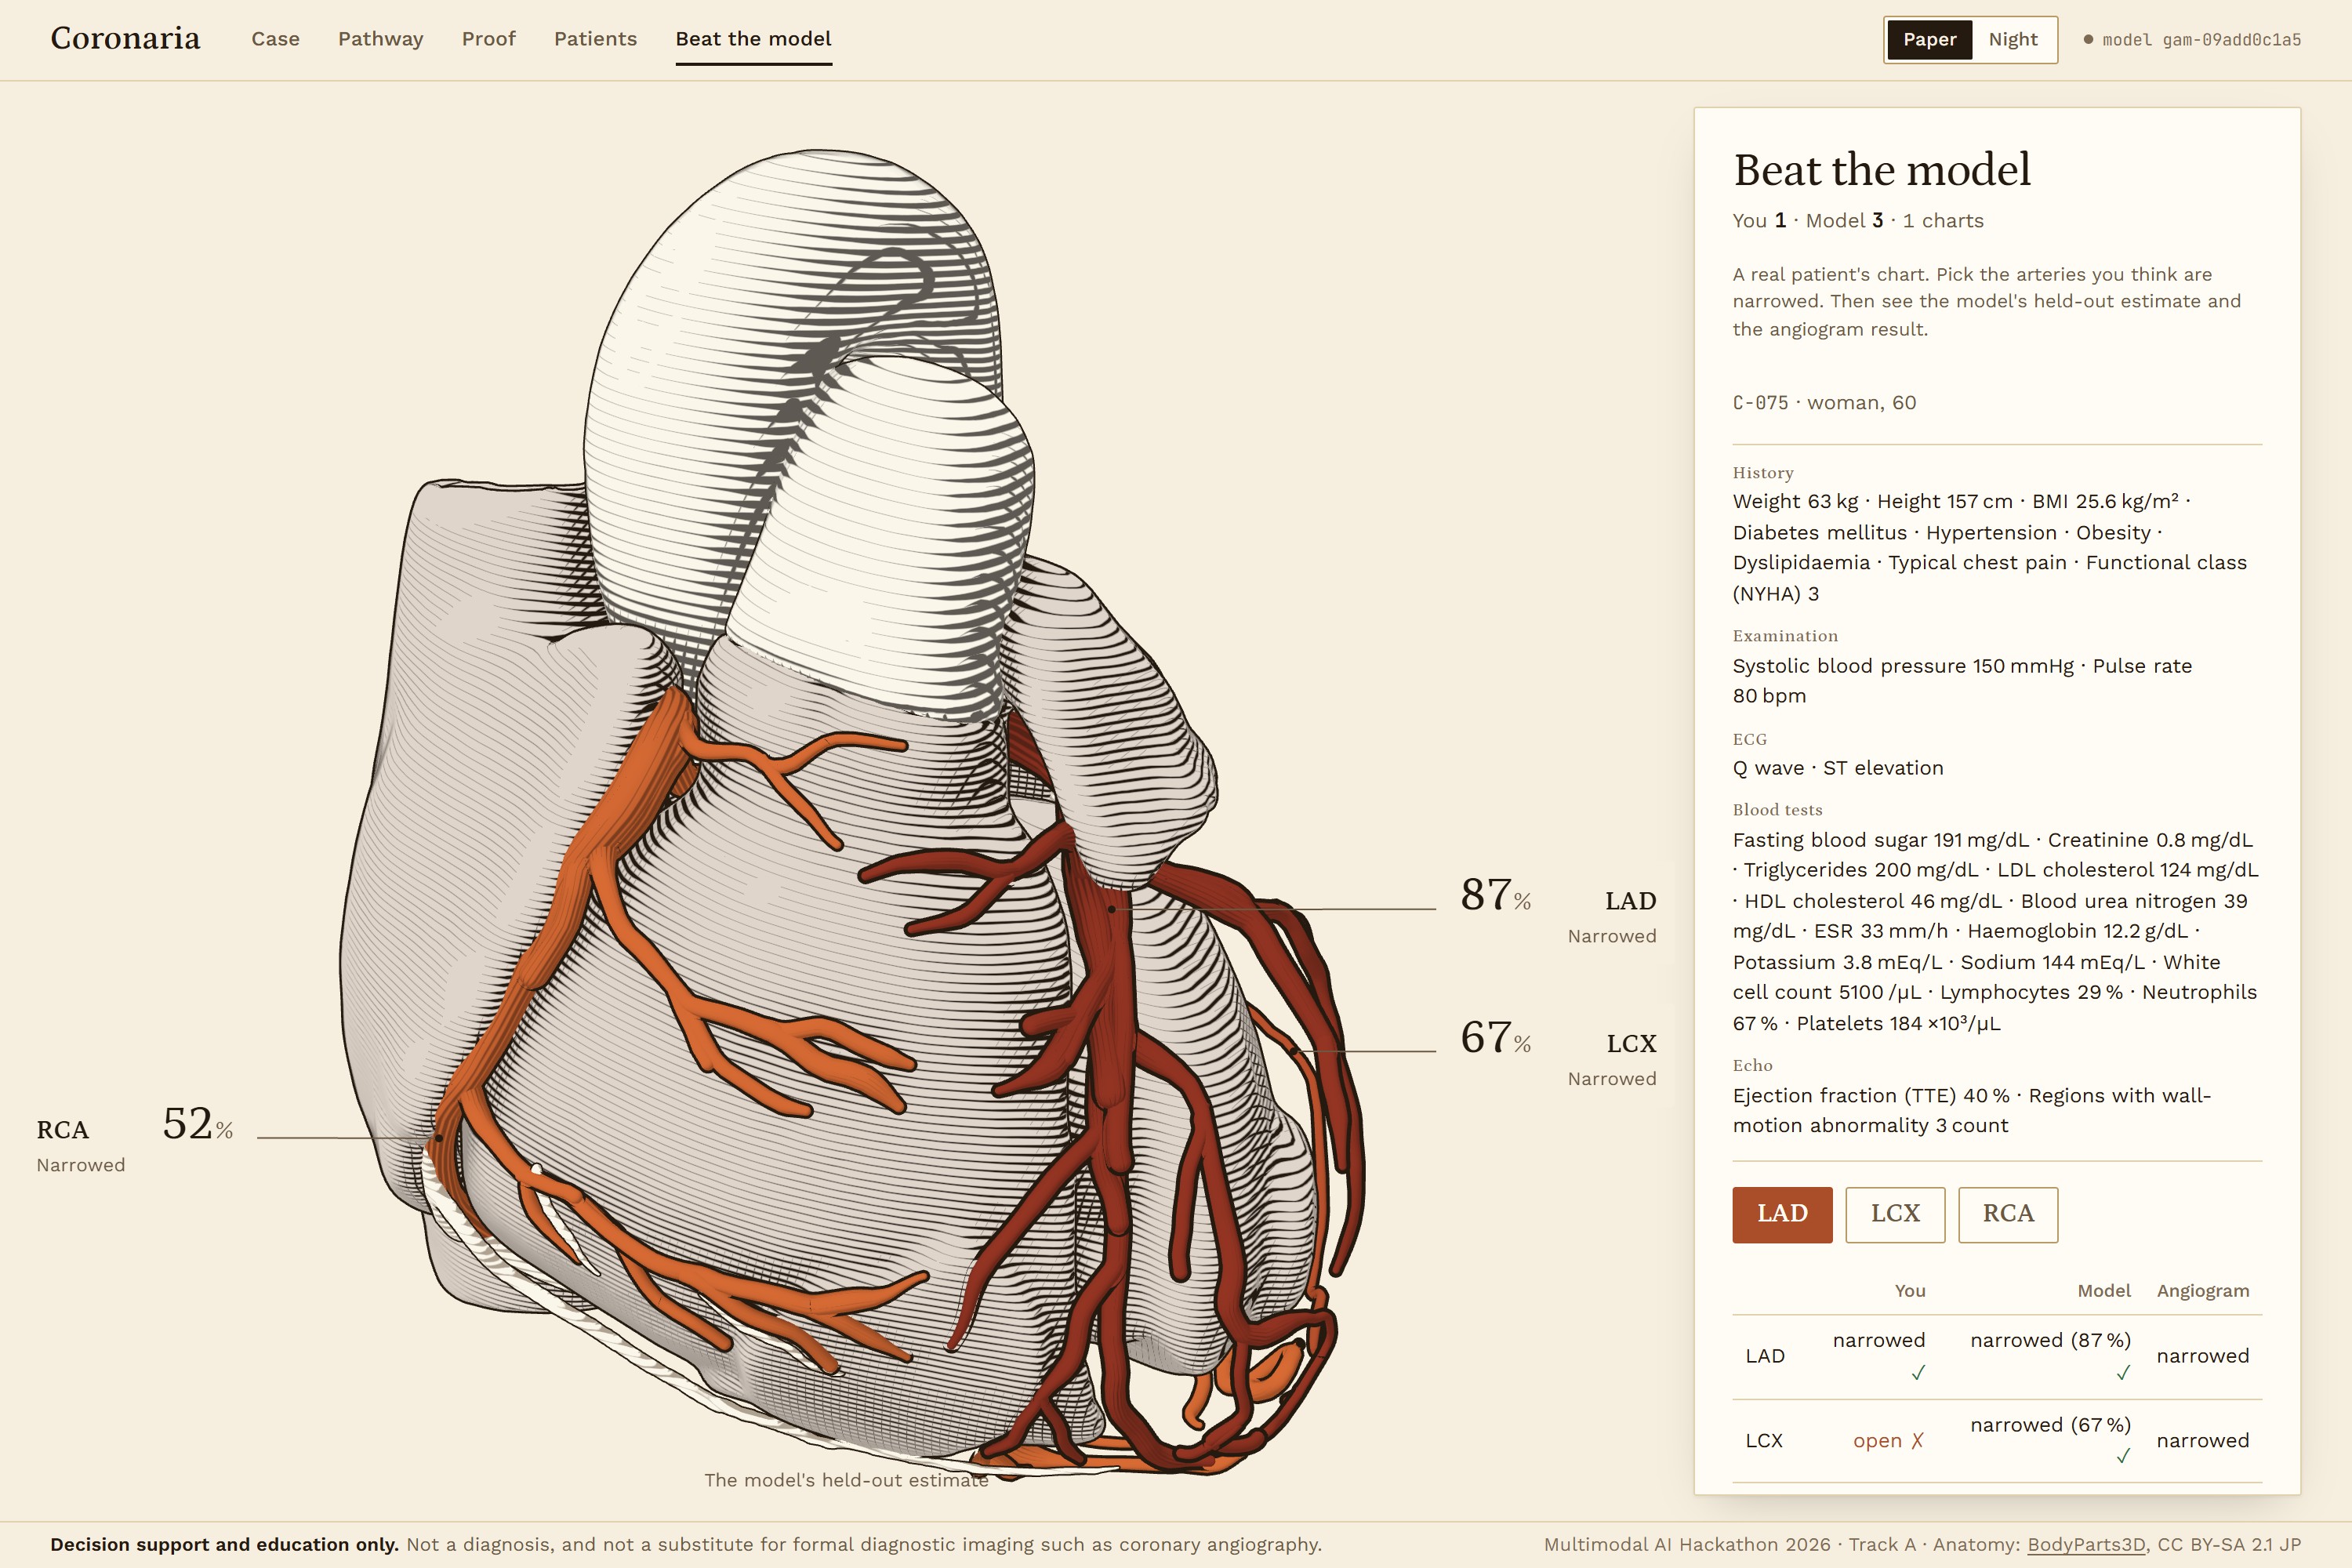
The panel shows P(CAD) and the stenosis probability for the LAD, LCX and RCA. The 3D heart, built from BodyParts3D meshes, colours each artery by its probability, and hatches it when the model can't tell. It beats at the patient's recorded pulse. Rotate it, zoom, click an artery, and you get the reasons behind that number. Each reason is split into two parts: what it does to the chance of disease at all, and what it does to where the disease sits. The same reasons can be grouped by body system.
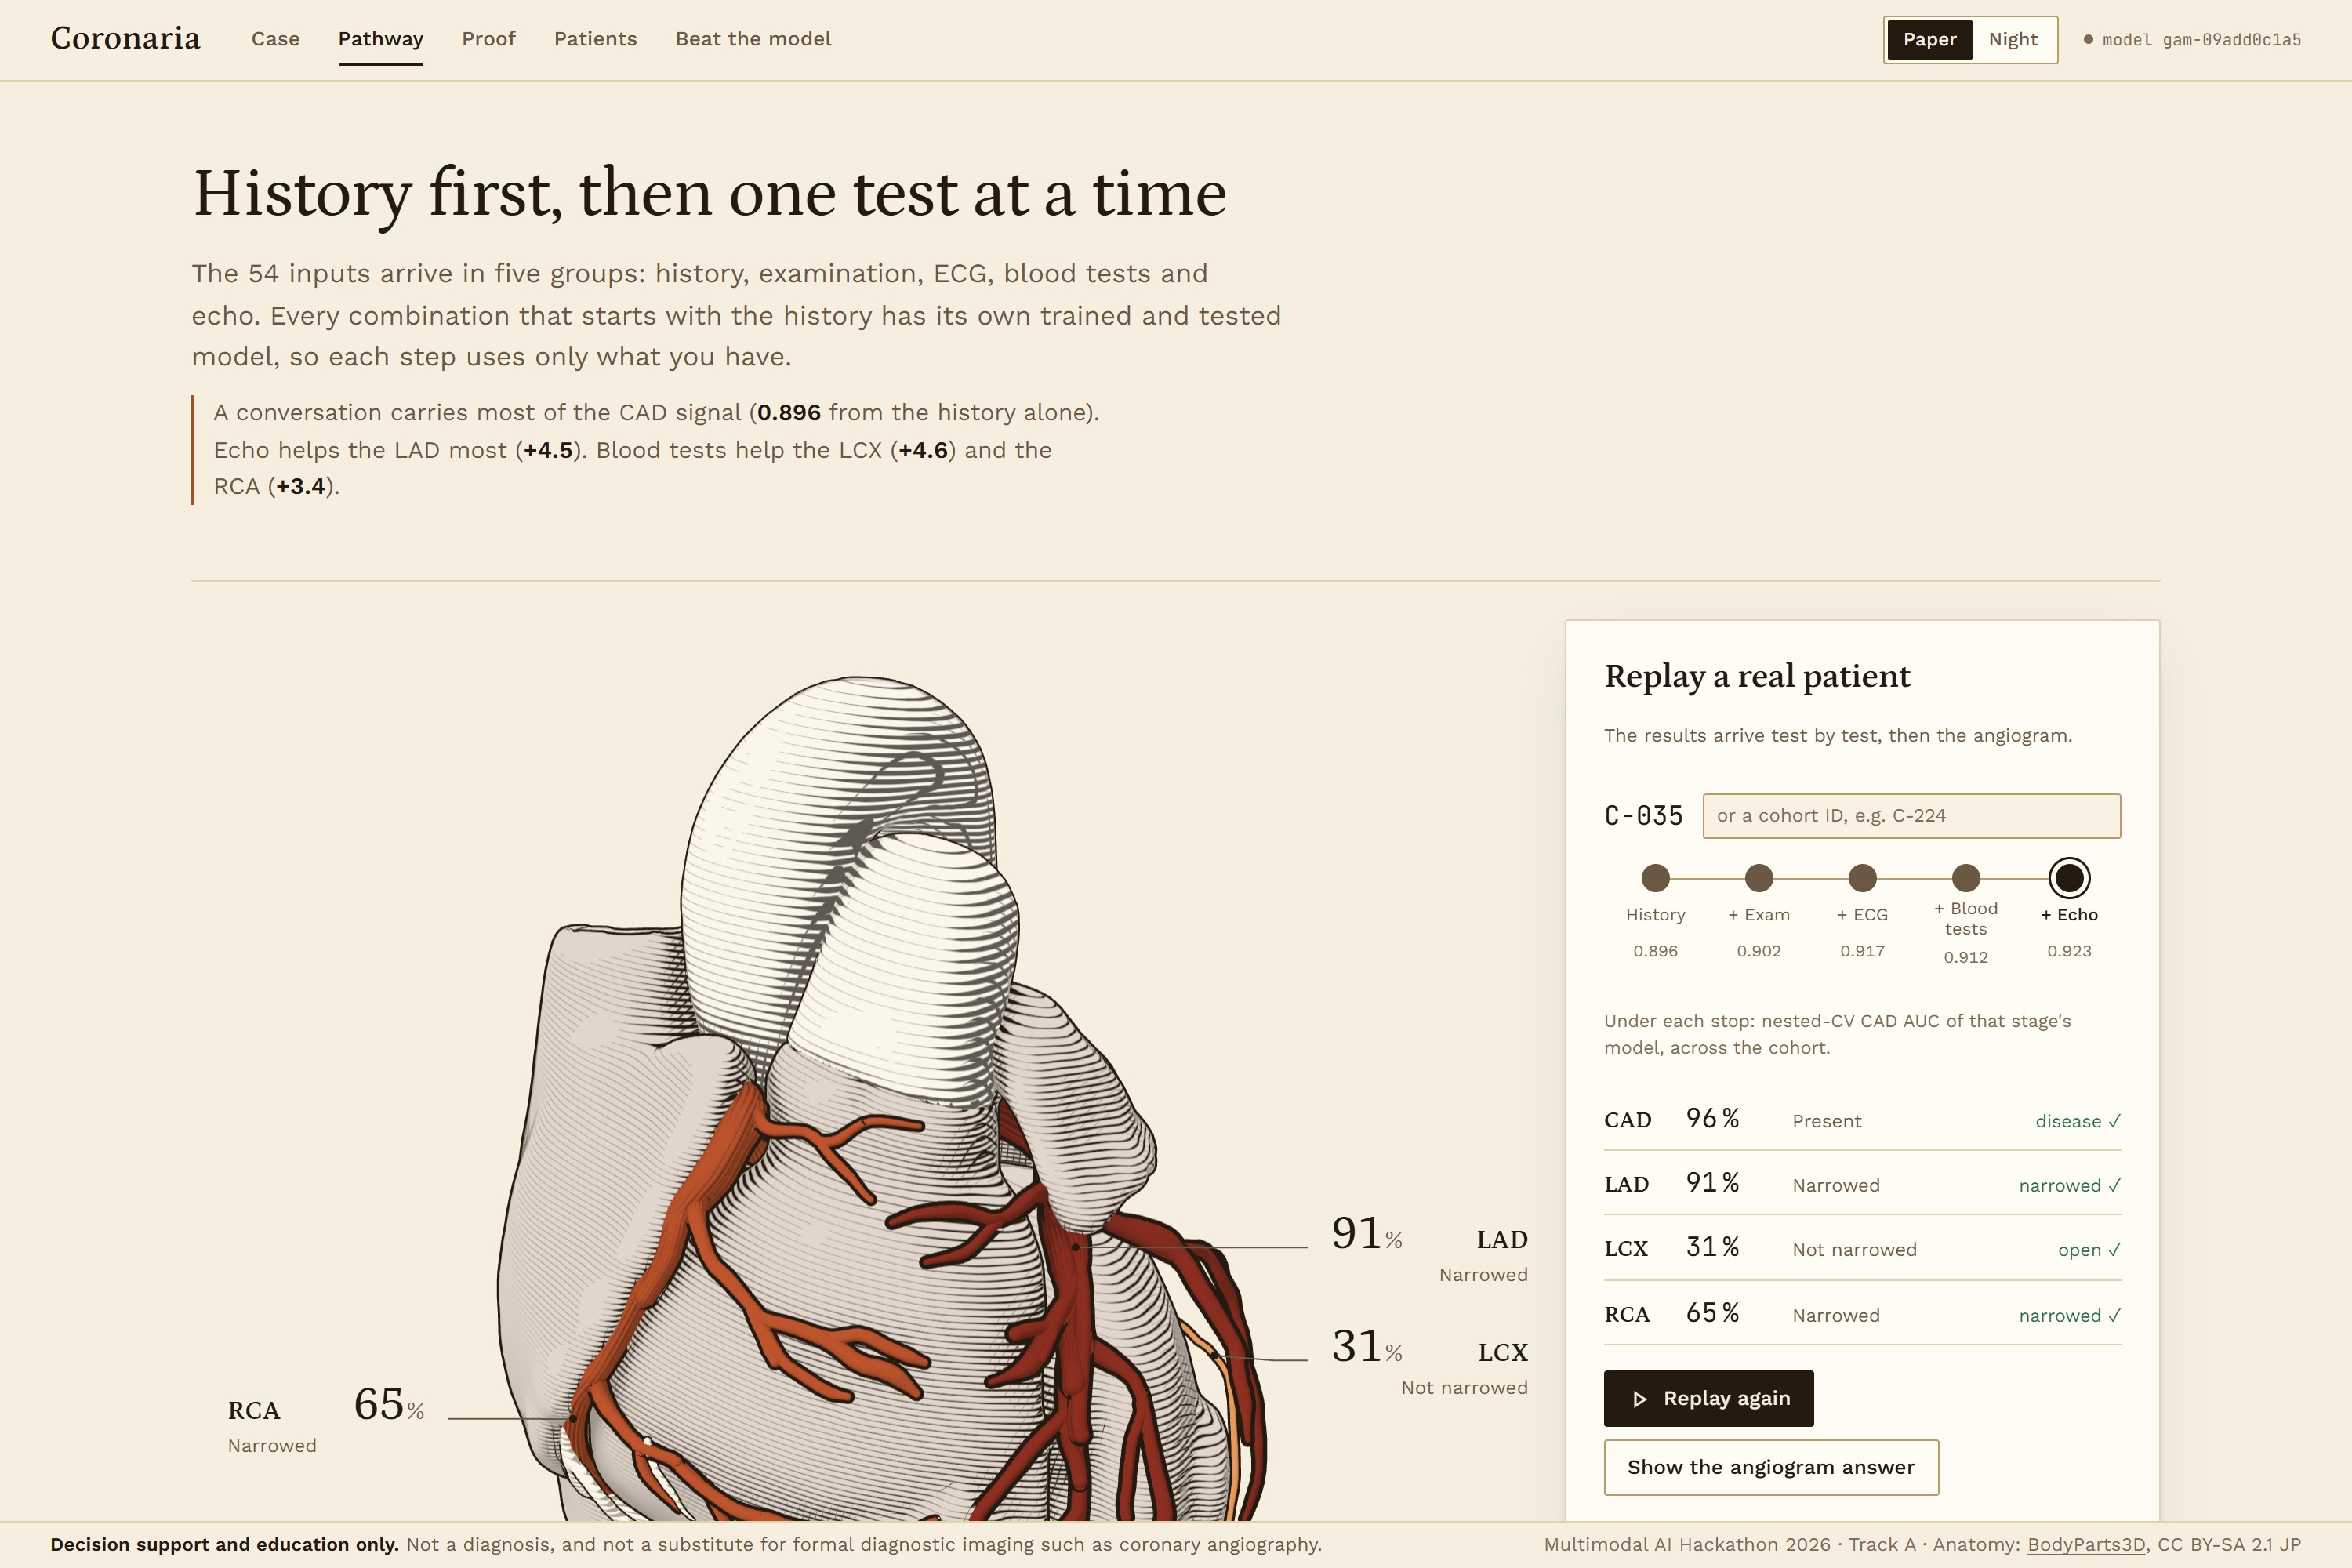
There is also a care pathway that replays a real patient test by test, a model card with every validation result, the 303 patients with their held-out estimates, and a game called Beat the model, where you pick the narrowed arteries before the angiogram result is shown.
Every page carries the disclaimer: decision support and education only, not a substitute for diagnostic imaging.
How we built it
The clinical model is a gated hierarchy. A gate \(g(x)\) predicts CAD. Three heads \(q_v(x)\), trained only on CAD-positive patients, predict where it is. The vessel probability is
$$P(v \mid x) = g(x)\,\frac{q_v(x)}{1-\prod_u \bigl(1-q_u(x)\bigr)}$$
so no artery can ever be rated above CAD, and nothing has to be clipped afterwards. Each factor averages an L2 logistic regression and a shallow XGBoost in logit space, then Platt-scales on out-of-fold margins. Since everything lives in logit space, the SHAP values are exact: coefficient times standardised value for the linear part, TreeSHAP for the trees.
Validation is nested cross-validation, 5 folds × 5 repeats, stratified on the 8 possible vessel patterns. Model selection, calibration, conformal calibration and the decision threshold are all chosen inside the training fold. LAD, LCX, RCA and Cath are never inputs; an assertion in the data loader stops the pipeline if one gets in. Class-conditional conformal prediction at \(\alpha = 0.1\) decides when an artery is hatched.
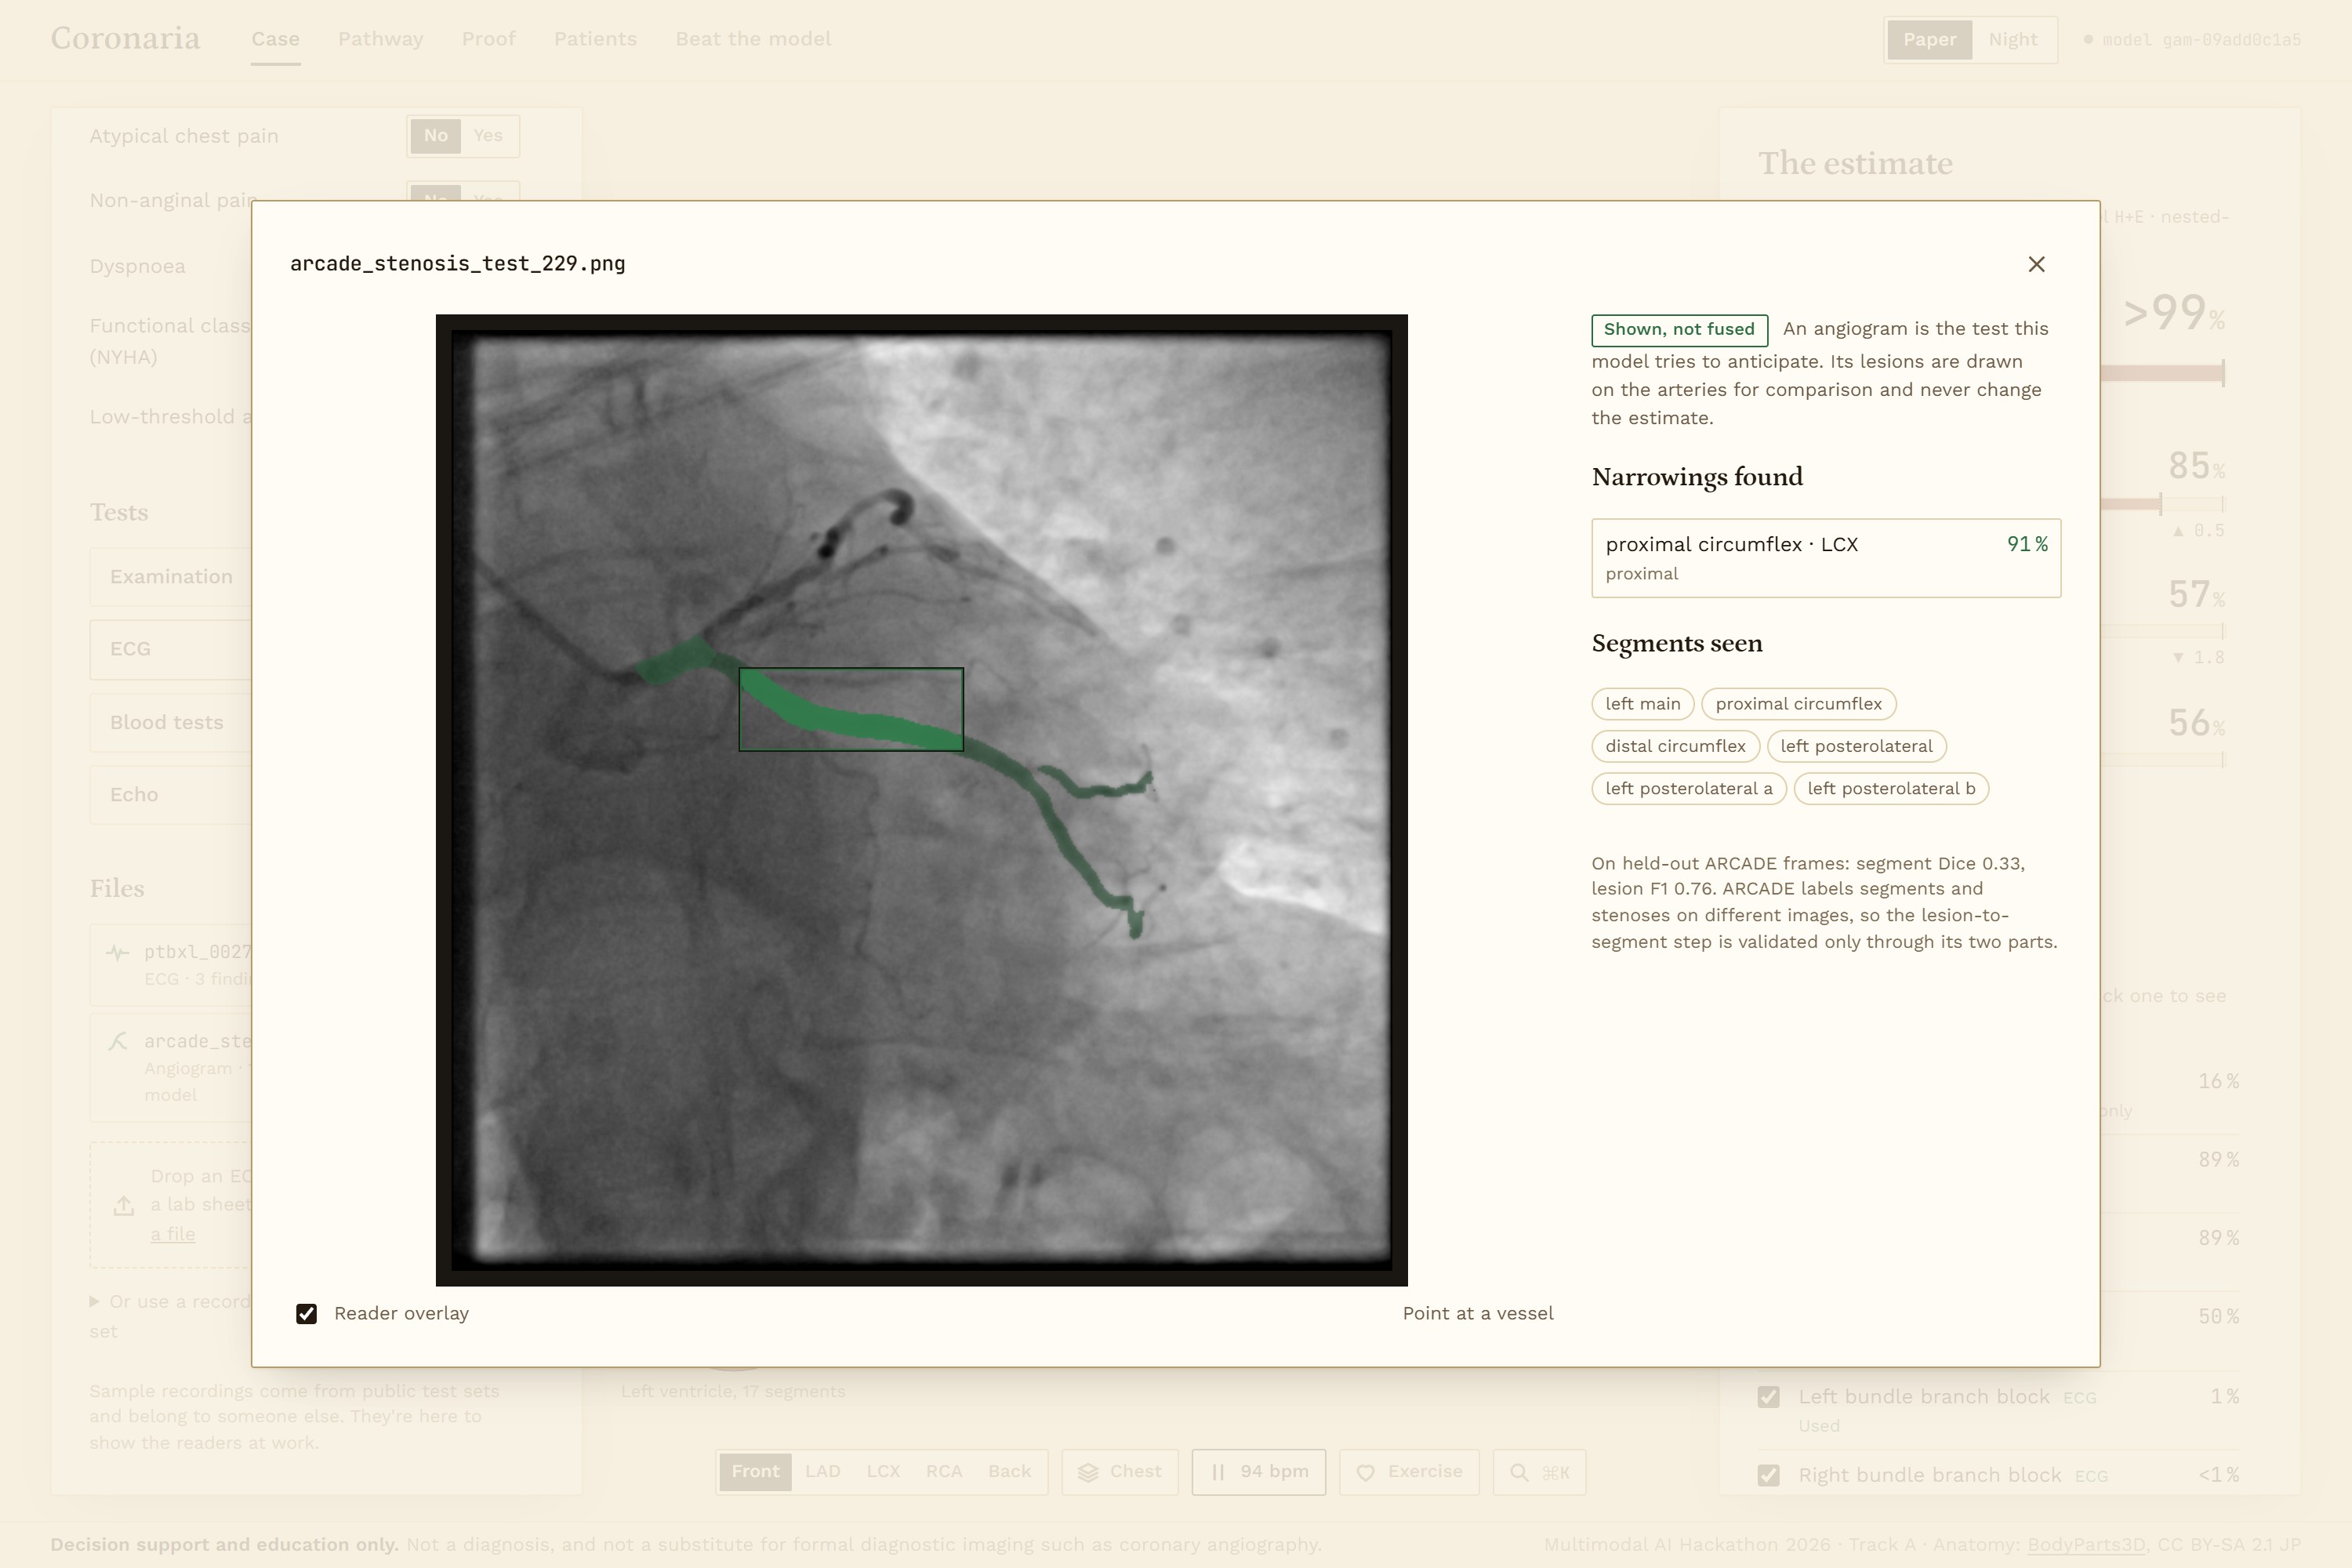
Two readers handle files. The ECG reader is a 1D ResNet trained on PTB-XL. The angiogram reader is a pair of U-Nets trained on ARCADE. Each is tested on its own held-out split. A reader output reaches the clinical model only if the model uses that feature and the reader's test AUC lower bound is at least 0.80. Its uncertainty is sampled 64 times, which gives the estimate a p10 to p90 band. The angiogram is the test the model is trying to anticipate, so its reading is drawn on the heart but never fed in.
GPT-4o mini reads histories and scanned reports. A history value survives only if its source phrase appears word for word in the text. Values from a report are proposals that a person has to accept.
The backend is FastAPI and SQLAlchemy on SQLite. Features, targets and anatomy are registry tables, so a new clinical feature is one line plus a retrain. The frontend is React 19 with React Three Fiber and custom shaders. There are 29 ML tests, 58 API tests and 66 frontend unit tests, plus a script that rebuilds every number in the README and report from the evaluation files and fails if any differs.
Challenges we ran into
The hardest one came from the data. Among CAD patients, clinical features locate the diseased artery barely better than chance: AUC 0.54 for the LAD, 0.58 for the LCX, 0.52 for the RCA. Most of each vessel's score is CAD detection. We chose to show this. It is why arteries get hatched and why every explanation separates "disease" from "location".
The ECG bridge failed in a way we only caught by running the whole chain. PTB-XL has T-wave inversion in 1.3% of records; our cohort has it in 29.7%. Calibrated to PTB-XL, the reader called T inversion in none of the cohort patients who had it. Every reader probability is now re-based to the cohort's prevalence. After the fix, CAD AUC with the network reading the ECG is 0.901, against 0.911 with a clinician's ECG coding and 0.896 from history alone.
No public dataset links ECGs or angiograms to these 303 patients, so end-to-end fusion can't be validated. That gap is the reason for the readers-plus-bridge design: each piece is tested where test data exists.
Smaller ones: the 16-subset care-pathway run died at fold 349 of 400 and had to be rerun with checkpoints. The BodyParts3D meshes had no normals, so the lighting came out as NaN. API latency hit 188 ms at p95 until we found the encoder inserting DataFrame columns one at a time. And one patient, C-094, is labelled no CAD with a stenotic LAD. We kept both labels and measured the effect: CAD AUC 0.932 with it relabelled, 0.935 with it removed.
Accomplishments that we're proud of
No contradictory patients, against 24% for four independent models, at the same AUC (CAD 0.923, LAD 0.836, LCX 0.728, RCA 0.709). Six standard model families run on the same folds show no significant AUC difference from ours, and every one of them rates some artery above CAD for 3 to 25% of patients.
A leakage check. Rebuilding the common published pipeline gives a leaky CAD AUC of 0.946 against an honest 0.890. Over 100 random 80/20 splits, RCA accuracy ranges from 44% to 75%, depending only on the split.
Validation outside Tehran. A reduced model on the six inputs shared with the UCI Heart Disease centres scores 0.775 on 770 of their patients.
A price on every test. Echo adds 4.5 AUC points to the LAD. Blood labs add 4.6 to the LCX and 3.4 to the RCA, and nothing measurable to CAD.
What we learned
On 303 patients, validation choices move the numbers more than model choice does. Tuning bought us almost nothing. Selecting features in the wrong place would have "bought" five AUC points that don't exist.
A reader can score well on its own test set and still fail on another population whose base rates differ. You have to test the chain as well as the links.
Risk factors don't always point the way you expect. LDL and BMI are lower in this cohort's CAD patients, most likely because they are already on treatment, so the what-if panel flags them instead of offering them as levers.
What's next for Coronaria
The next step needs data more than code: ECGs, angiograms and clinical records from the same patients, so the fusion can be validated end to end. Region-level wall-motion data would let RWMA appear on the heart as a place instead of a count. After that, testing at more centres and on more low-end laptops with integrated graphics.
Built With
- bodyparts3d
- d3.js
- fastapi
- gpt-4o-mini
- gsap
- numpy
- openai
- pandas
- playwright
- ptb-xl
- python
- pytorch
- react
- react-three-fiber
- scikit-learn
- sqlalchemy
- sqlite
- three.js
- typescript
- vite
- vitest
- web-speech-api
- xgboost
- zustand

Log in or sign up for Devpost to join the conversation.