-
-

Company Logo
-
Functions Demo
-

Smiles and waves!


Inspiration
Covid 19 has made understanding how customers are behaving a nightmare! People are behaving erratically, choosing different days and times to go into the city, alternative modes of transport, and ordering more things remotely. As a business owner, it can be challenging to understand how demand is changing, how many roles of toilet paper should I supply? How many staff should I hire? How many people will be buying coffee? Where is the next big event taking place? …
What it does
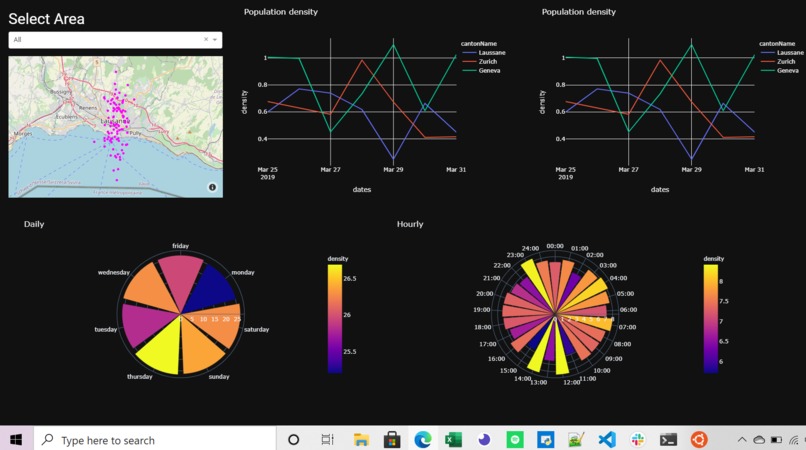
Our solution provides a tool for you, the business owner, that helps you understand how your demand is changing in real time. We have partnered with Swisscom to develop our solution. The product provides you with an easy to use format, alerting you to demand surges and drops in your local area, all on your mobile phone.
Check it out for yourself here! link
How I built it
We built solution with passion and love of data! It is created on top of python, pandas and visualize prettily using dask & plotly. We deploy our solution into a production ready stage on top Azure.
Rather than depends on tech-stack we also think really deeply on the benefit of our product to the business.
Challenges I ran into
There has been a lot of challenges during this one and a half day coding. We are facing a problem during ingesting the data and getting the front-end ready. The multi-dimensional data in a large amount is also challenging to be prepared for analysis and valuable insights.
Accomplishments that I'm proud of
We have learned that there is nothing impossible -- regardless the challenges and problems we are faced with and specially with the short time span & sleepiness, we are able to finish and create a wonderful product.
Even though half of our team are working remotely from all over the globe, we connect naturally and warmly, and work harmonically together.
What I learned
We learn the value of data! it is a new oil! We learn that data provided by Swisscom has a lot of potential for analysis beyond tele-communications. They are available for business intelligence, social/economical studies, traffic planning, etc. They can be precious to all sectors and individuals. We also learn a lot about data visualisation and data-cleansing. What data to select/drop to be able to give insights? What data to present to our target audience? What kind of visualisations might be more understandable and straightforward? When trying to answer these questions for our audience, we also learn by ourselves about data science philosophies.
What's next for INDEMAND
We are willing to build a more mature business product from here! Be it with more/more types of data, more complex-in-model yet simple-for-perception data visualisations, smoother UI, etc. We simply wish to closer the gap between BI (business intelligence) and the non-experts.
![]()
Built With
- swisscom


Log in or sign up for Devpost to join the conversation.