-
-
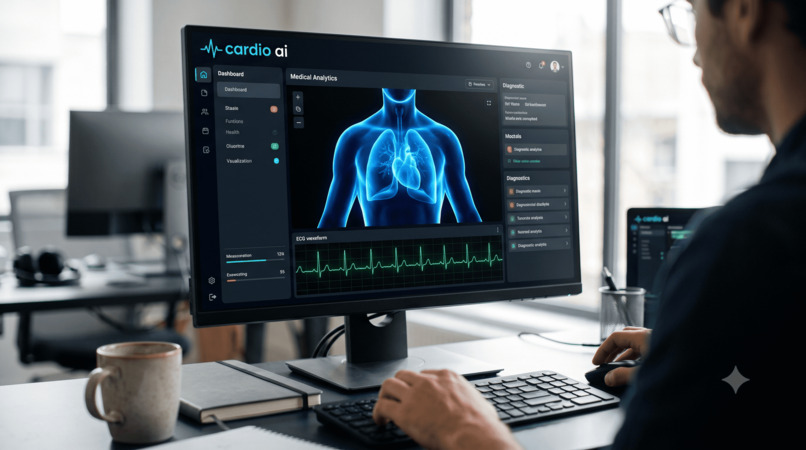
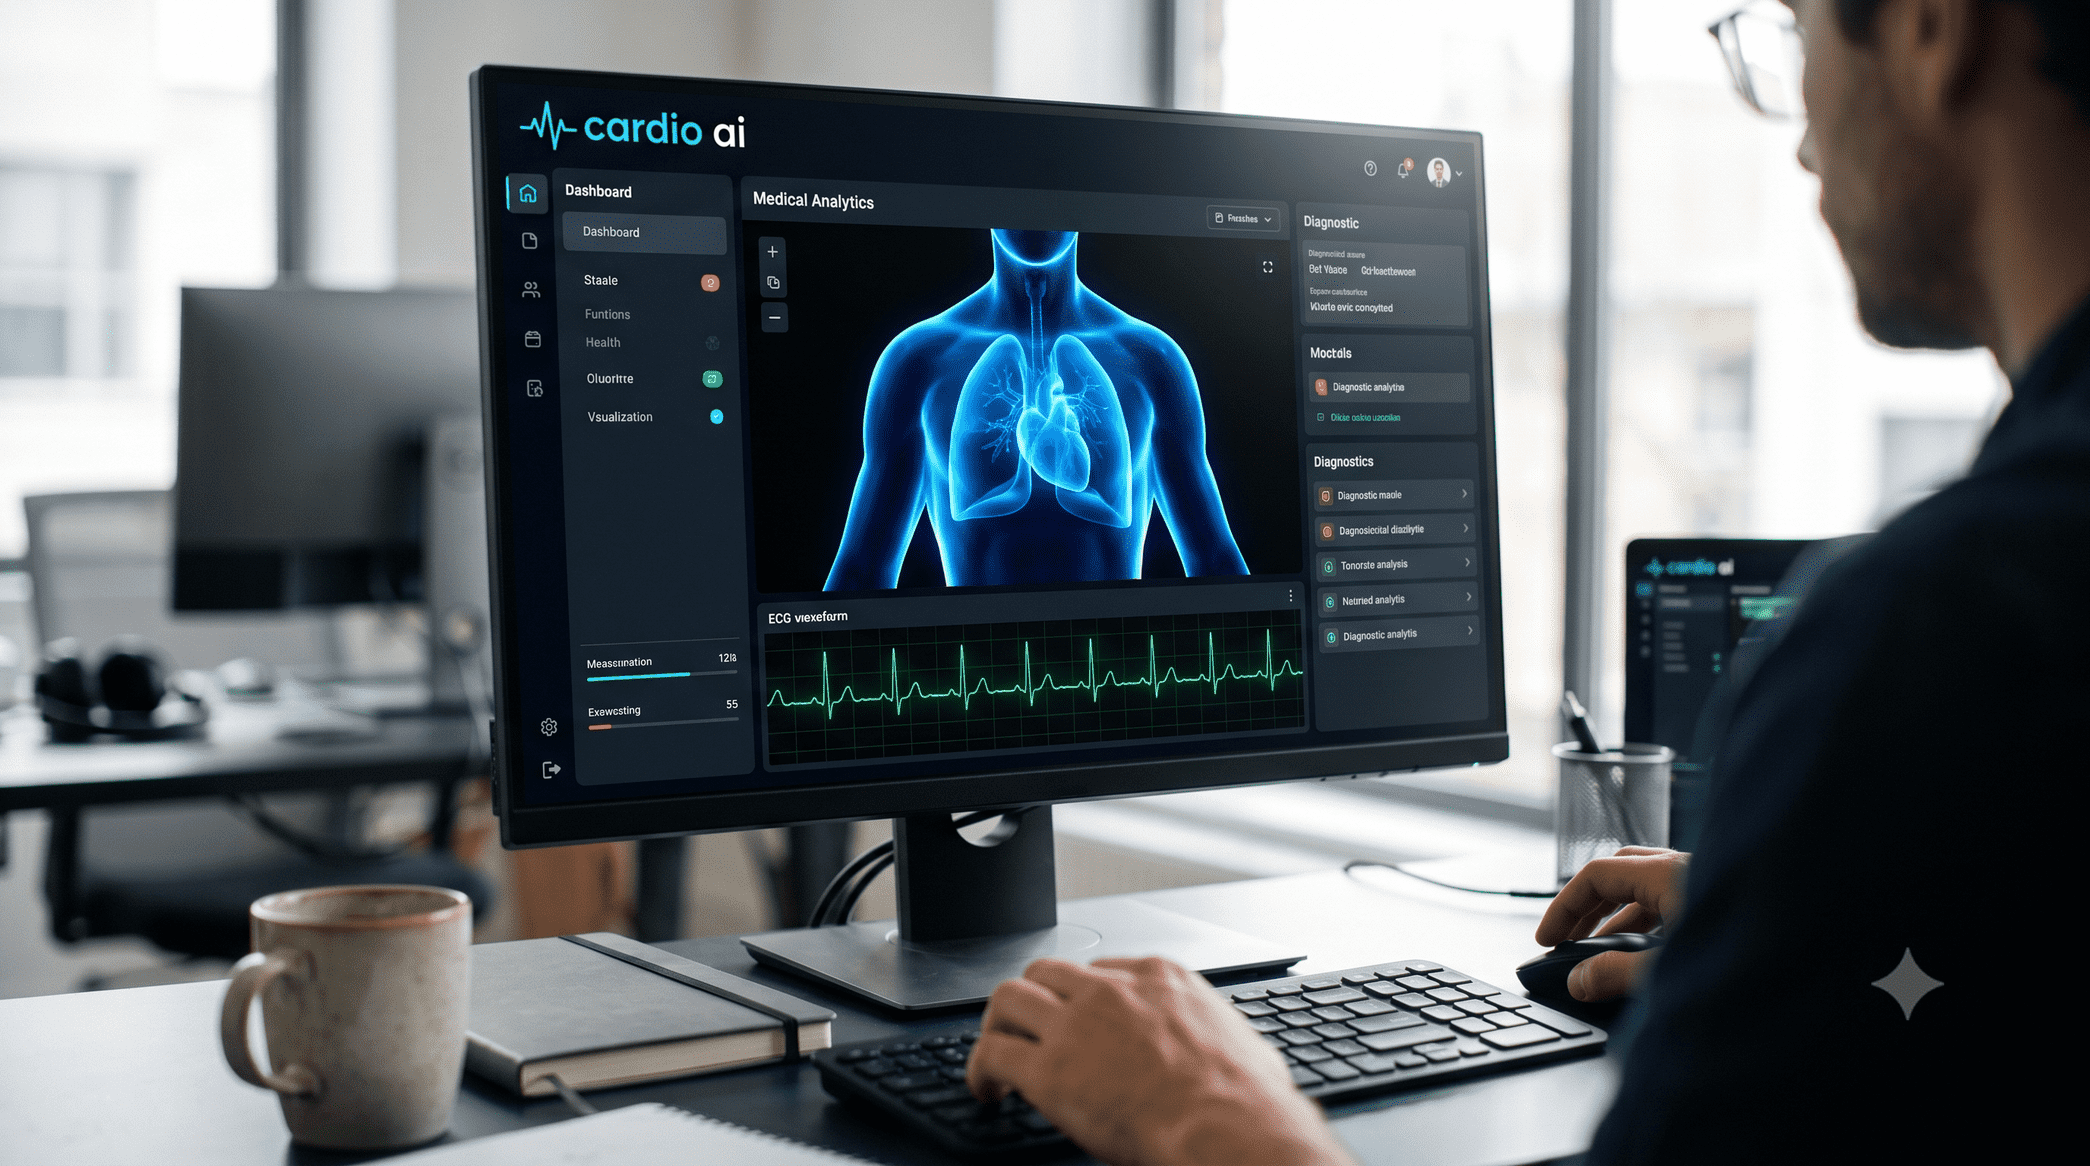
CardioAI: A 3D visual assistant mapping ML predictions onto the heart to help doctors assess and explain cardiovascular risk.
-
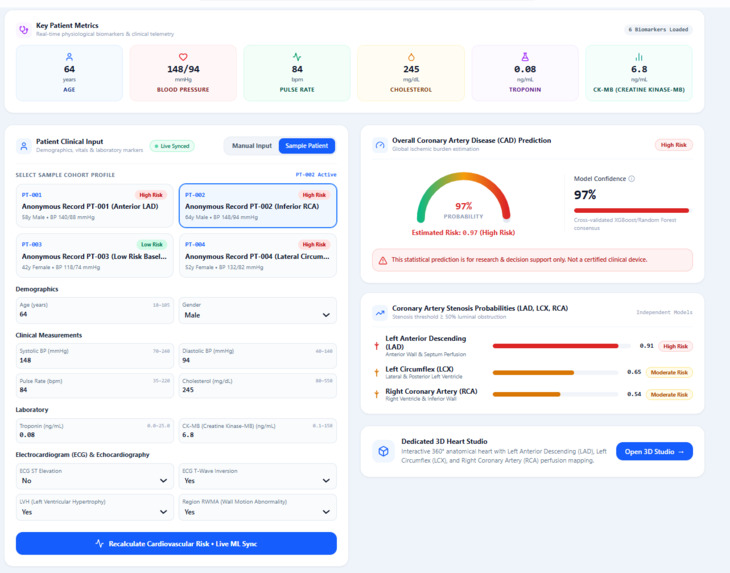
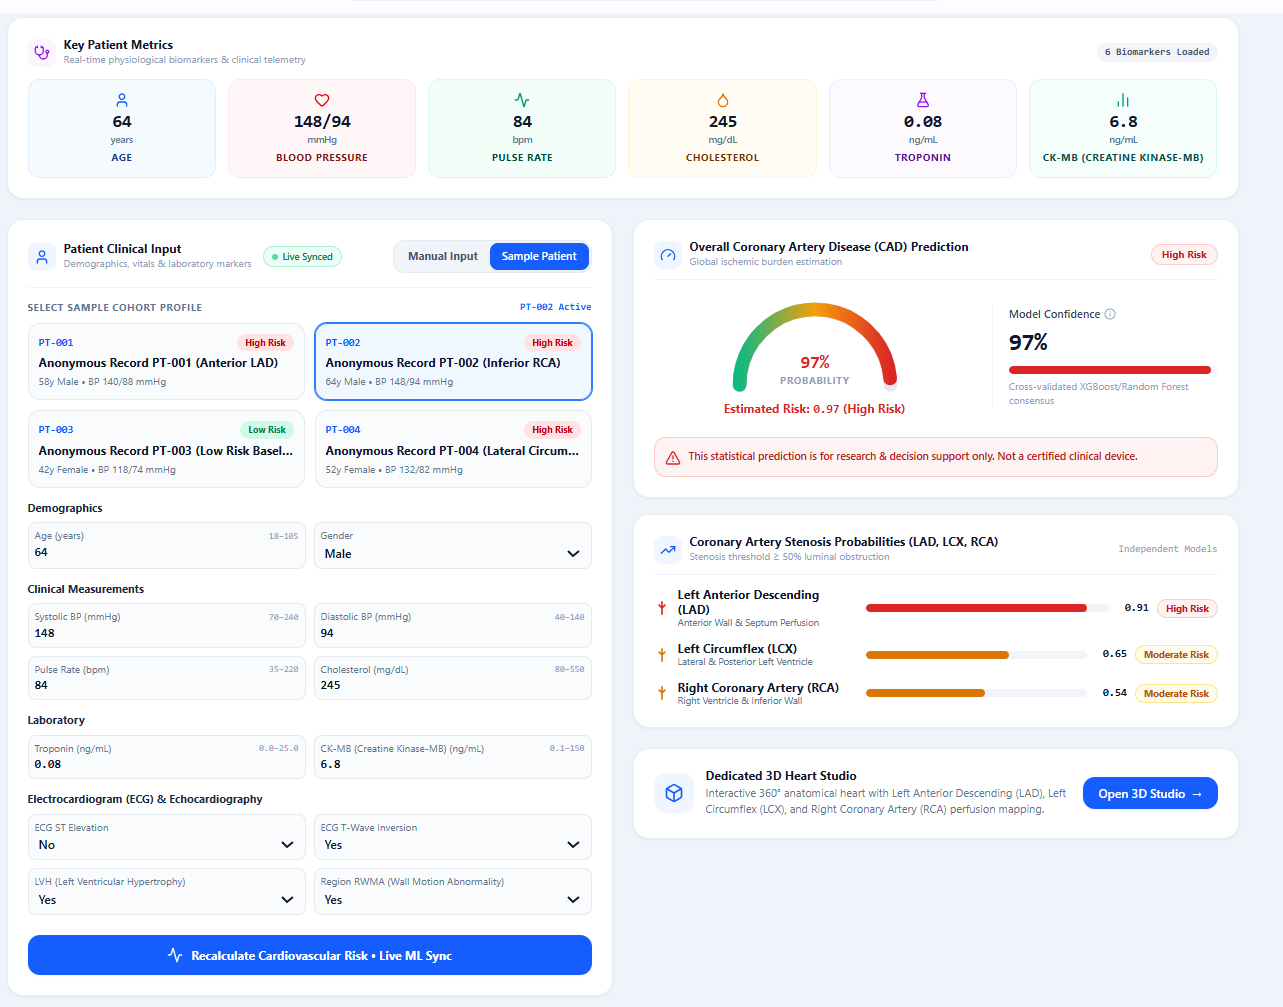
Risk prediction of a sample patient
-
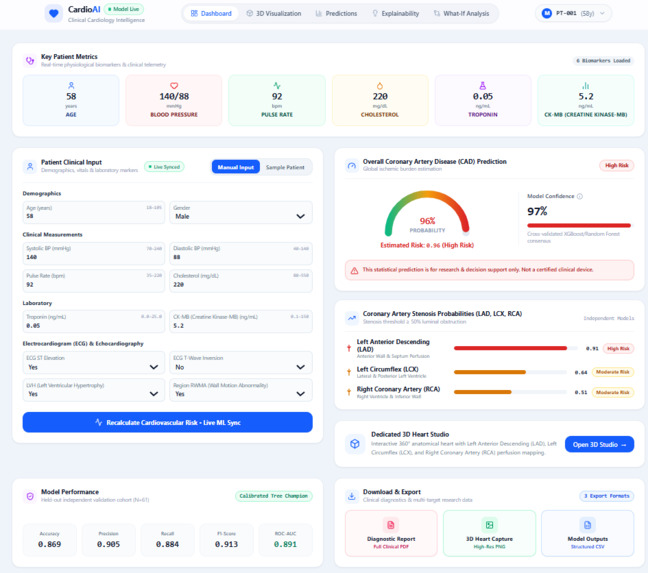
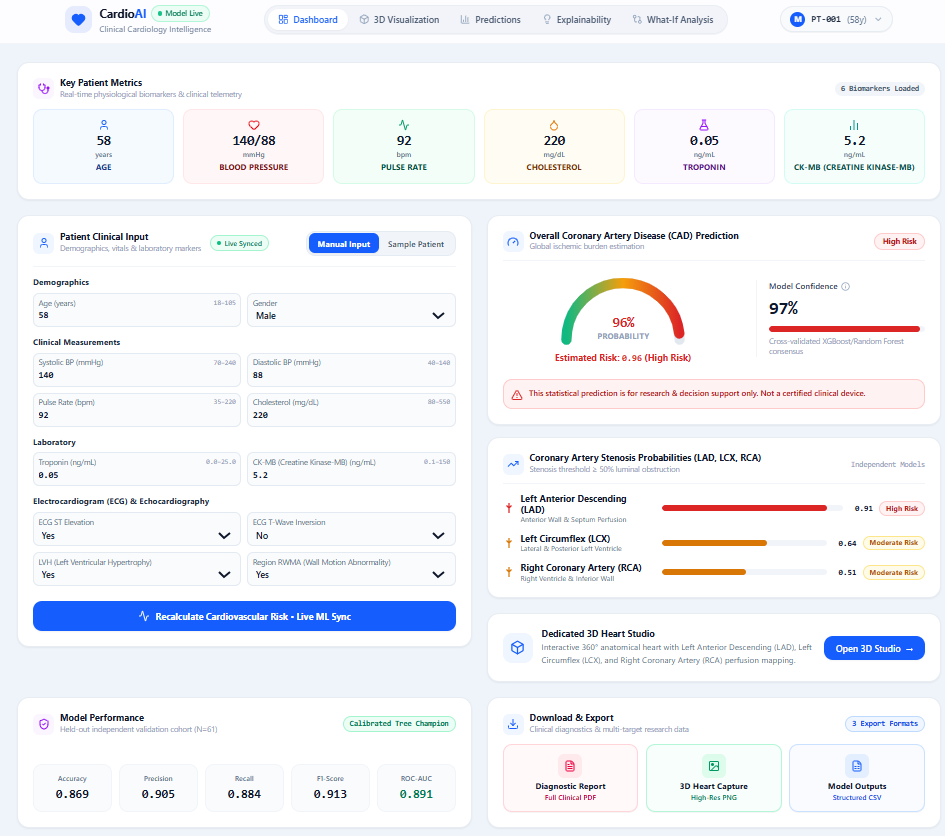
Risk prediction of a sample patient
-
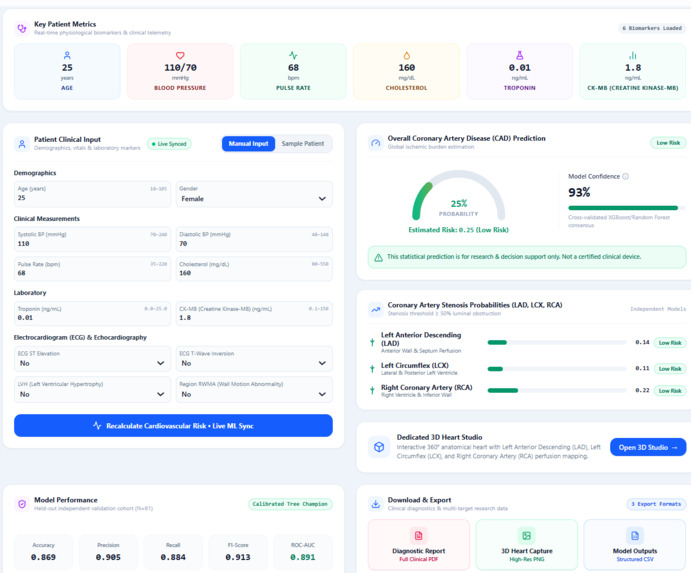
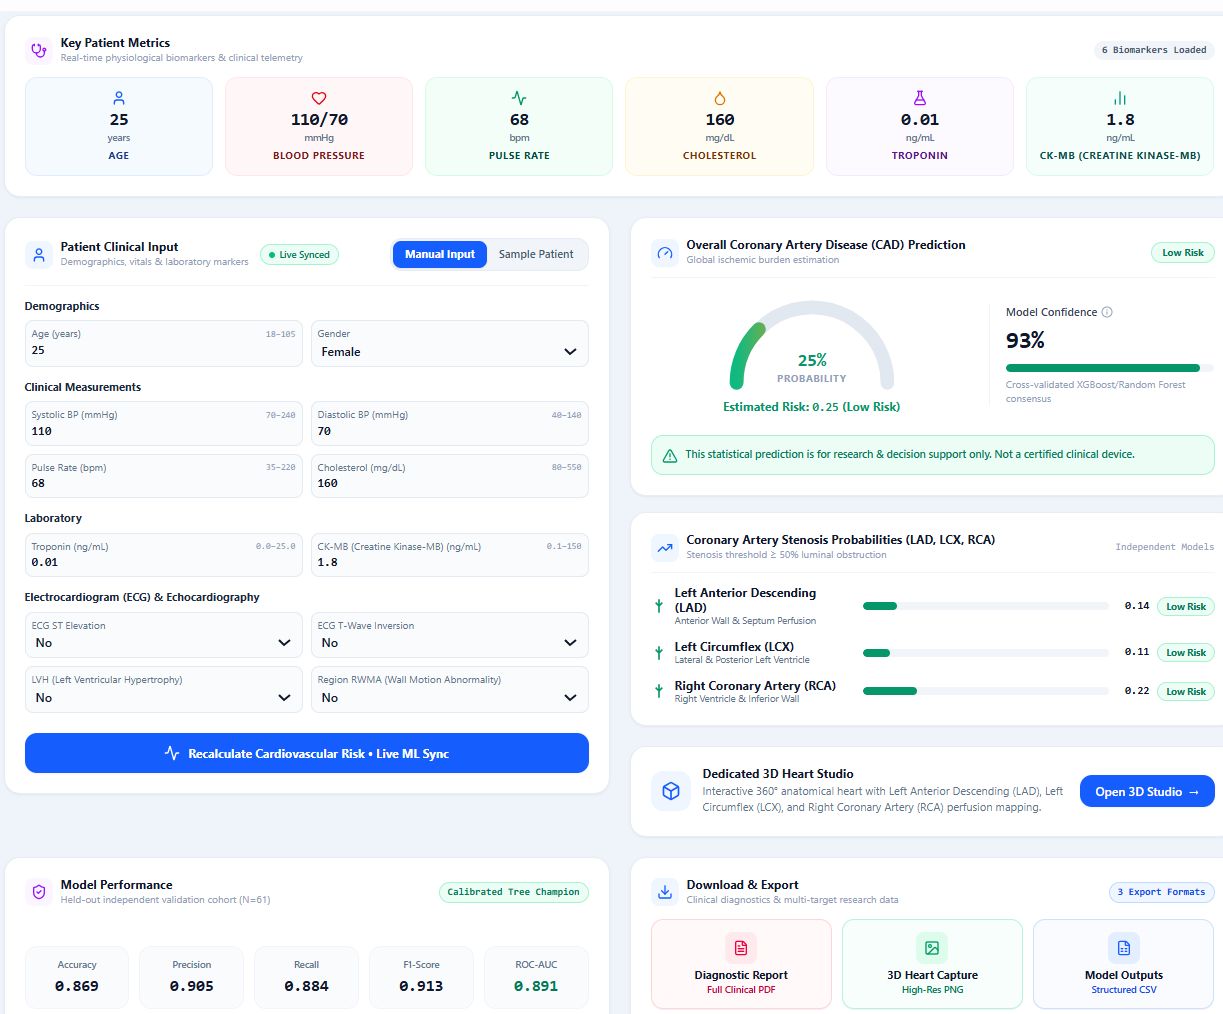
We can also predict the risk by manual inputs
-
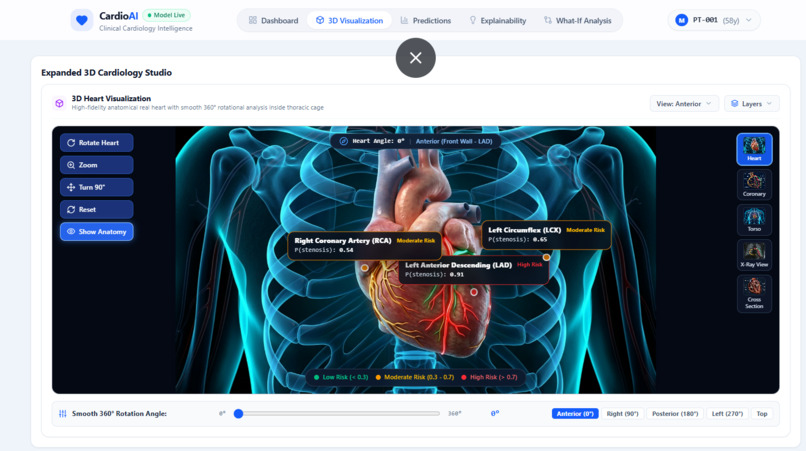
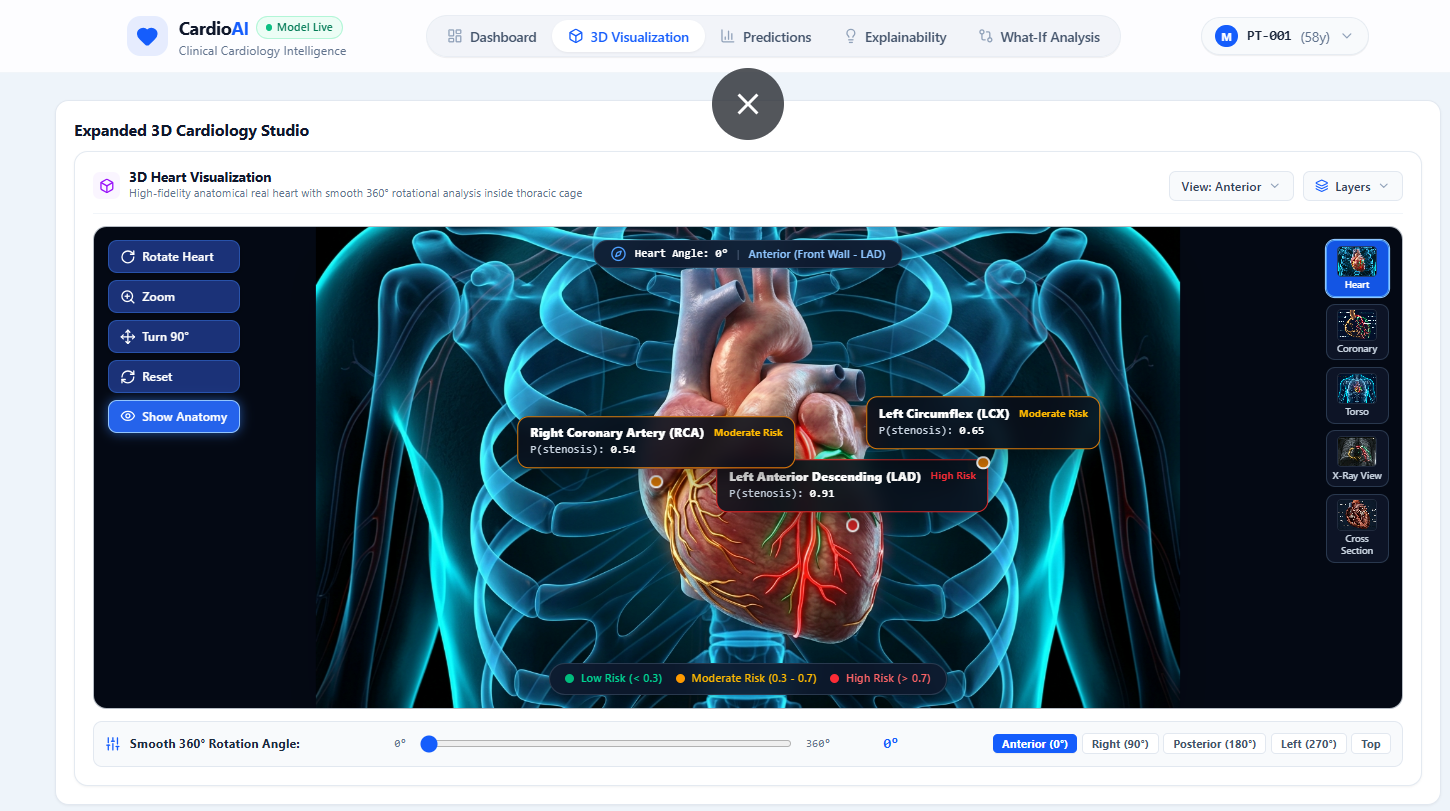
3D Heart visualization supported by rotation
-
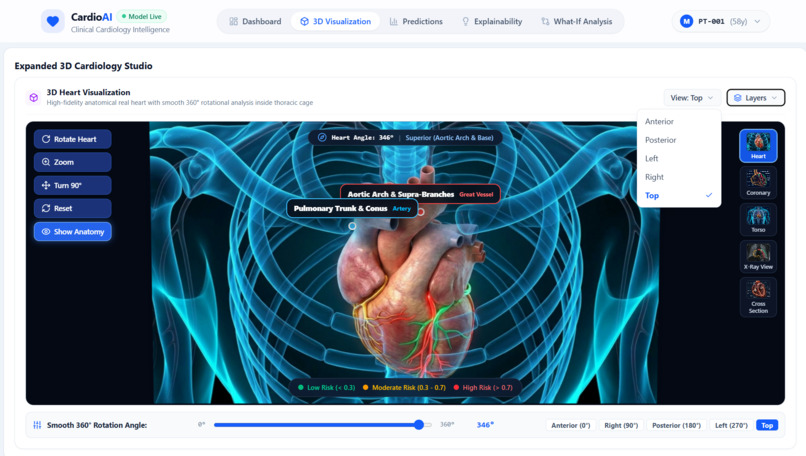
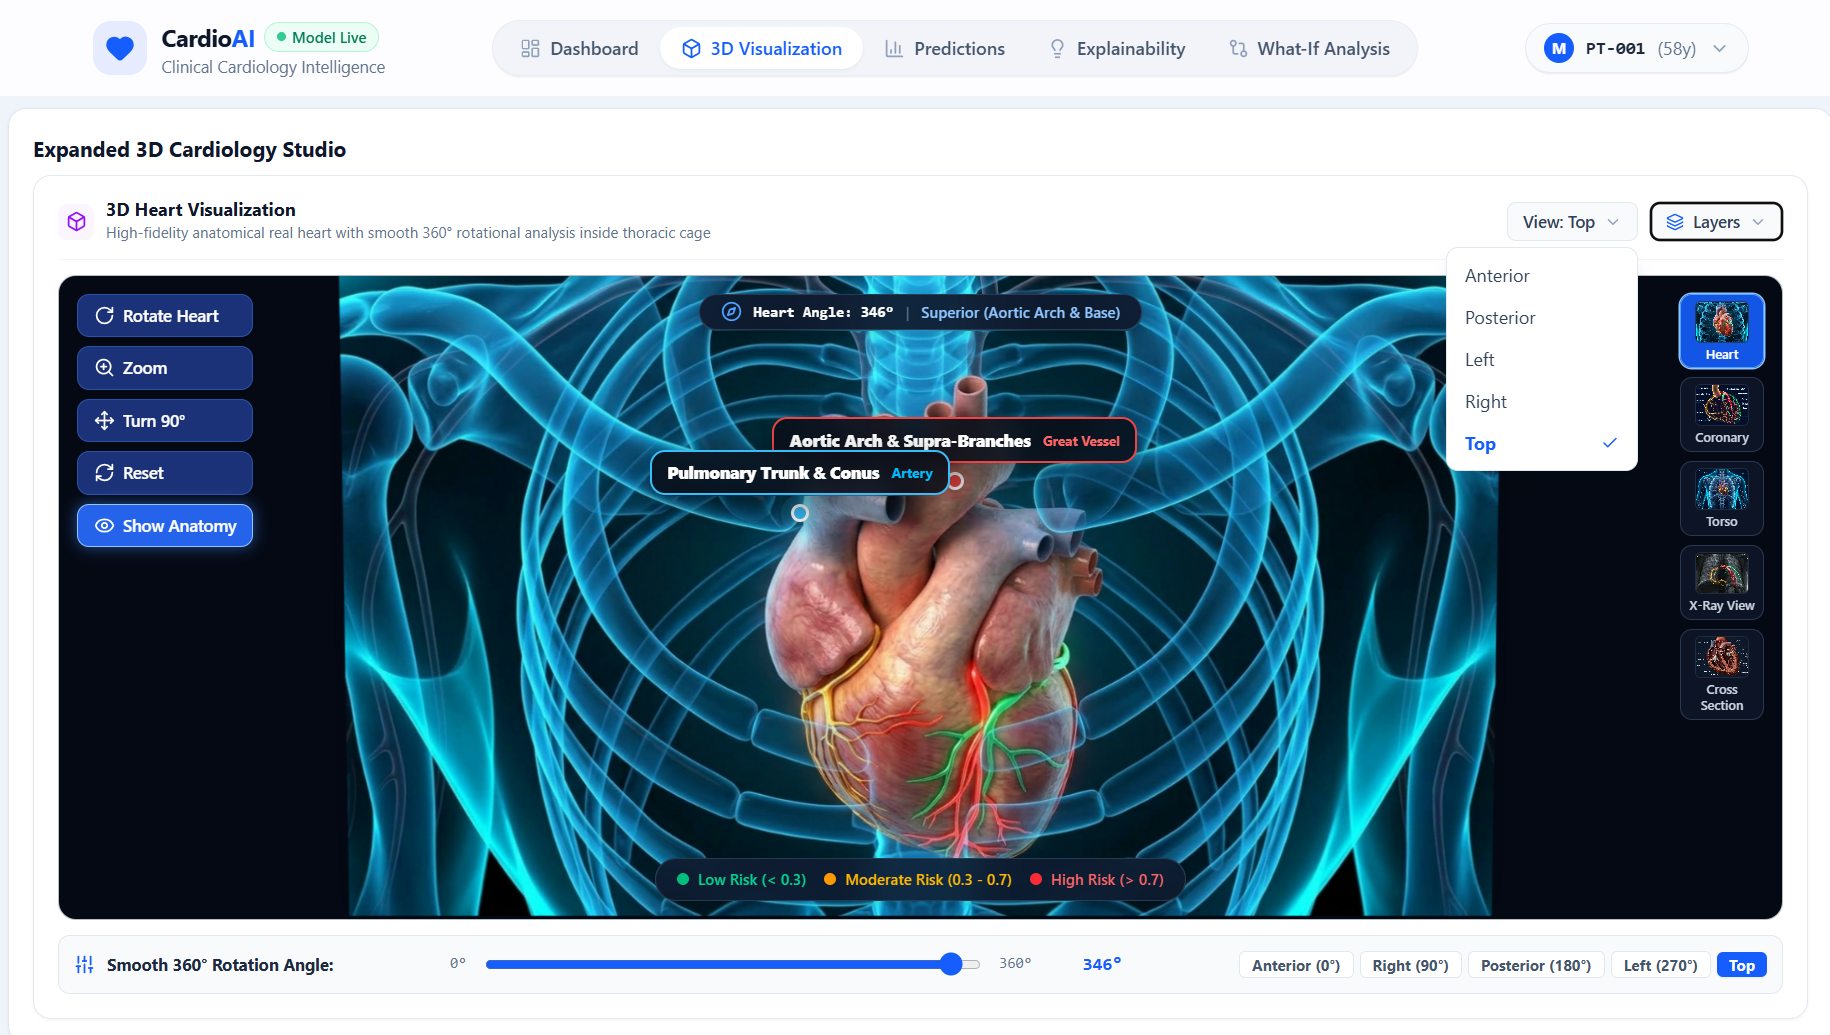
Top view of the heart
-
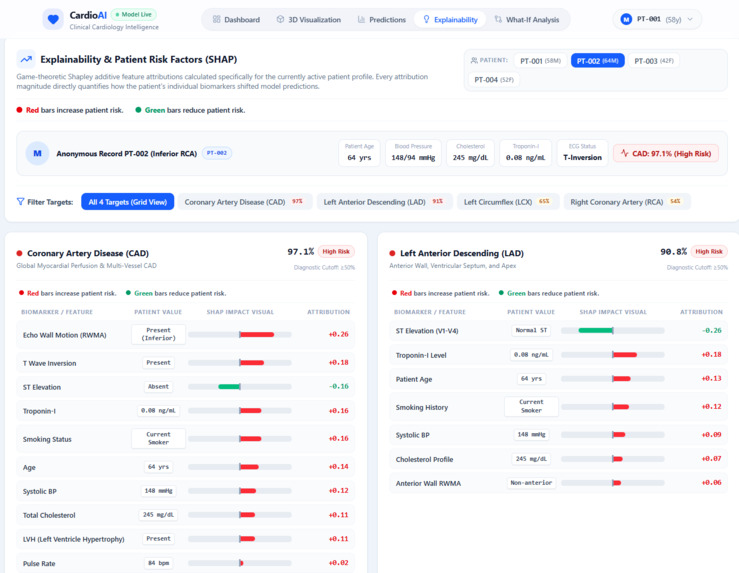
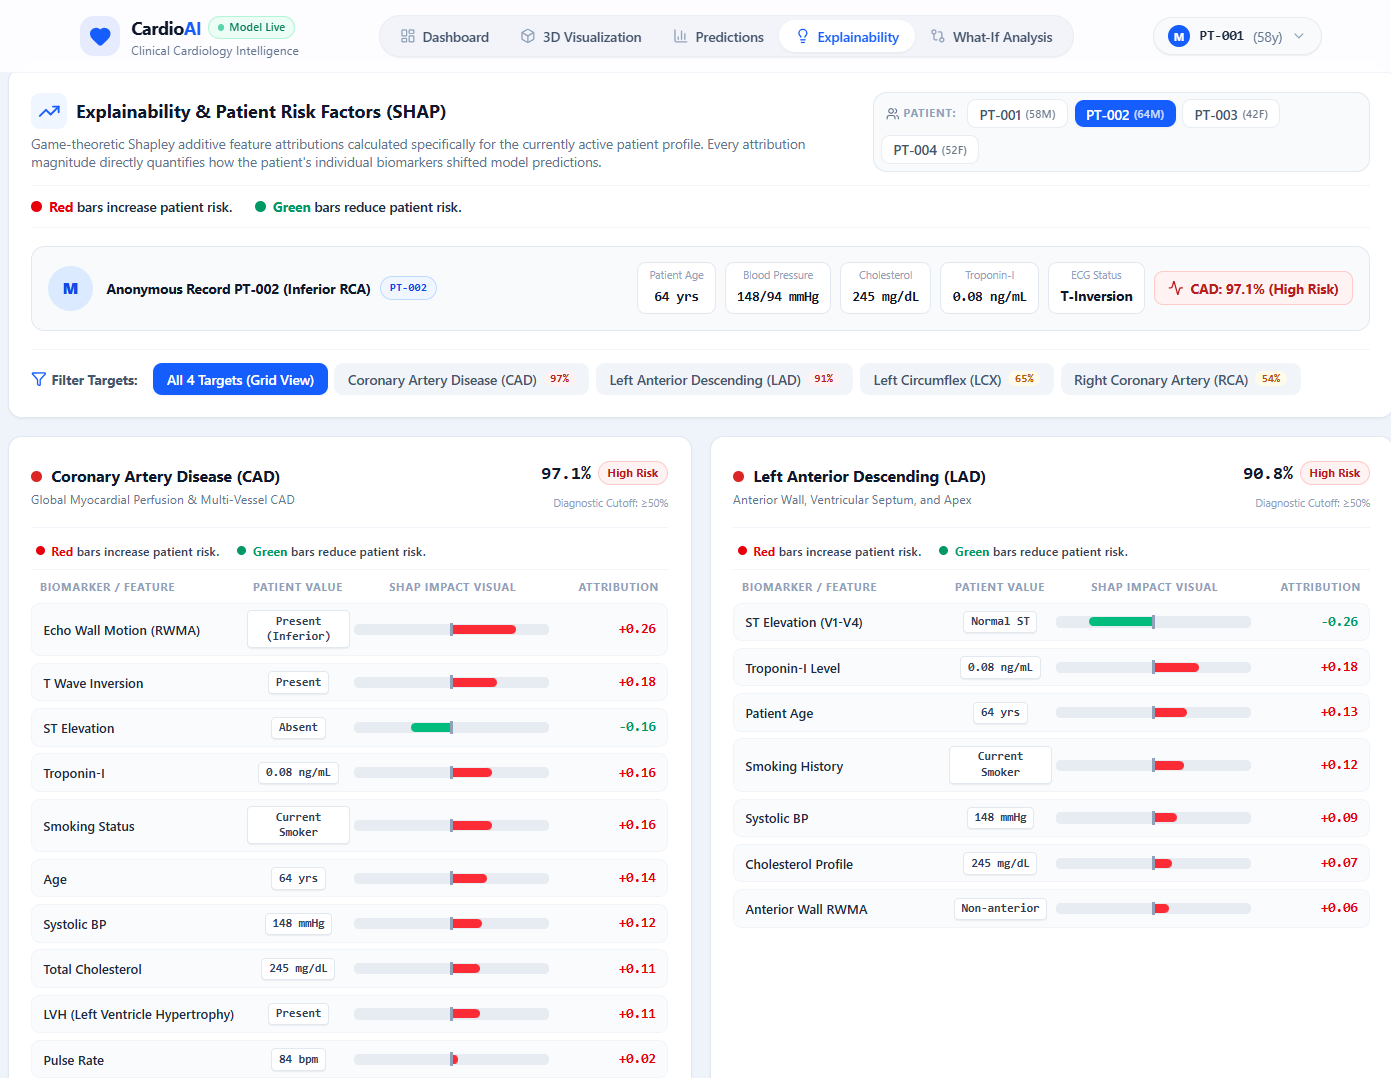
Detailed explaination of CAD and LAD
-
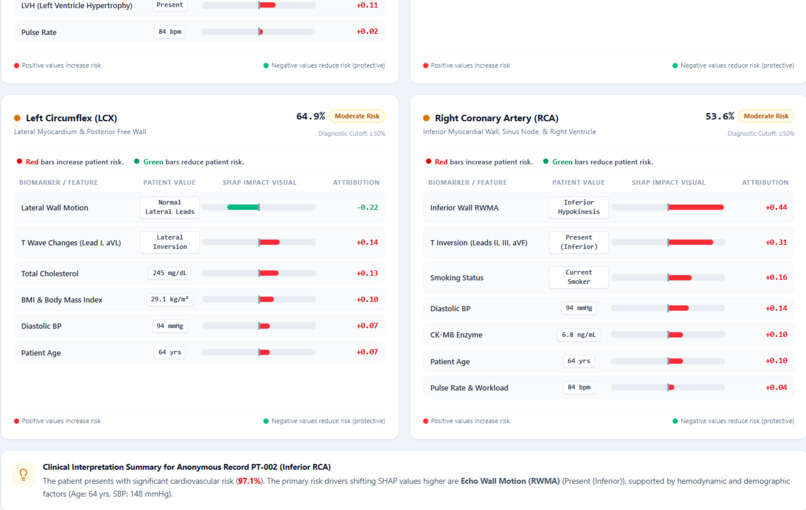
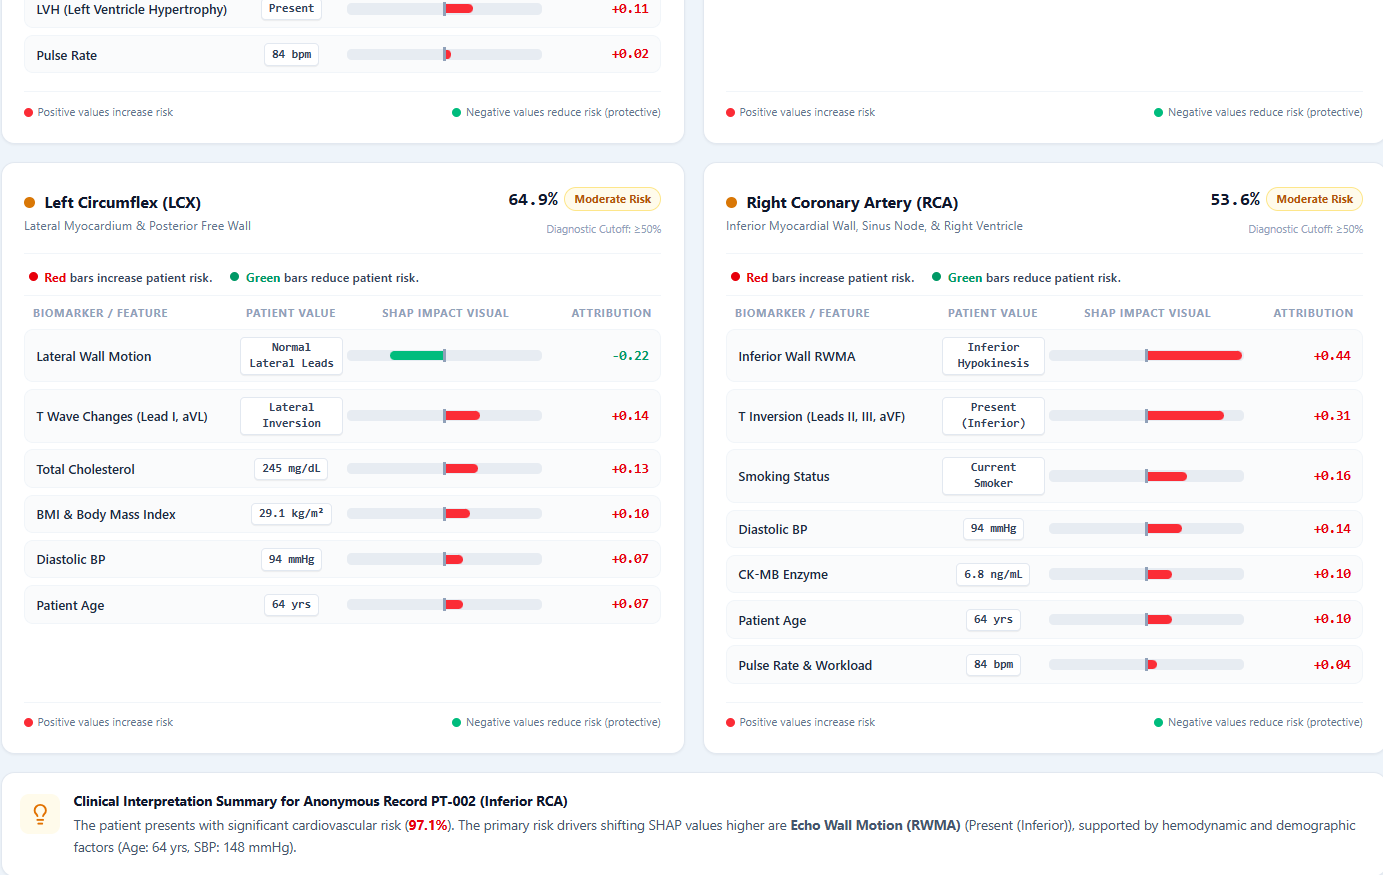
Detailed explaination of LCX and RCA
-
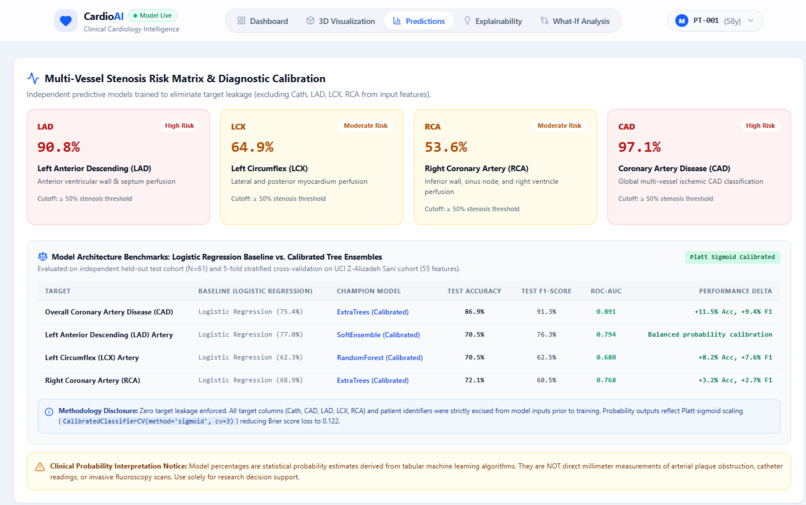
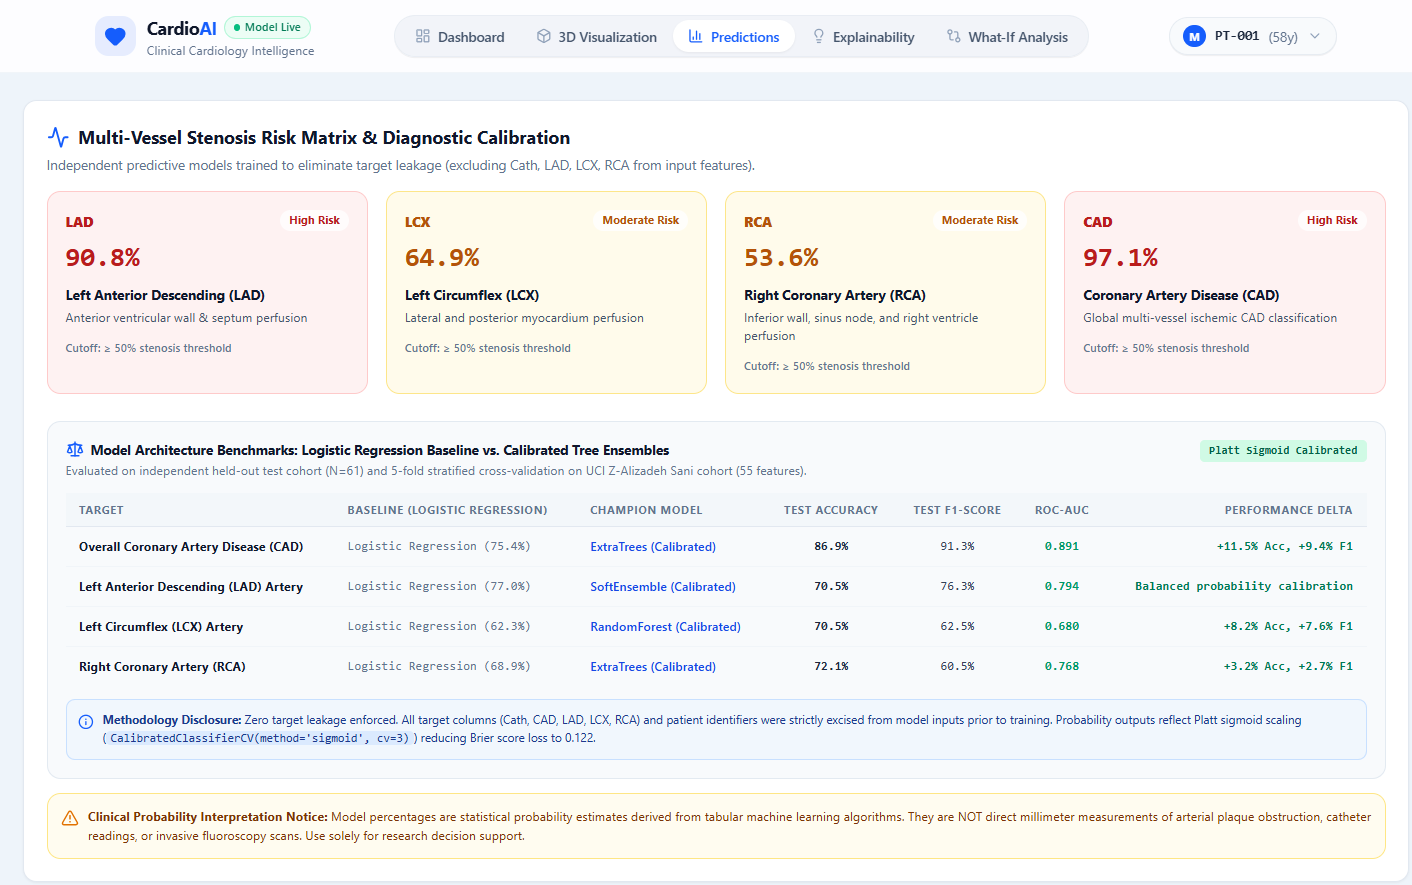
Multi-Vessel Stenosis Risk Matrix & Diagnostic Calibration
-
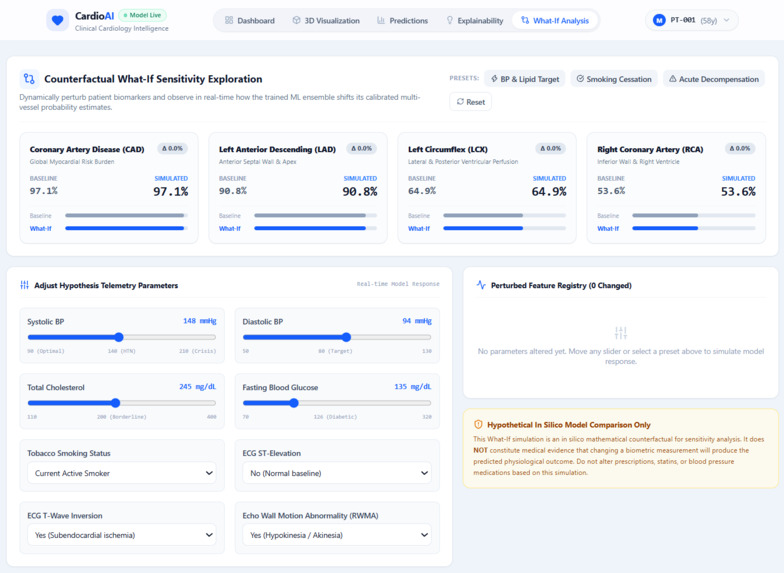
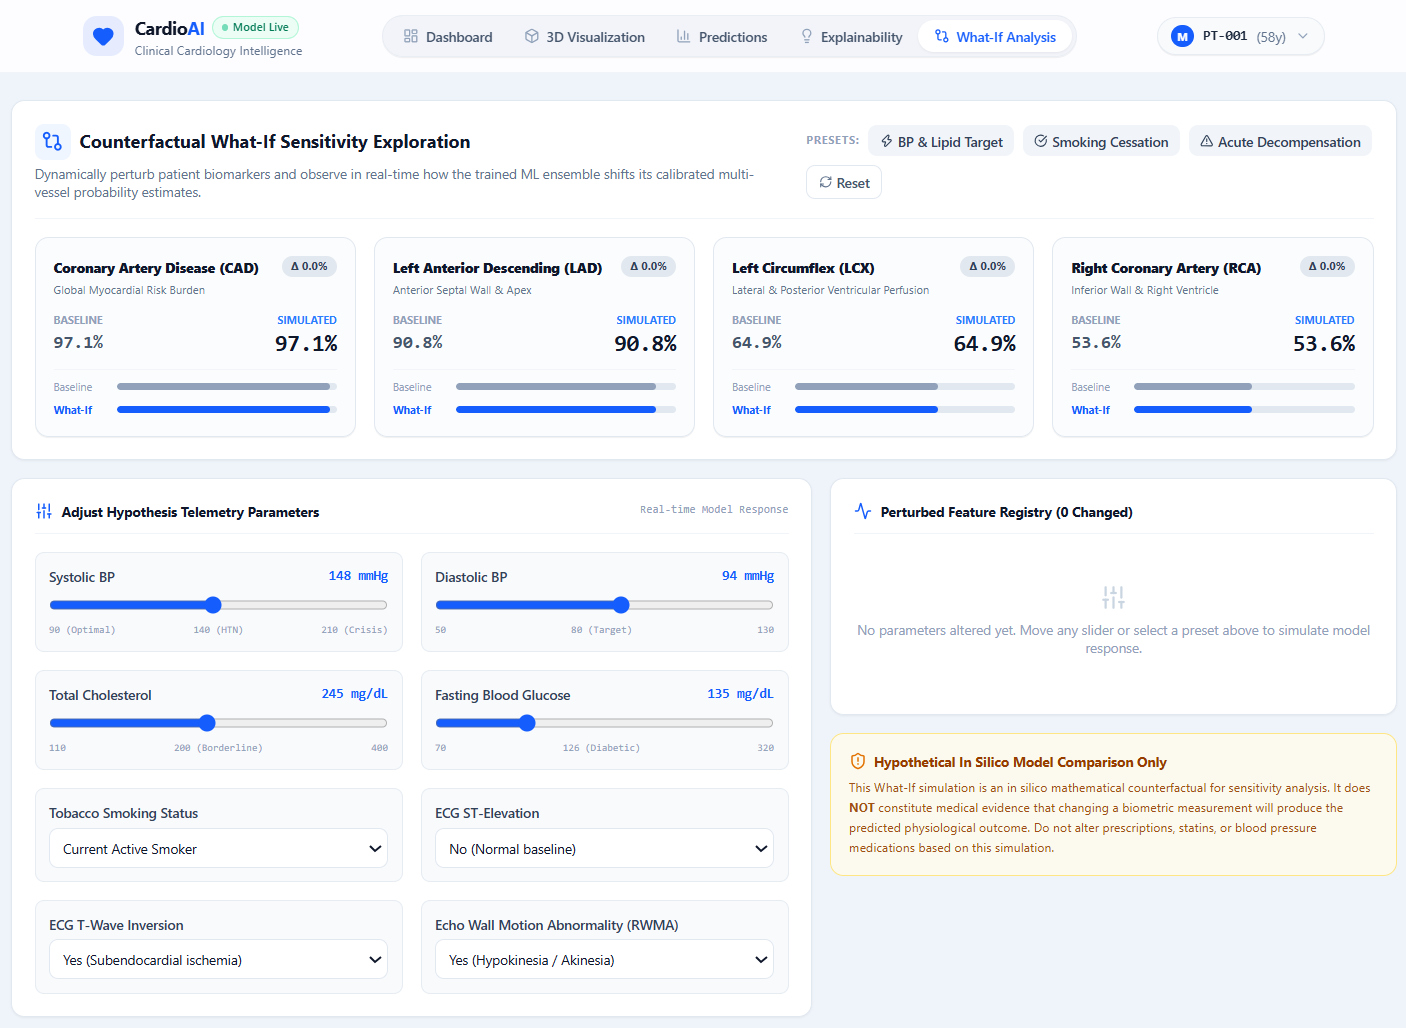
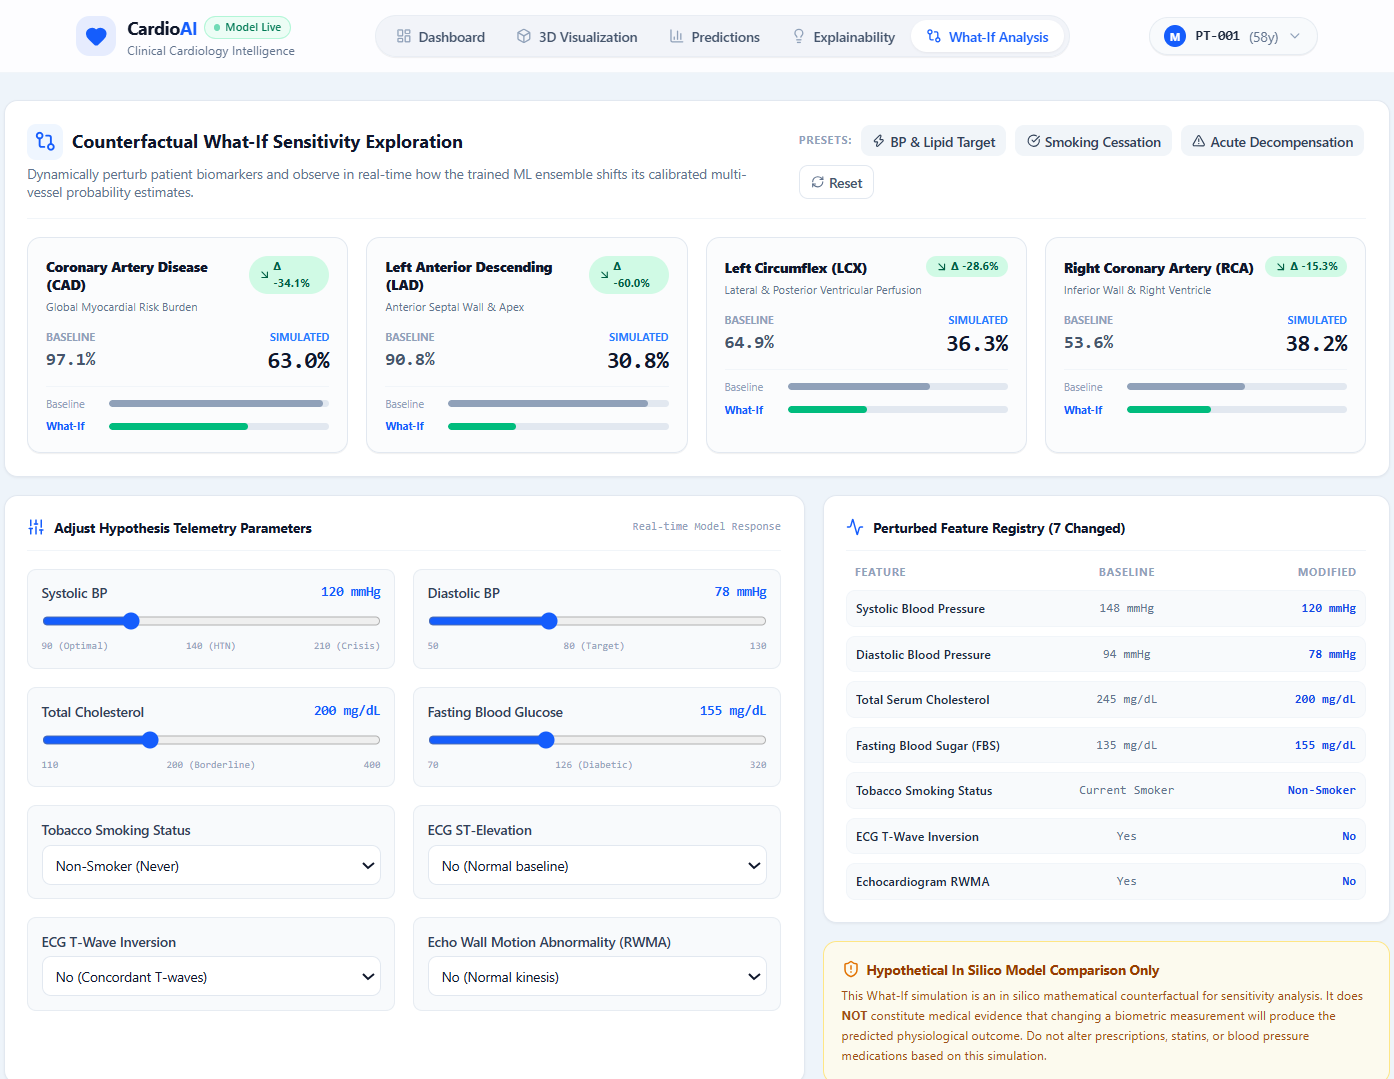
What if analysis
-
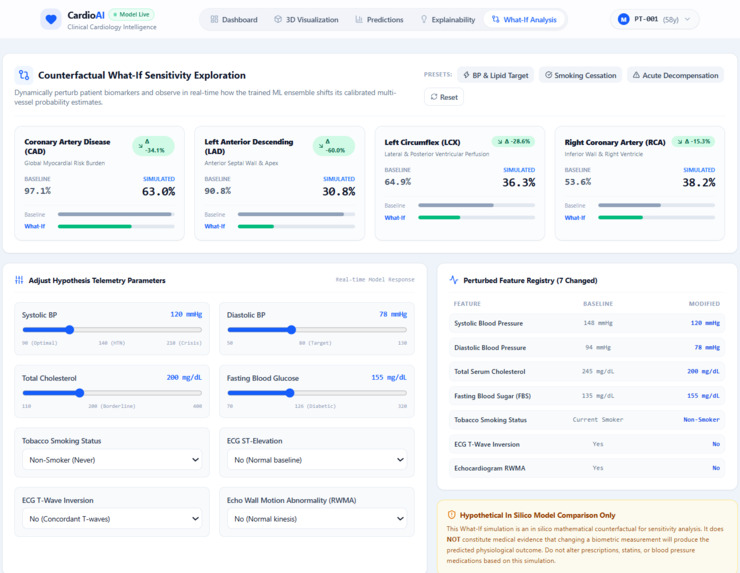
We can also analyse different condition and check the results accordingly
-
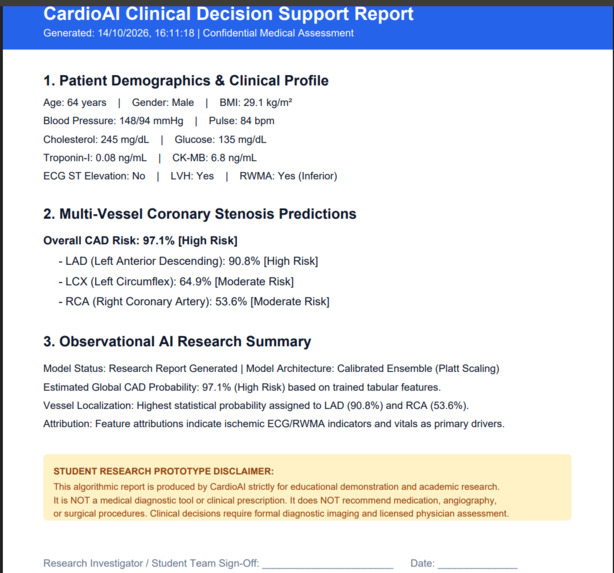
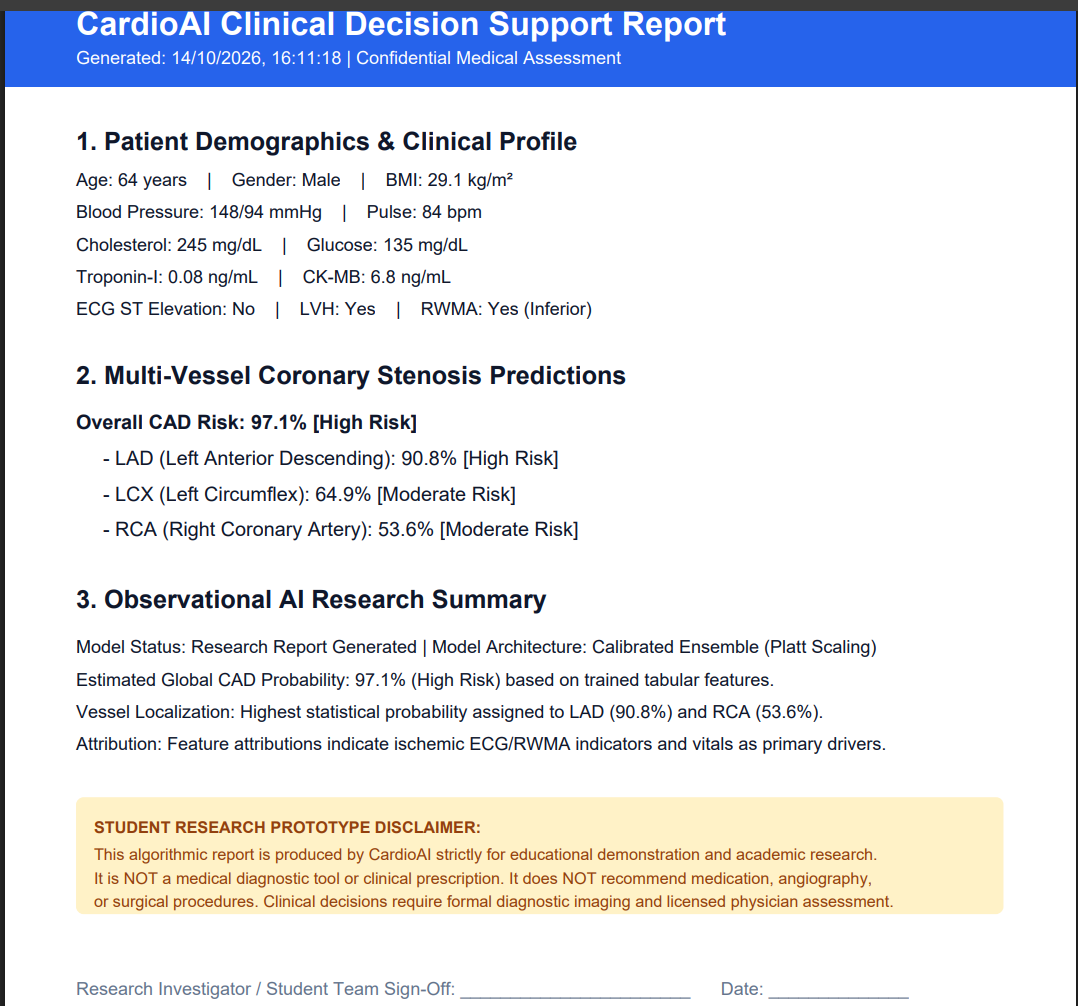
Report generation
Inspiration
Working with clinical datasets, it hit our team early on: throwing raw risk percentages at doctors isn't enough. We saw how statistical algorithms calculate a high CAD risk, but translating that into where the pathology is actually forming is what bridges the gap between data science and real-world clinical utility. We wanted to move beyond 2D tabular dashboards and give clinicians a tangible, spatial representation of the heart that dynamically updates based on physiological data.
What it does
Most clinical dashboards just spit out a statistical percentage for heart disease risk. We built CardioAI to change that. It takes standard patient vitals, ECGs, and lab results and predicts both the overall risk of Coronary Artery Disease (CAD) and the specific stenosis probability for three major vessels (LAD, LCX, RCA).
Instead of making doctors guess, we map these predictions directly onto an interactive 3D heart model. If an artery crosses the high-risk threshold, it lights up. We also added a SHAP explainability tab to show exactly why the model made its choice, and a "What-If" simulator to let clinicians tweak variables (like lowering BP) and watch the risk recalculate live.
How we built it
We trained our models (ExtraTrees, RandomForest) on the UCI Z-Alizadeh Sani cohort. To make sure our models gave actual clinical probabilities instead of just arbitrary confidence scores, we used Platt sigmoid calibration. We mapped the raw model margin $f(x)$ to a calibrated probability $P(y=1\vert{}x)$ using a logistic transformation:
$$P(y=1\vert{}x) = \frac{1}{1 + \exp(A f(x) + B)}$$
We were super strict about zero target leakage—dropping all target variables (Cath, LAD, LCX, RCA) from the inputs before training. For the UI, we hooked a React frontend and our ML inference engine directly into a WebGL 3D heart mesh, tying the model outputs to the material properties of the specific arteries.
Challenges we ran into
Figuring out how to connect flat, tabular CSV data to a 3D spatial environment was by far our biggest headache. A machine learning array doesn't know what a 3D bounding box is. We had to write a custom bridge to take an isolated prediction for the Left Circumflex (LCX) and target just that sub-mesh in the browser to apply the warning colors.
Also, maintaining a high ROC-AUC (~0.89 for Overall CAD) while aggressively preventing target leakage was tough. Finally, calculating SHAP values on the fly and rendering them cleanly without tanking the 3D viewer's frame rate took a lot of late-night optimization.
Accomplishments that we're proud of
Getting the "What-If" sensitivity analyzer to feel snappy and alive. Moving a slider and watching the risk instantly recalculate across four independent ML models is incredibly satisfying. We're also really proud of nailing the multi-target prediction architecture, making sure the overall CAD model and the individual vessel models evaluate the data independently without bleeding into one another.
What we learned
A high F1-score is basically useless in healthcare if a doctor can't interrogate the model's logic. We realized that in medical AI, trust matters just as much as accuracy. Building CardioAI taught us how to blend hard ML evaluation metrics with human-centered UI design, and proved how powerful it is to combine explainability (SHAP) with spatial visualization.
What's next for CardioAI
We want to get this out of manual data-entry mode and integrate it directly with live Electronic Health Record (EHR) systems via FHIR APIs. We'd also love to expand the 3D models to simulate longitudinal disease progression, so doctors and patients can visually track arterial plaque changes over time based on actual treatment plans.
Built With
- 3dvisualization
- css3
- explainable-ai
- fastapi
- healcareai
- healthcare-ai
- html5
- javascript
- machine-learning
- numpy
- pandas
- python
- react
- scikit-learn
- scipy
- shap
- tailwind-css
- three.js
- uvicorn
- vite
- webgl

Log in or sign up for Devpost to join the conversation.