-
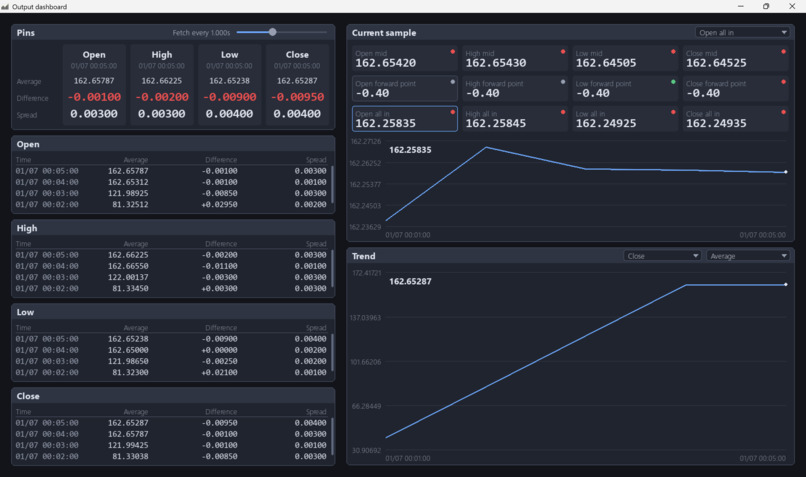
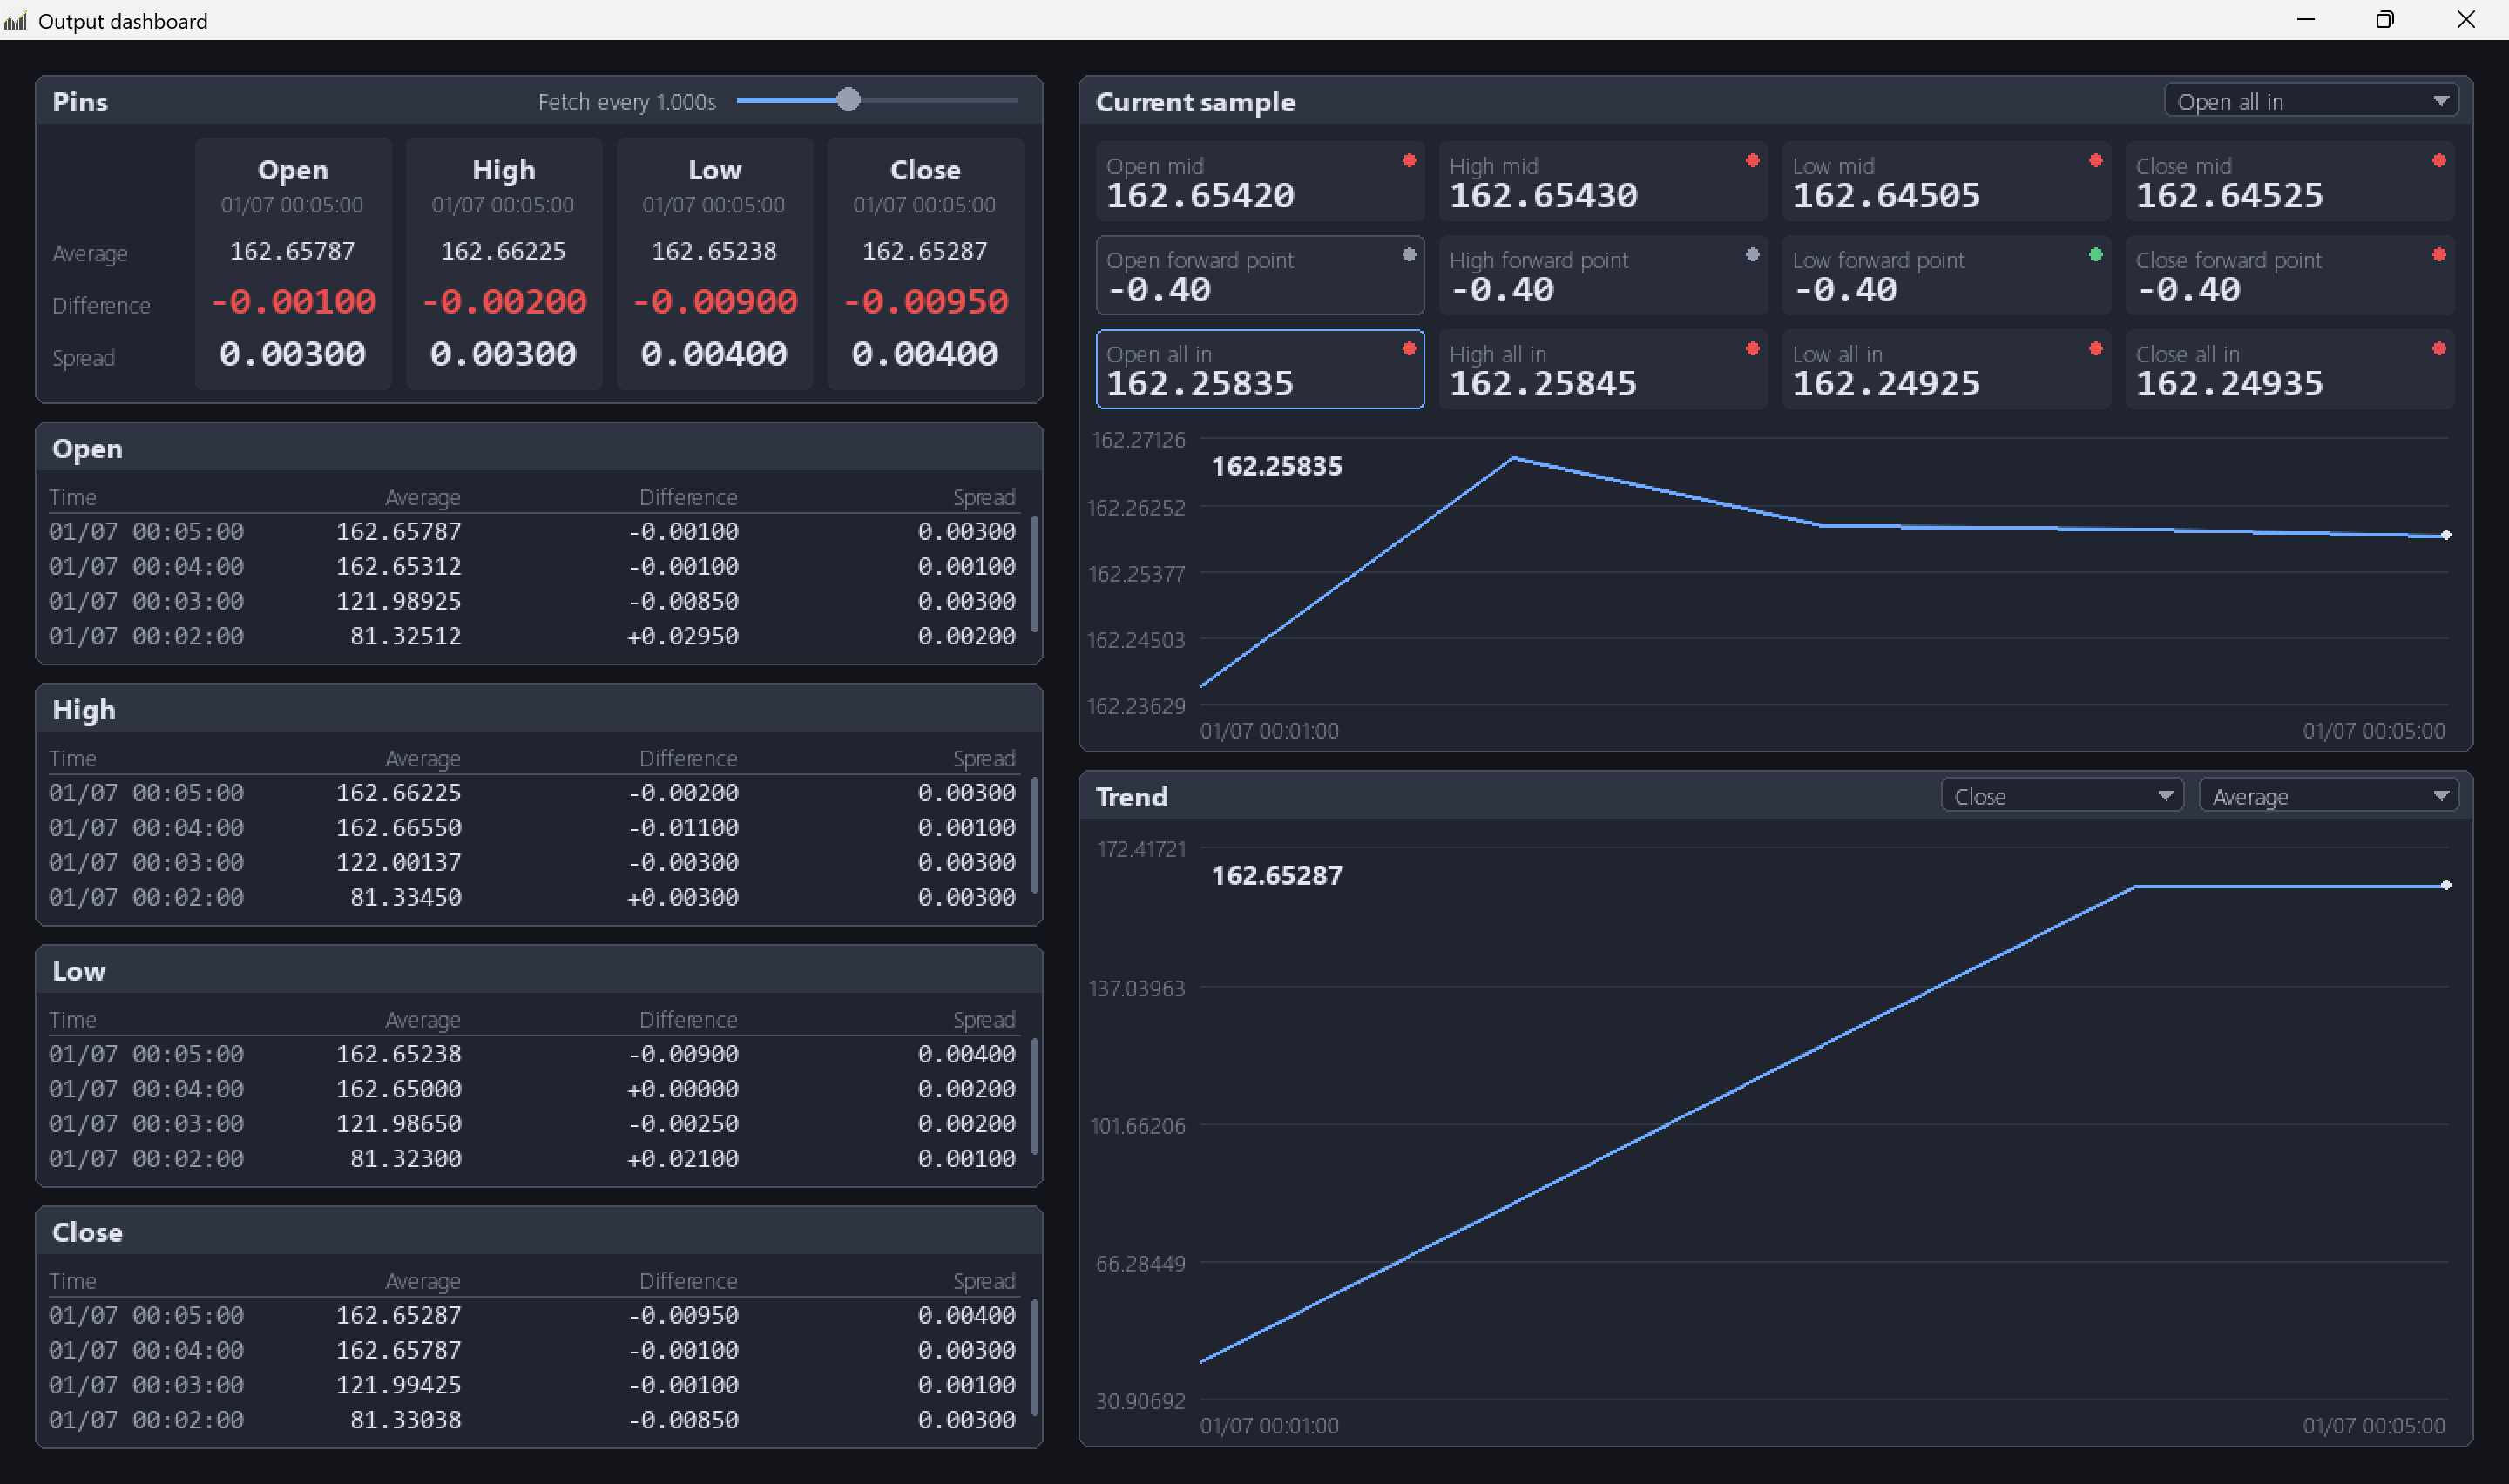
Pygame Output Image 1
-
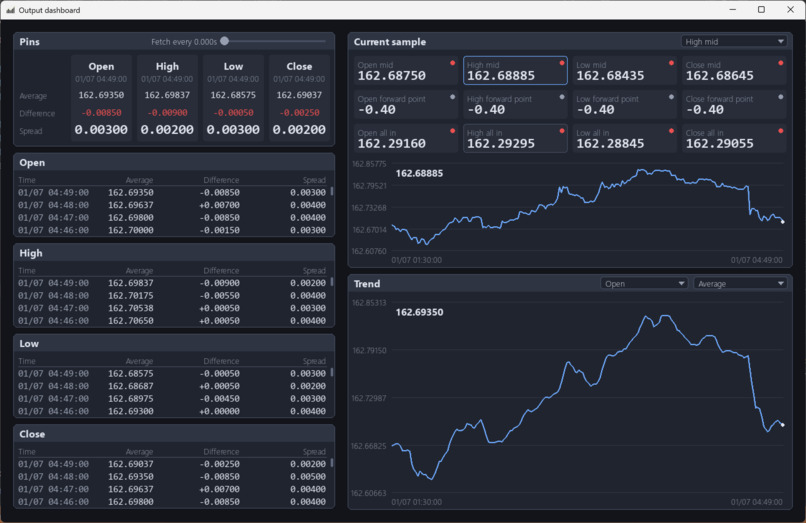
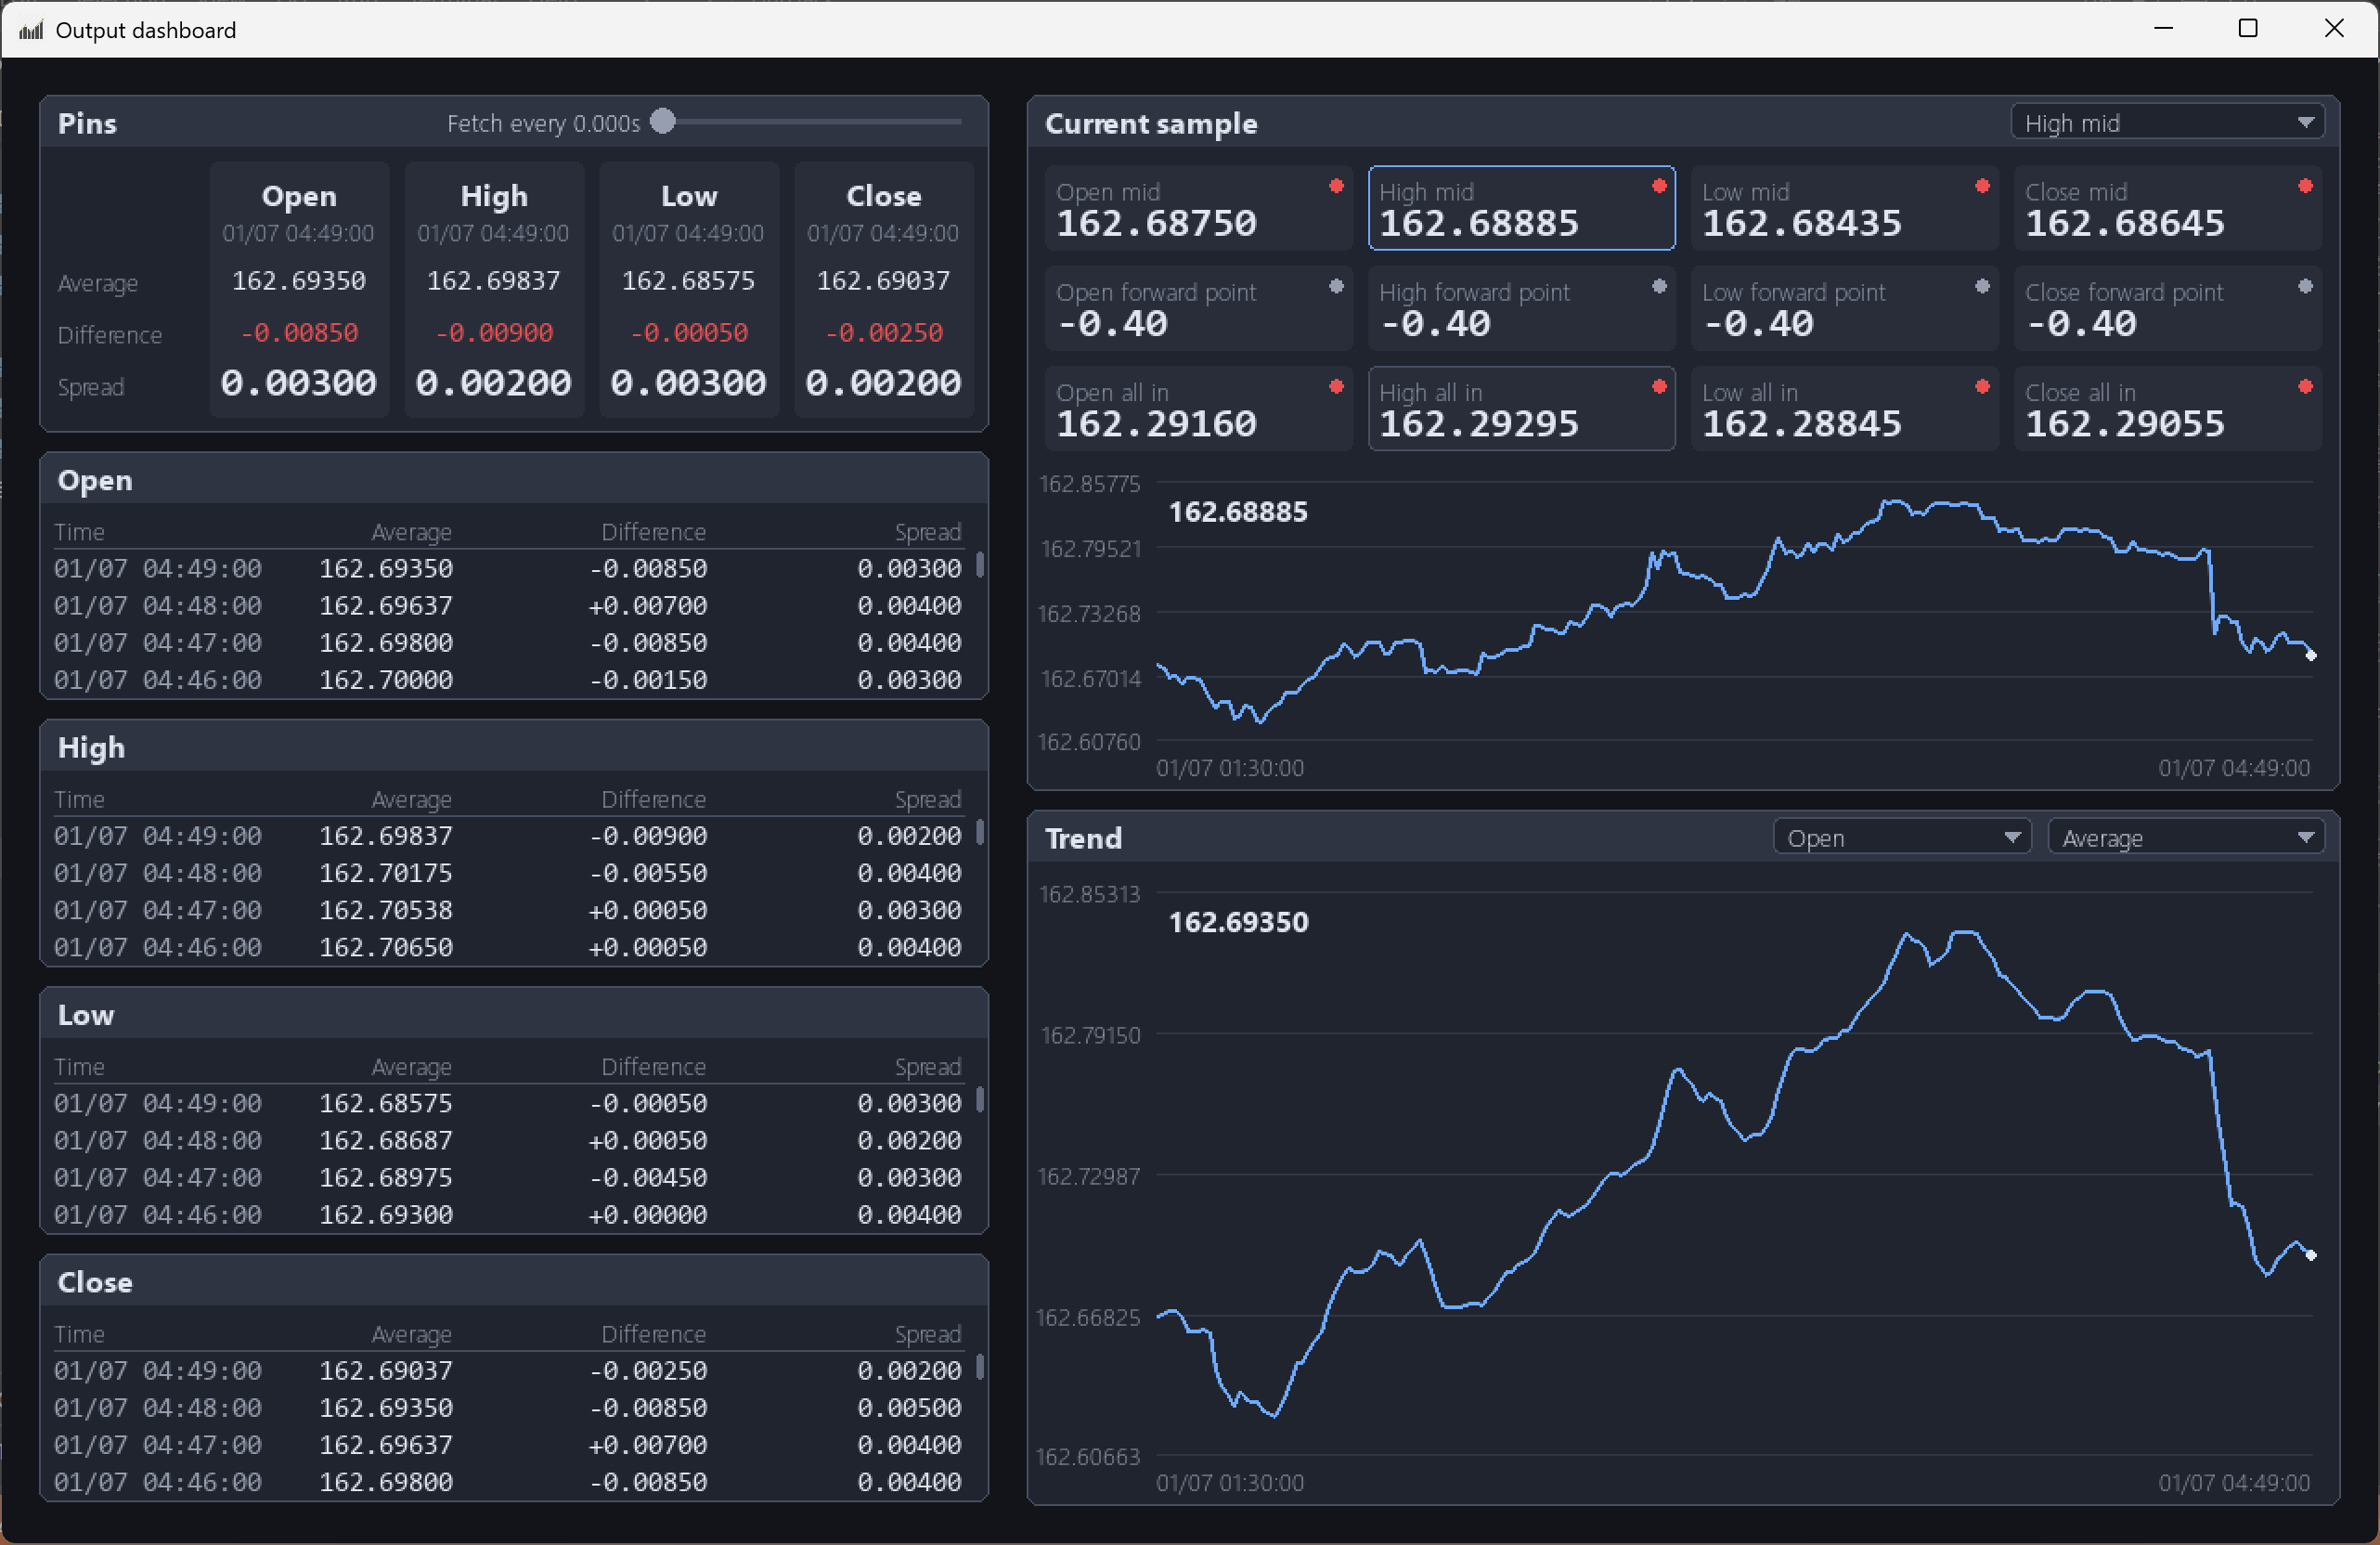
Pygame Output Image 2
Inspiration
Trading firms typically use FPGAs to analyse market data, allowing very low latency, and we wanted to see how that works by building a small version ourselves, albeit simulated. Additionally indicators, such as moving averages and spike detection, are usually written in software, we were curious how they translate to hardware logic.
We wanted a project that spanned the full-stack, from a time-series database down to RTL and back up to a python dashboard.
What it does
- Pulls historical market prices of USD to JPY from a TigerData DB using SQL
- Prepares the data in Python into a format the hardware design can interpret
- Processes the price stream in SystemVerilog, computing but not limited to the following qualities: a moving average; tracking highs and lows; and detecting upward and downward spikes
- Generates alerts when the price crosses defined conditions.
- Decodes the hardware output in Python, stores then displays prices, indicators and alerts on a Python dashboard.
How we built it
Data layer: SQL queries against TigerData to extract price history as a time-ordered series. Preparation: Python scripts to clean the data and convert prices to fixed-width integer values for the hardware. Processing: SystemVerilog modules for the numerical analysis and alerts, driven by a testbench. Decoding: Python to parse the simulation output back into prices and alert flags aligned with the original timestamps. Display: a Python dashboard plotting the price, the moving average and the alert markers.
Challenges we ran into
- Representing decimal prices in hardware, which meant choosing a fixed-point scale and bit widths without losing precision or overflowing
- Computing a moving average without a costly divider, for example by using a power-of-two window so division becomes a bit shift
- Keeping the hardware output aligned with the original timestamps, given pipeline latency and the warm-up period before the window fills
- Tuning spike thresholds so that real moves raise alerts but ordinary noise does not
- Getting the file formats to agree between the Python stages and the SystemVerilog testbench.
Accomplishments that we're proud of
- A working end-to-end pipeline, from database query to dashboard, across three languages
- Hardware results that match a Python reference model of the same indicators
- A modular RTL design where each indicator is its own block and can be tested independently
- A dashboard that makes the hardware’s output easily readable.
What we learned
- How to think about data as a stream processed clock cycle by clock cycle, in contrast to arrays in software
- Fixed-point arithmetic and the trade-offs in choosing bit widths
- Writing testbenches and verifying RTL against a software golden model
- Working with time-series data in SQL and structuring queries for ordered extraction
- The value of agreeing data formats and I/O between stages early.
What's next for Copper Heron
- Synthesising the design and running it on a real FPGA board
- Computing multiple currency data simultaneously
- Adding more indicators, such as an exponential moving average, RSI or Bollinger Bands
- Making window sizes and thresholds configurable at run time
- Measuring latency and throughput against a typical software implementation
Built With
- postgresql
- pygame
- python
- system-verilog
- tiger-data
