Inspiration
COPD is one of the biggest health challenges facing India today - and one that family members of our team (Hasan's grandmother) have personally witnessed and struggled with. Plagued with the worlds highest AQI, prevalent solid fuel use (made worse by the acute rising price of cooking gas) and lack of care facilities in rural areas tackling respiratory problems, we had personal and global motivations for looking into COPD as health condition in India. Knowing that NGOs and health organizations make critical decisions about resource allocation on a recurring basis, we decided to tackle Track 2 - Medical Desert Planner, by visualizing gaps in coverage combined with COPD risk heat maps to create a comprehensive overview of where and how an NGO or health organization could best intervene to tackle the problem.
What it does
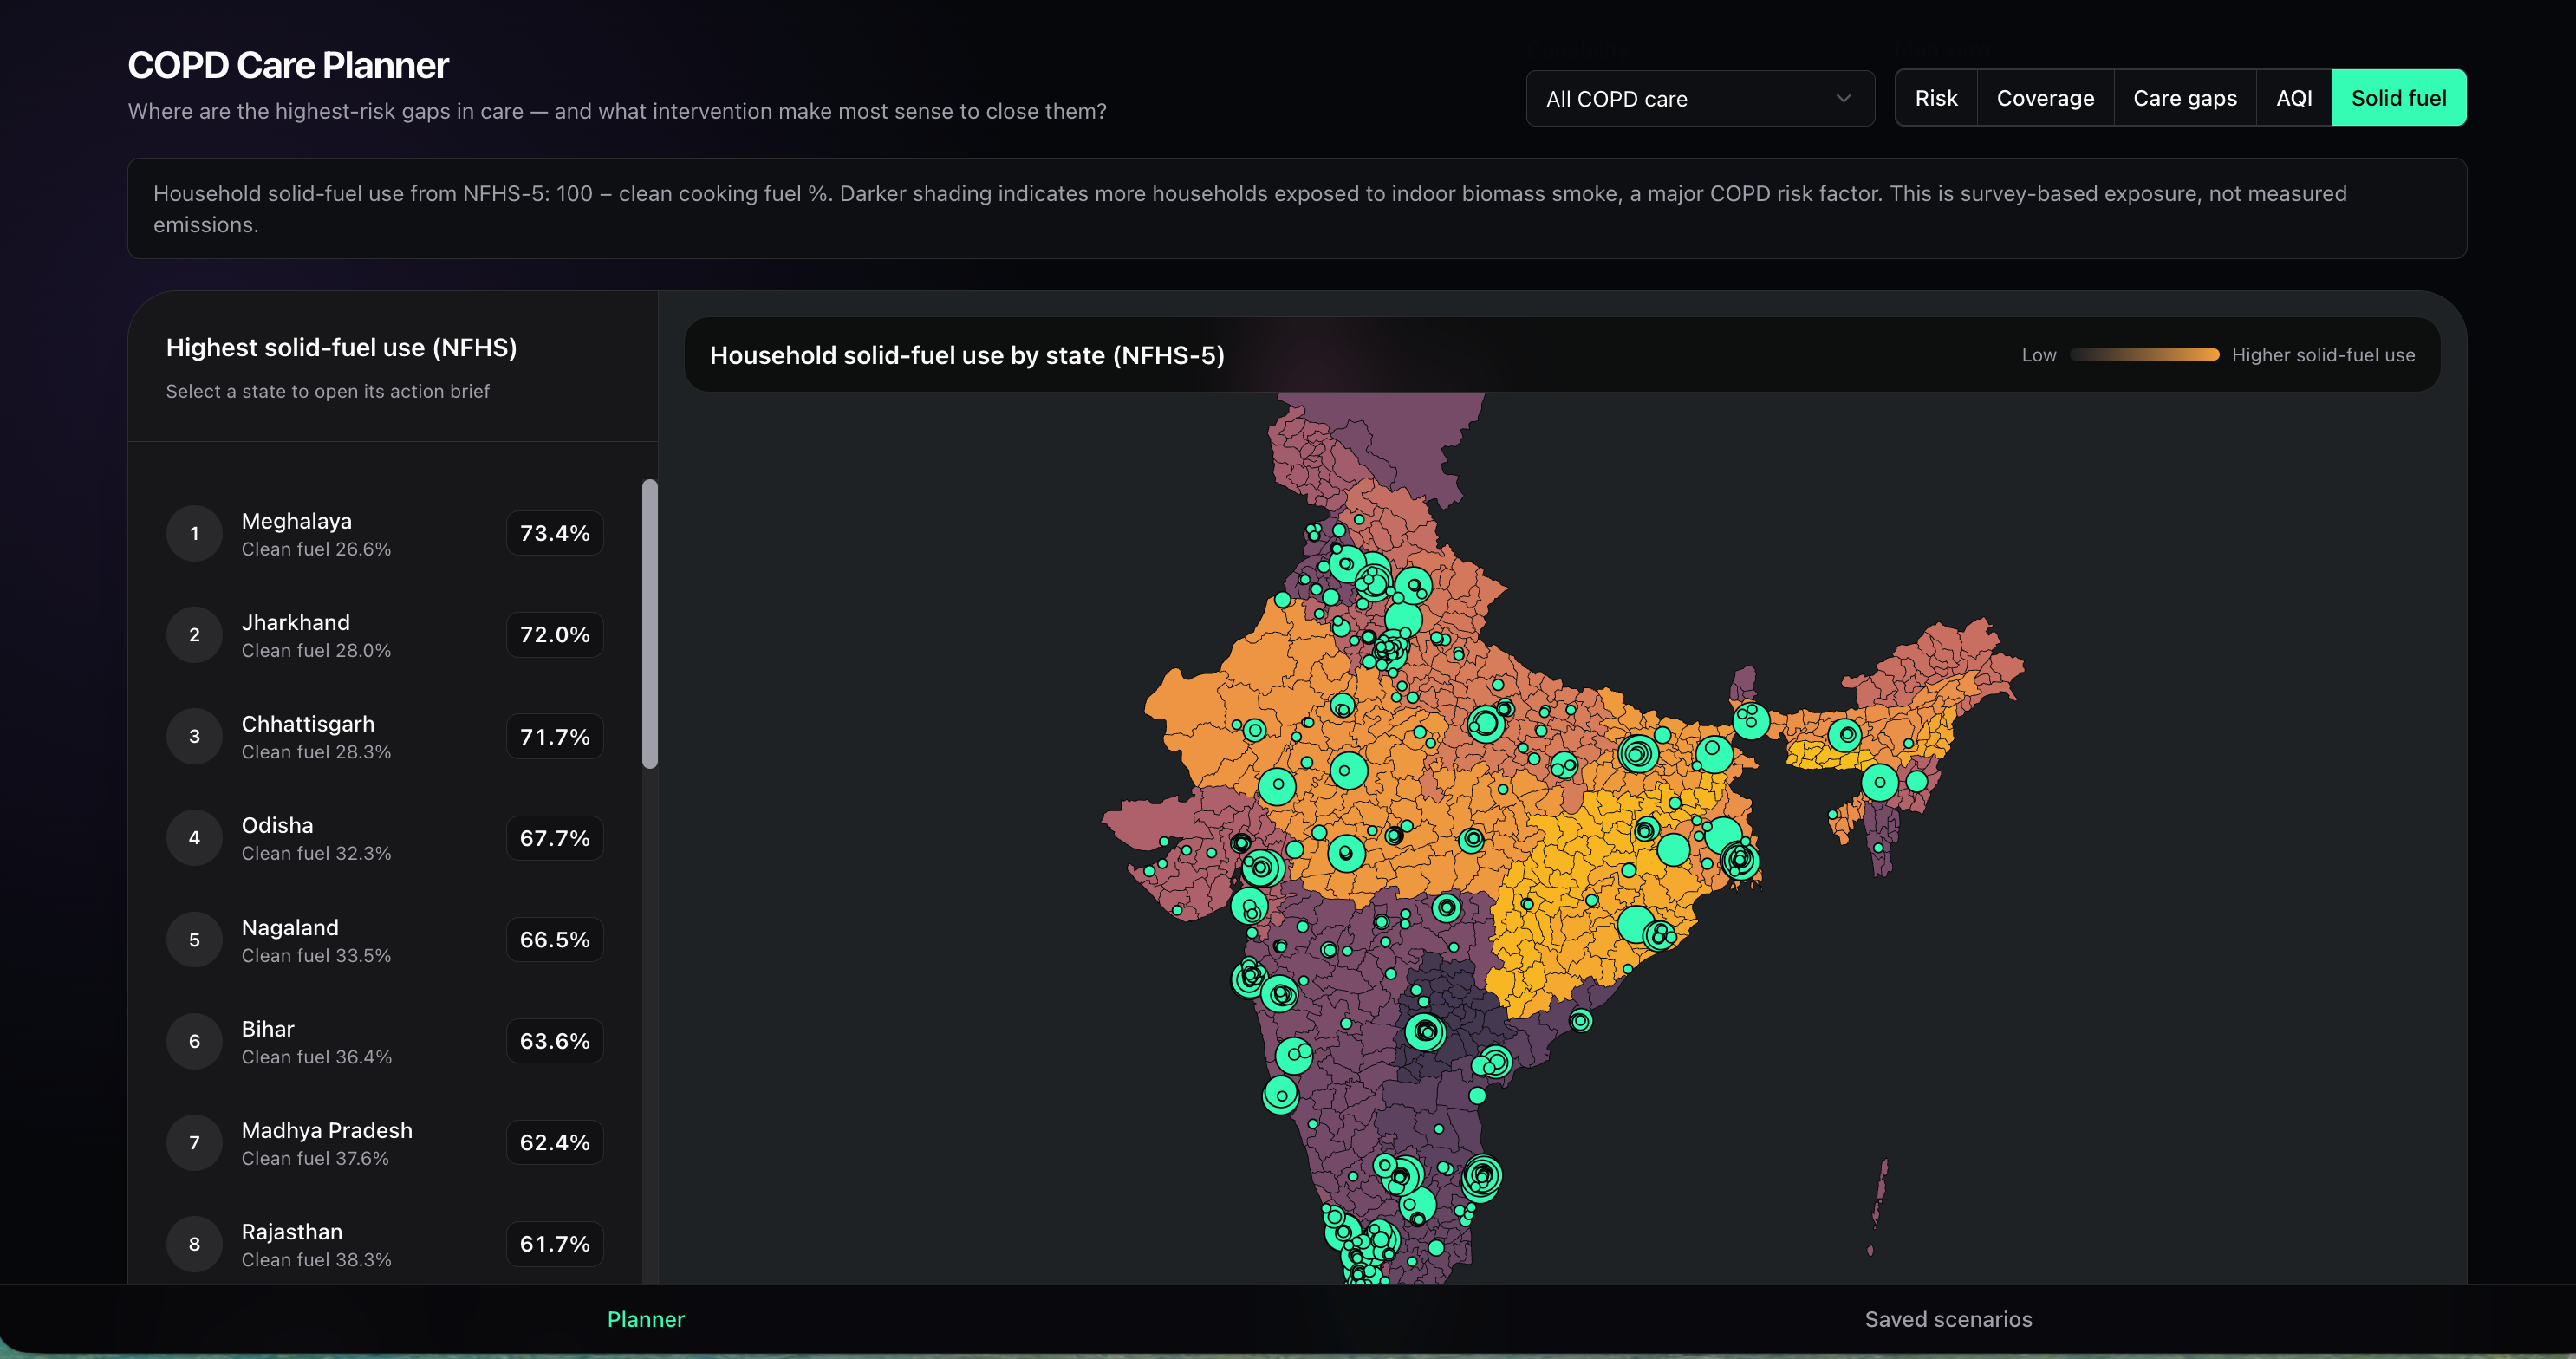
Our application visualizes COPD Risk, coverage, and care gaps for different regions of India. Overlayed on this map are pins of preexisting care facilities (filtered to COPD related care, like pulmonology departments and respiratory services), helping provide a complete picture on where risks are most present and where care is already being delivered. We calculate a complex COPD risk equation using OpenEvidence (a specialized medical knowledge LLM) to assign weights for factors that go into COPD prevalence (AQI, tobacco use, etc.), as well as similar heuristics for Coverage and Care Gap overlays.
For each region, users can view recommended interventions (building a new care facility, revitalizing an old clinic, verifying care from data-poor clinic, etc.) based on a multi-part calculation that takes into account risk factors like AQI and solid fuel use, as well as care already being delivered in the area normalized over the regions population. Users can also talk to the data of a particular region using Genie conditioned on regional filters.
Happy with an analysis, users can save action briefs for particular regions to be accessible for future viewing.
How we built it
We used Claude Code and Cursor to build a NodeJS & typescript app pulling from the three data tables provided via the Databricks CLI. Specifically, we pulled tobacco use and solid cooking fuel data as risk factors, care facility information including name and number of staff, and location data for care facilities to visualize them on the map. We then deployed the app on Databricks Apps.
Challenges we ran into
- AQI data is a key underlying dimension to COPD but wasn't available in the data - we pulled it in from external sources.
- Knowledge on kinds of interventions an NGO may want to take for COPD - we researched using a set of medical knowledge LLMs to figure out grounded solutions and interventions for COPD specifically
Accomplishments that we're proud of
- Integrating a large amount of medical information and risk factors into one map
- Genie integration filtered to region, allowing users to ask specific questions about different subsets of the data
- Building a nuanced recommendation system for COPD related interventions that takes into account preexisting care
What we learned
- States in the central-east region (Jharkhand, Odisha) and far east region (Tripura, Manipur) of the country are at highest risk
- Missing data on preexisting care facilities makes calculating coverage gaps hard, but we can use other data like risk factors as. a proxy for figuring out where intervention is needed most
What's next for COPD Care Planner
- District level data for risk factors
- More complex confidence scores for intervention strategies

Log in or sign up for Devpost to join the conversation.