-
-

Cooperatives Ecosystem Visualization by Coötoo
-
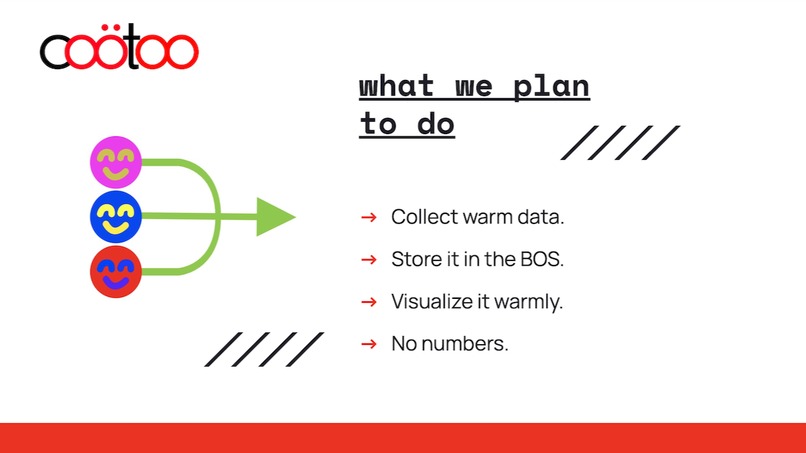
Roadmap
-
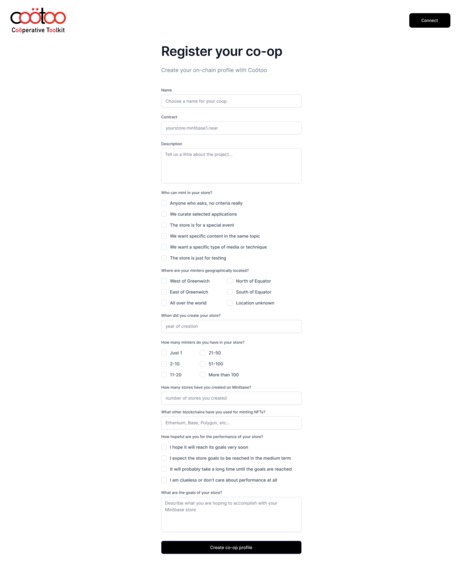
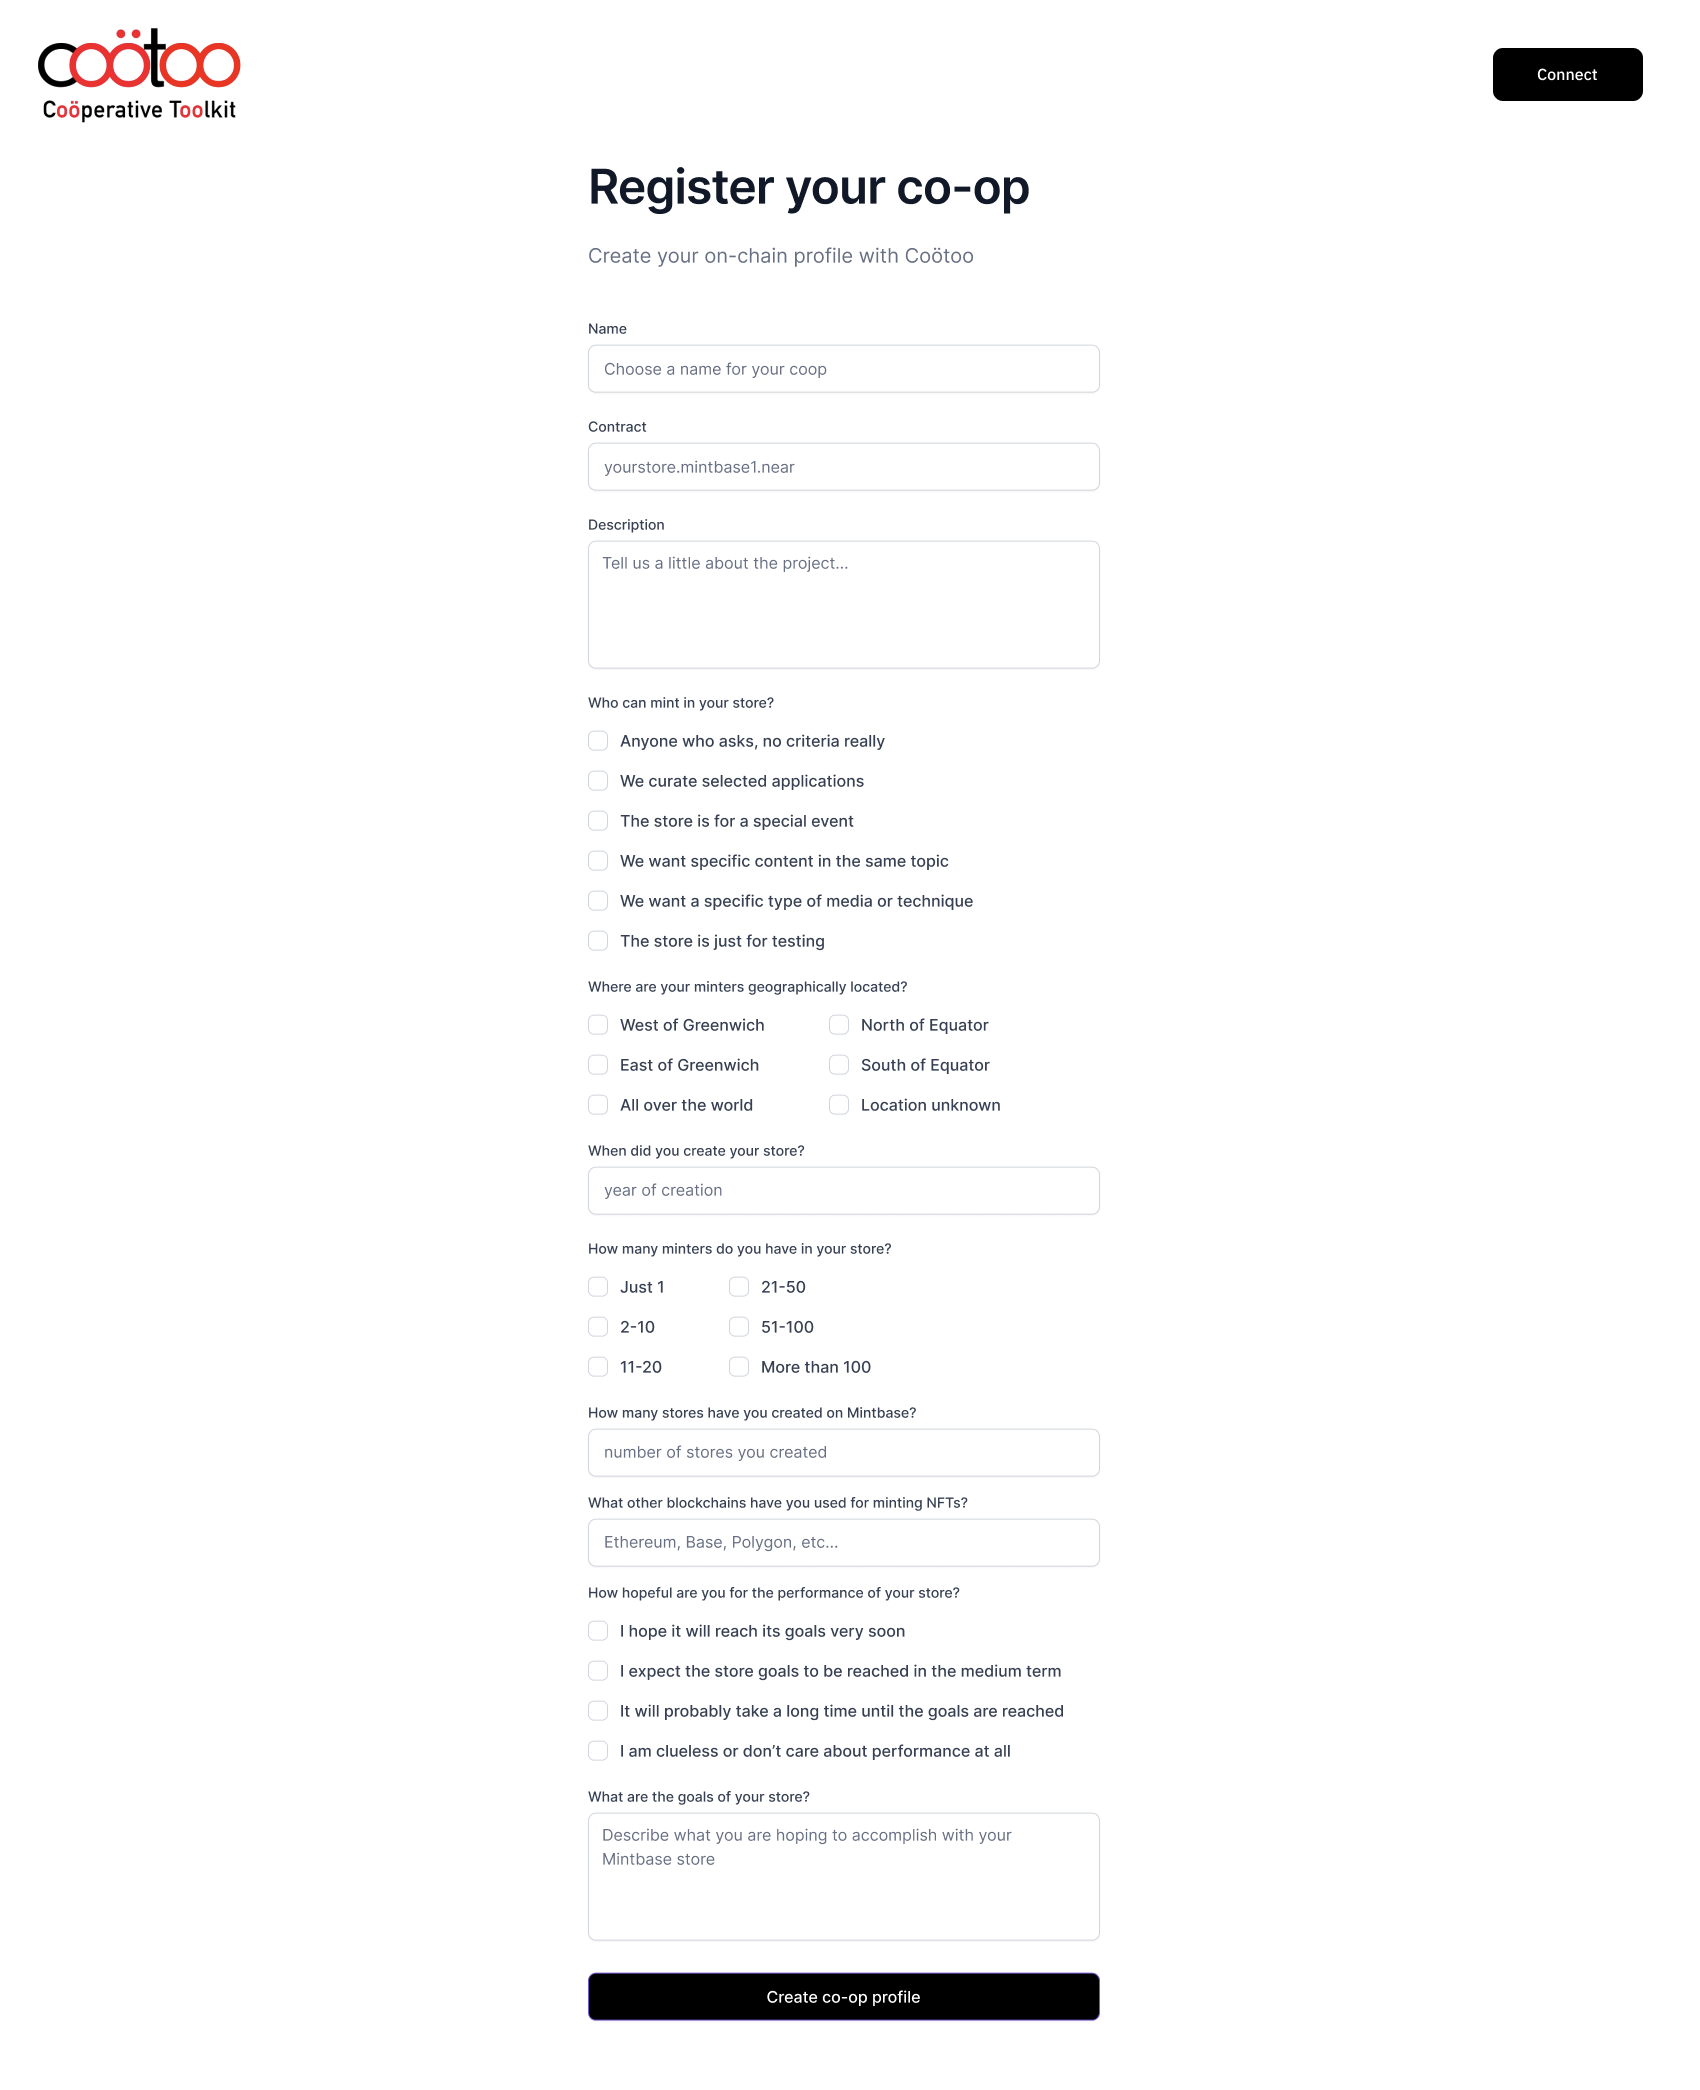
Coop registration form for BOS
-

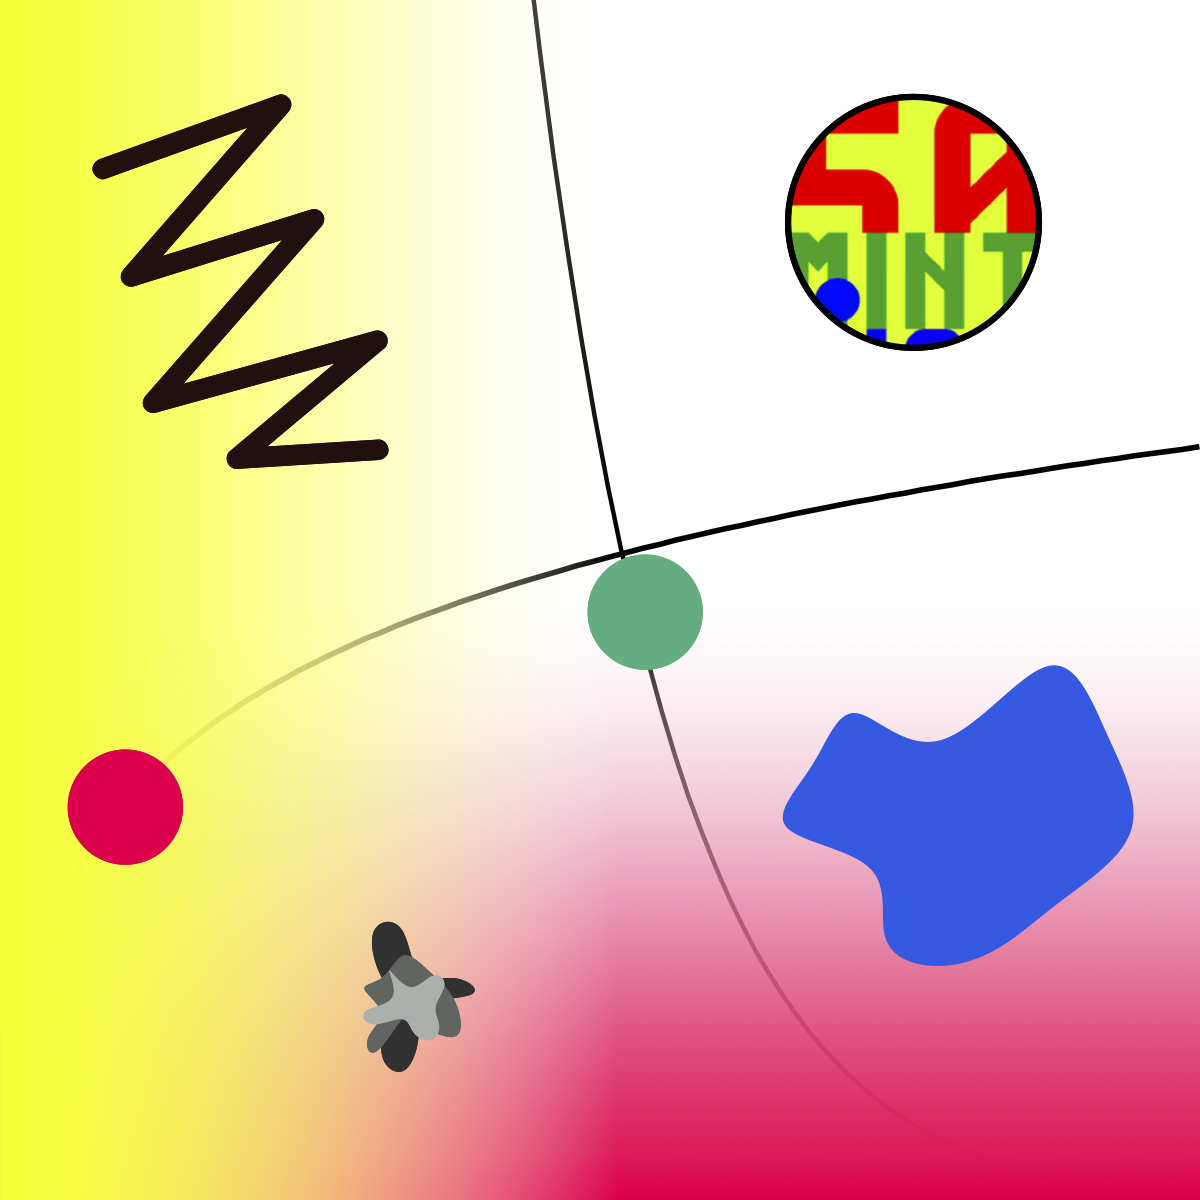
Example BOS widget for single coop instance - 50mint
-
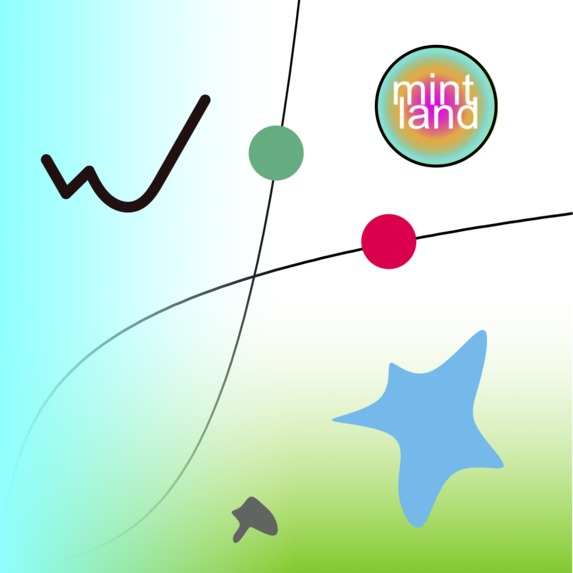
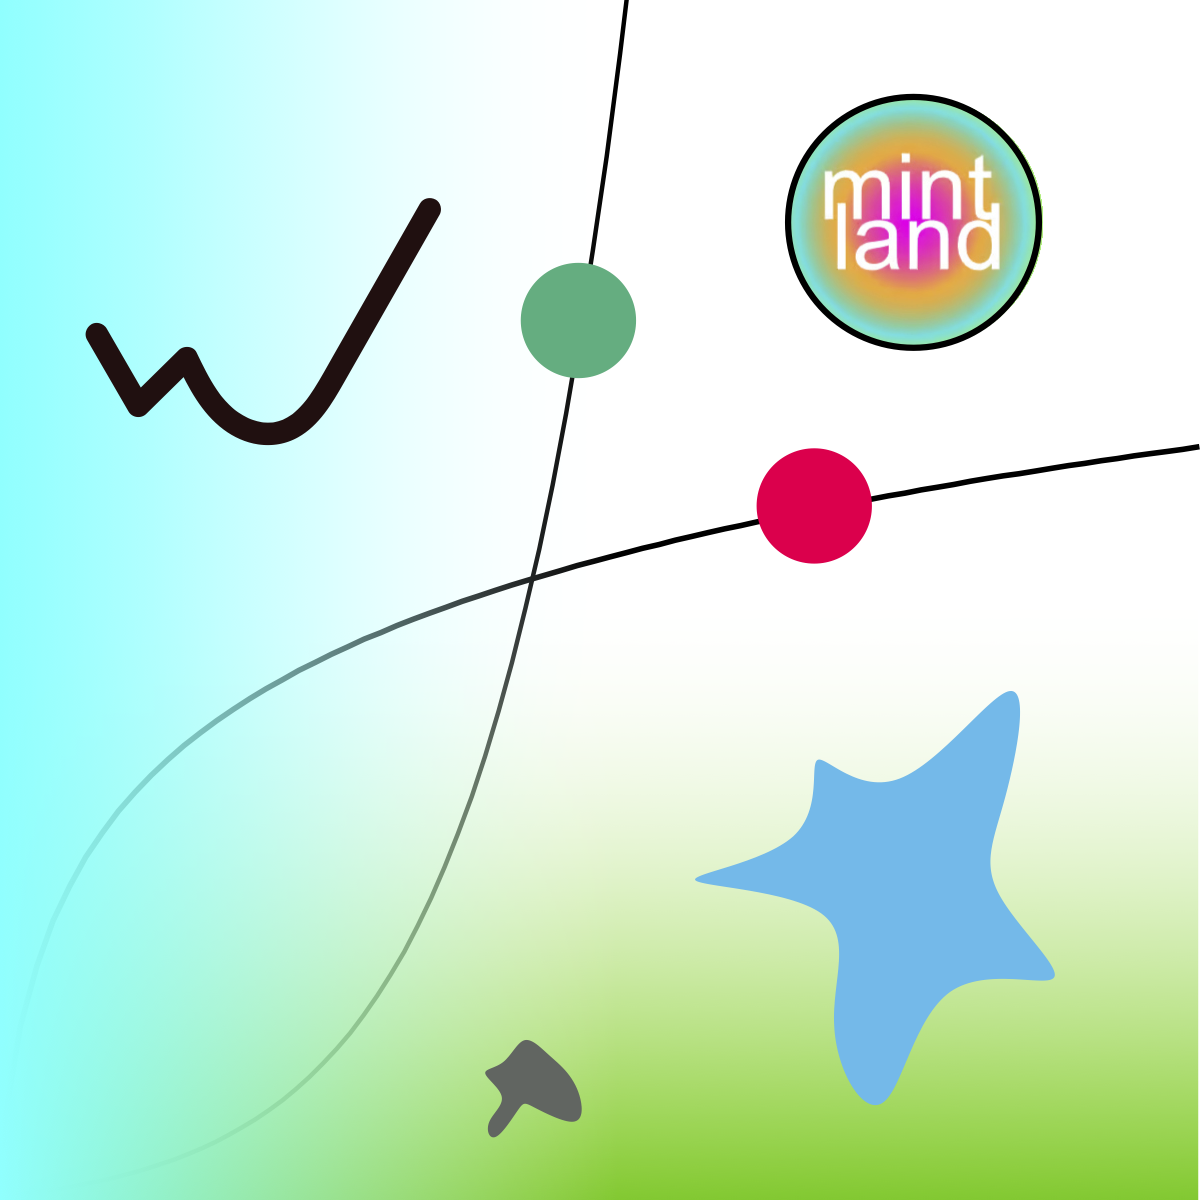
Example BOS widget for single coop instance - mintland
-

Example ecosystem visualization with legend
-
Contact info - Telegram and Twitter

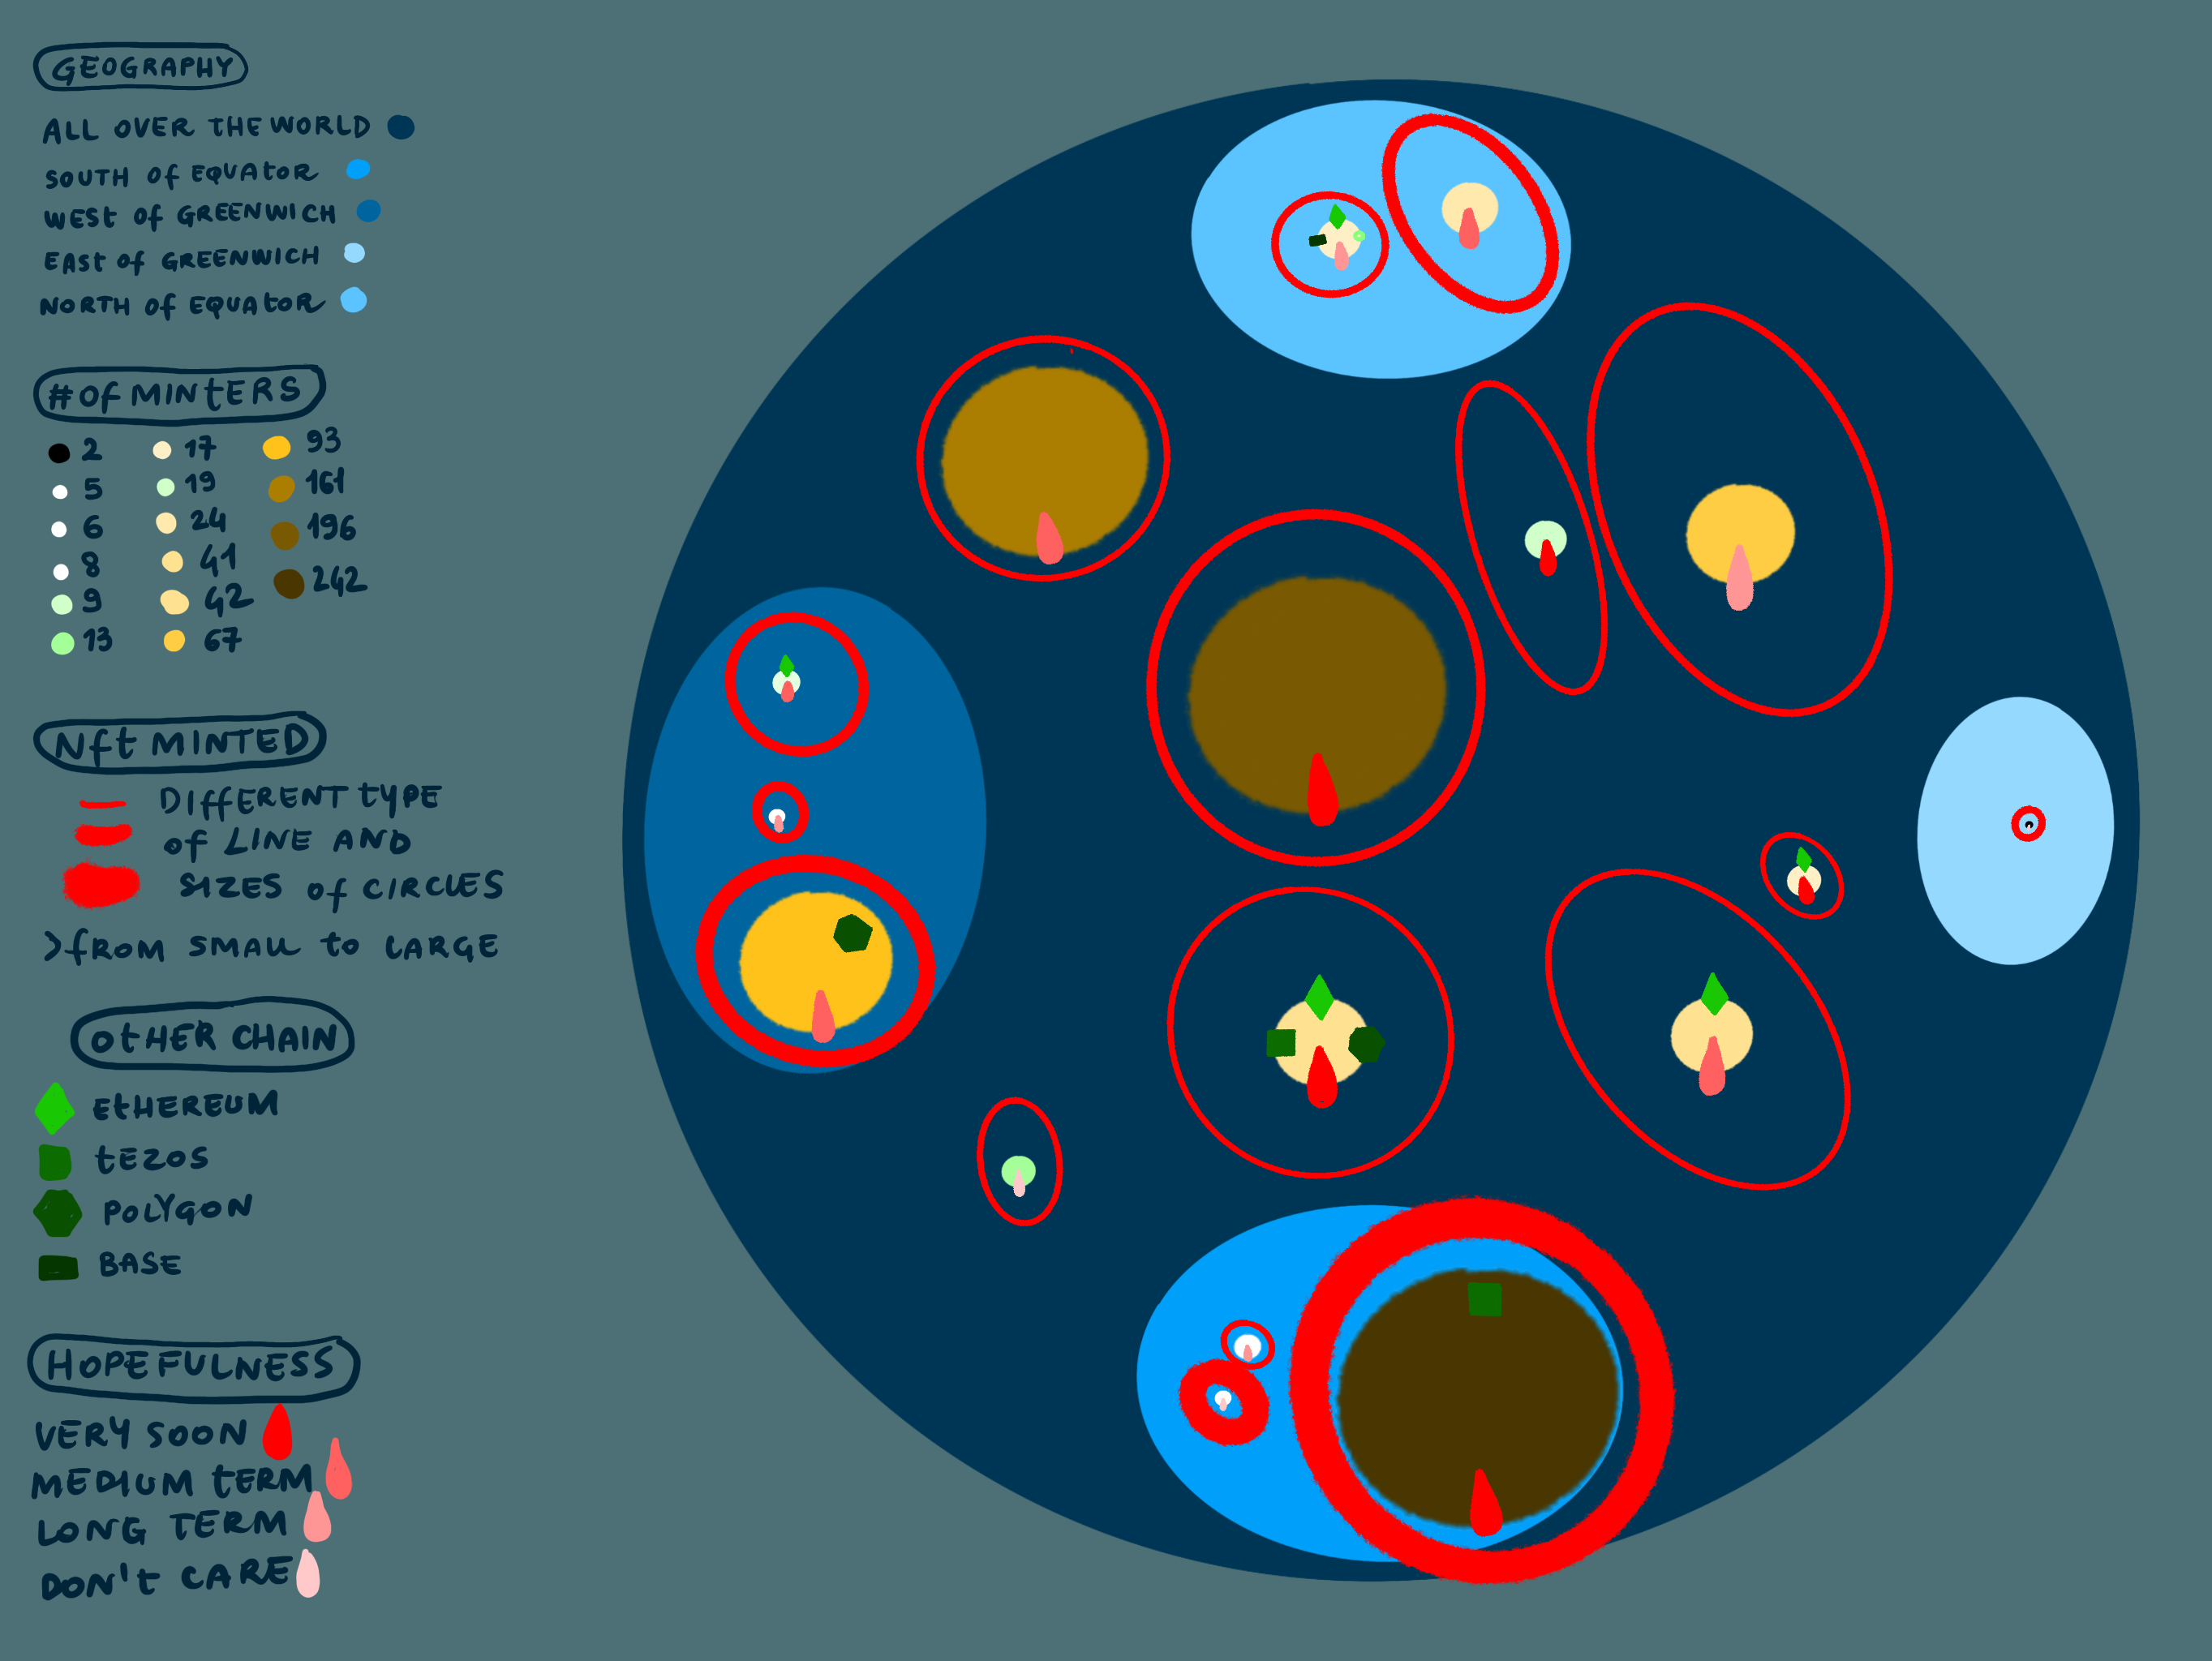

About Coötoo & what we are hacking:
We are building a BOS visualization widget for our ecosystem of minter cooperatives - groups of minters that want to support each other and share a percentage of their revenues.
Our plan:
We want to collect warm data. Store it in the BOS. And make it accessible also in a warm way. No numbers, just beautiful visualizations.
Each co-op can have their badge, a BOS widget they can embed and display their stats in this visual way. It won’t show numbers, but if you know what each element represents, you can easily read and absorb this data, in a very intuitive way.
Gradients can change colors and can represent hopefulness, or geographical regions. Curation criteria and time of deployment can embedded in the shape and colors of squiggles and blobs.
We also want to have a larger visualization displaying the whole ecosystem of on-chain cooperatives.
Getting in touch:
We welcome you to watch our demo video and reach out in our Telegram group of Twitter if you want to be an early user. Demo: https://youtu.be/LP1OT9iRj9A Telegram: https://t.me/cootoochat Twitter: https://twitter.com/StatelessDAO
Built With
- bos
- javascript
- near
- react
- svg

Log in or sign up for Devpost to join the conversation.