-
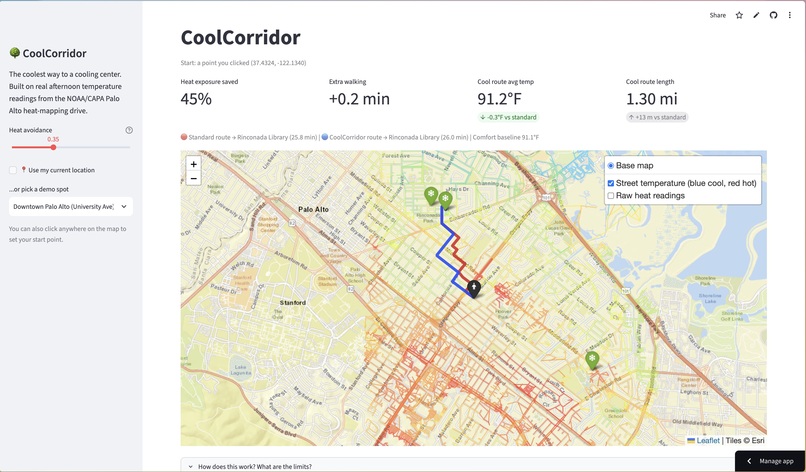
UI/example
Inspiration
In summer 2024, we mapped heat across Palo Alto, Menlo Park, and East Palo Alto with the Cool Cities Coalition. We partnered with NOAA, presented our findings at the Extreme Heat Summit, and appeared in news coverage. One question stayed with us: how does this data help someone who needs relief right now?
Cities open cooling centers during heat waves, but people still have to walk there. Navigation apps send them down the shortest path, which is often a wide, treeless road in full sun. For seniors, transit riders, and unhoused residents, that last stretch is the riskiest part of the trip. We built CoolCorridor to put our own heat data to work for the community.
What it does
CoolCorridor finds the coolest reasonable walking route to a cooling center. It shows that route (blue) beside the standard shortest route (red). A metrics card compares the two on distance, walk time, average temperature, and heat exposure. We define heat exposure as degrees above a comfort baseline multiplied by minutes walked.
Visitors can enter their location, click a start point on the map, or pick a demo spot. A slider sets how much extra walking they accept to stay cooler. At zero, the app matches a standard map. Higher settings favor cooler streets.
How we built it
Heat data: We loaded about 9,000 real afternoon temperature readings from the NOAA/CAPA heat-mapping campaign in Palo Alto, using GeoPandas. Street network: We downloaded the walkable street network from OpenStreetMap with OSMnx. Interpolation: We estimated a temperature for every street segment from its 8 nearest readings, weighting closer readings more (inverse distance weighting, with scikit-learn). Heat penalty: We gave each segment a heat-aware cost: length × (1 + α × degrees above baseline). Hot blocks “feel longer” to the router. Routing: NetworkX runs Dijkstra’s algorithm from the start point to every cooling center. We pick the cheapest route by distance and the cheapest by heat-aware cost. Maps and website: Folium and Leaflet draw the interactive map, with streets colored by estimated temperature. Streamlit powers the website.
Challenges we ran into
Sparse data: Our sensors drove on roads, so many streets have no direct reading. We had to estimate them and be clear that these are estimates. Map tiles: The standard OpenStreetMap background blocked our map when we opened it from a saved file. We switched tile providers. Showing the benefit: Many start points produce nearly identical routes. We wrote a search that finds start points where the cool route saves the most heat for little extra walking.
Accomplishments that we're proud of
We turned data we collected ourselves into a working tool that residents can use.
What we learned
Small changes to a routing cost function change who a tool serves. Adding heat to the cost makes the route safer for people who walk. Interpolation turns scattered measurements into a map, but its output is only as good as its sensor coverage. A model is not a measurement. Clear, honest metrics (heat dose, extra minutes) persuade better than claims. Local data collected by community members can power real civic tools.
What's next for CoolCorridor: Heat-Aware Routing to Cooling Centers
We have additional data for Menlo Park and East Palo Alto, communities that face even more urban heat island effects. Next, we will make CoolCorridor compatible with that data so residents there get the same heat-aware routes. We will also build a general data loader, so any city with NOAA/CAPA-style heat readings can plug in.
Beyond that, we plan to:
Add tree-canopy and building-shadow layers to capture shade directly Pull in live weather and heat advisories Build a phone app with turn-by-turn directions Give city staff a view of the hottest walking corridors, so they can place shade, water stations, and shuttle stops where walkers need them most
