-
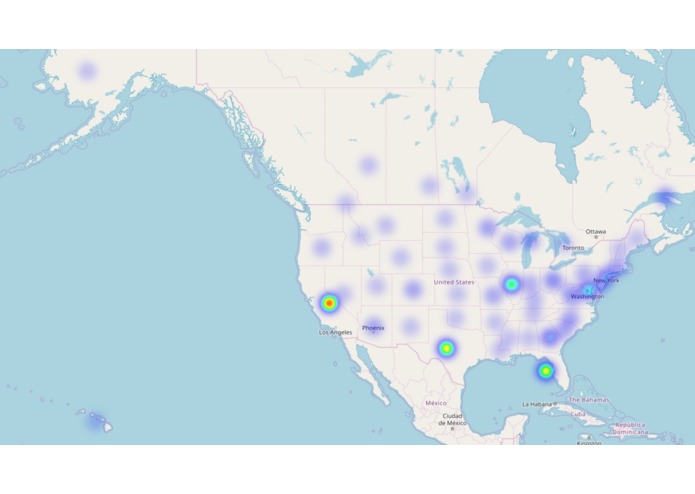
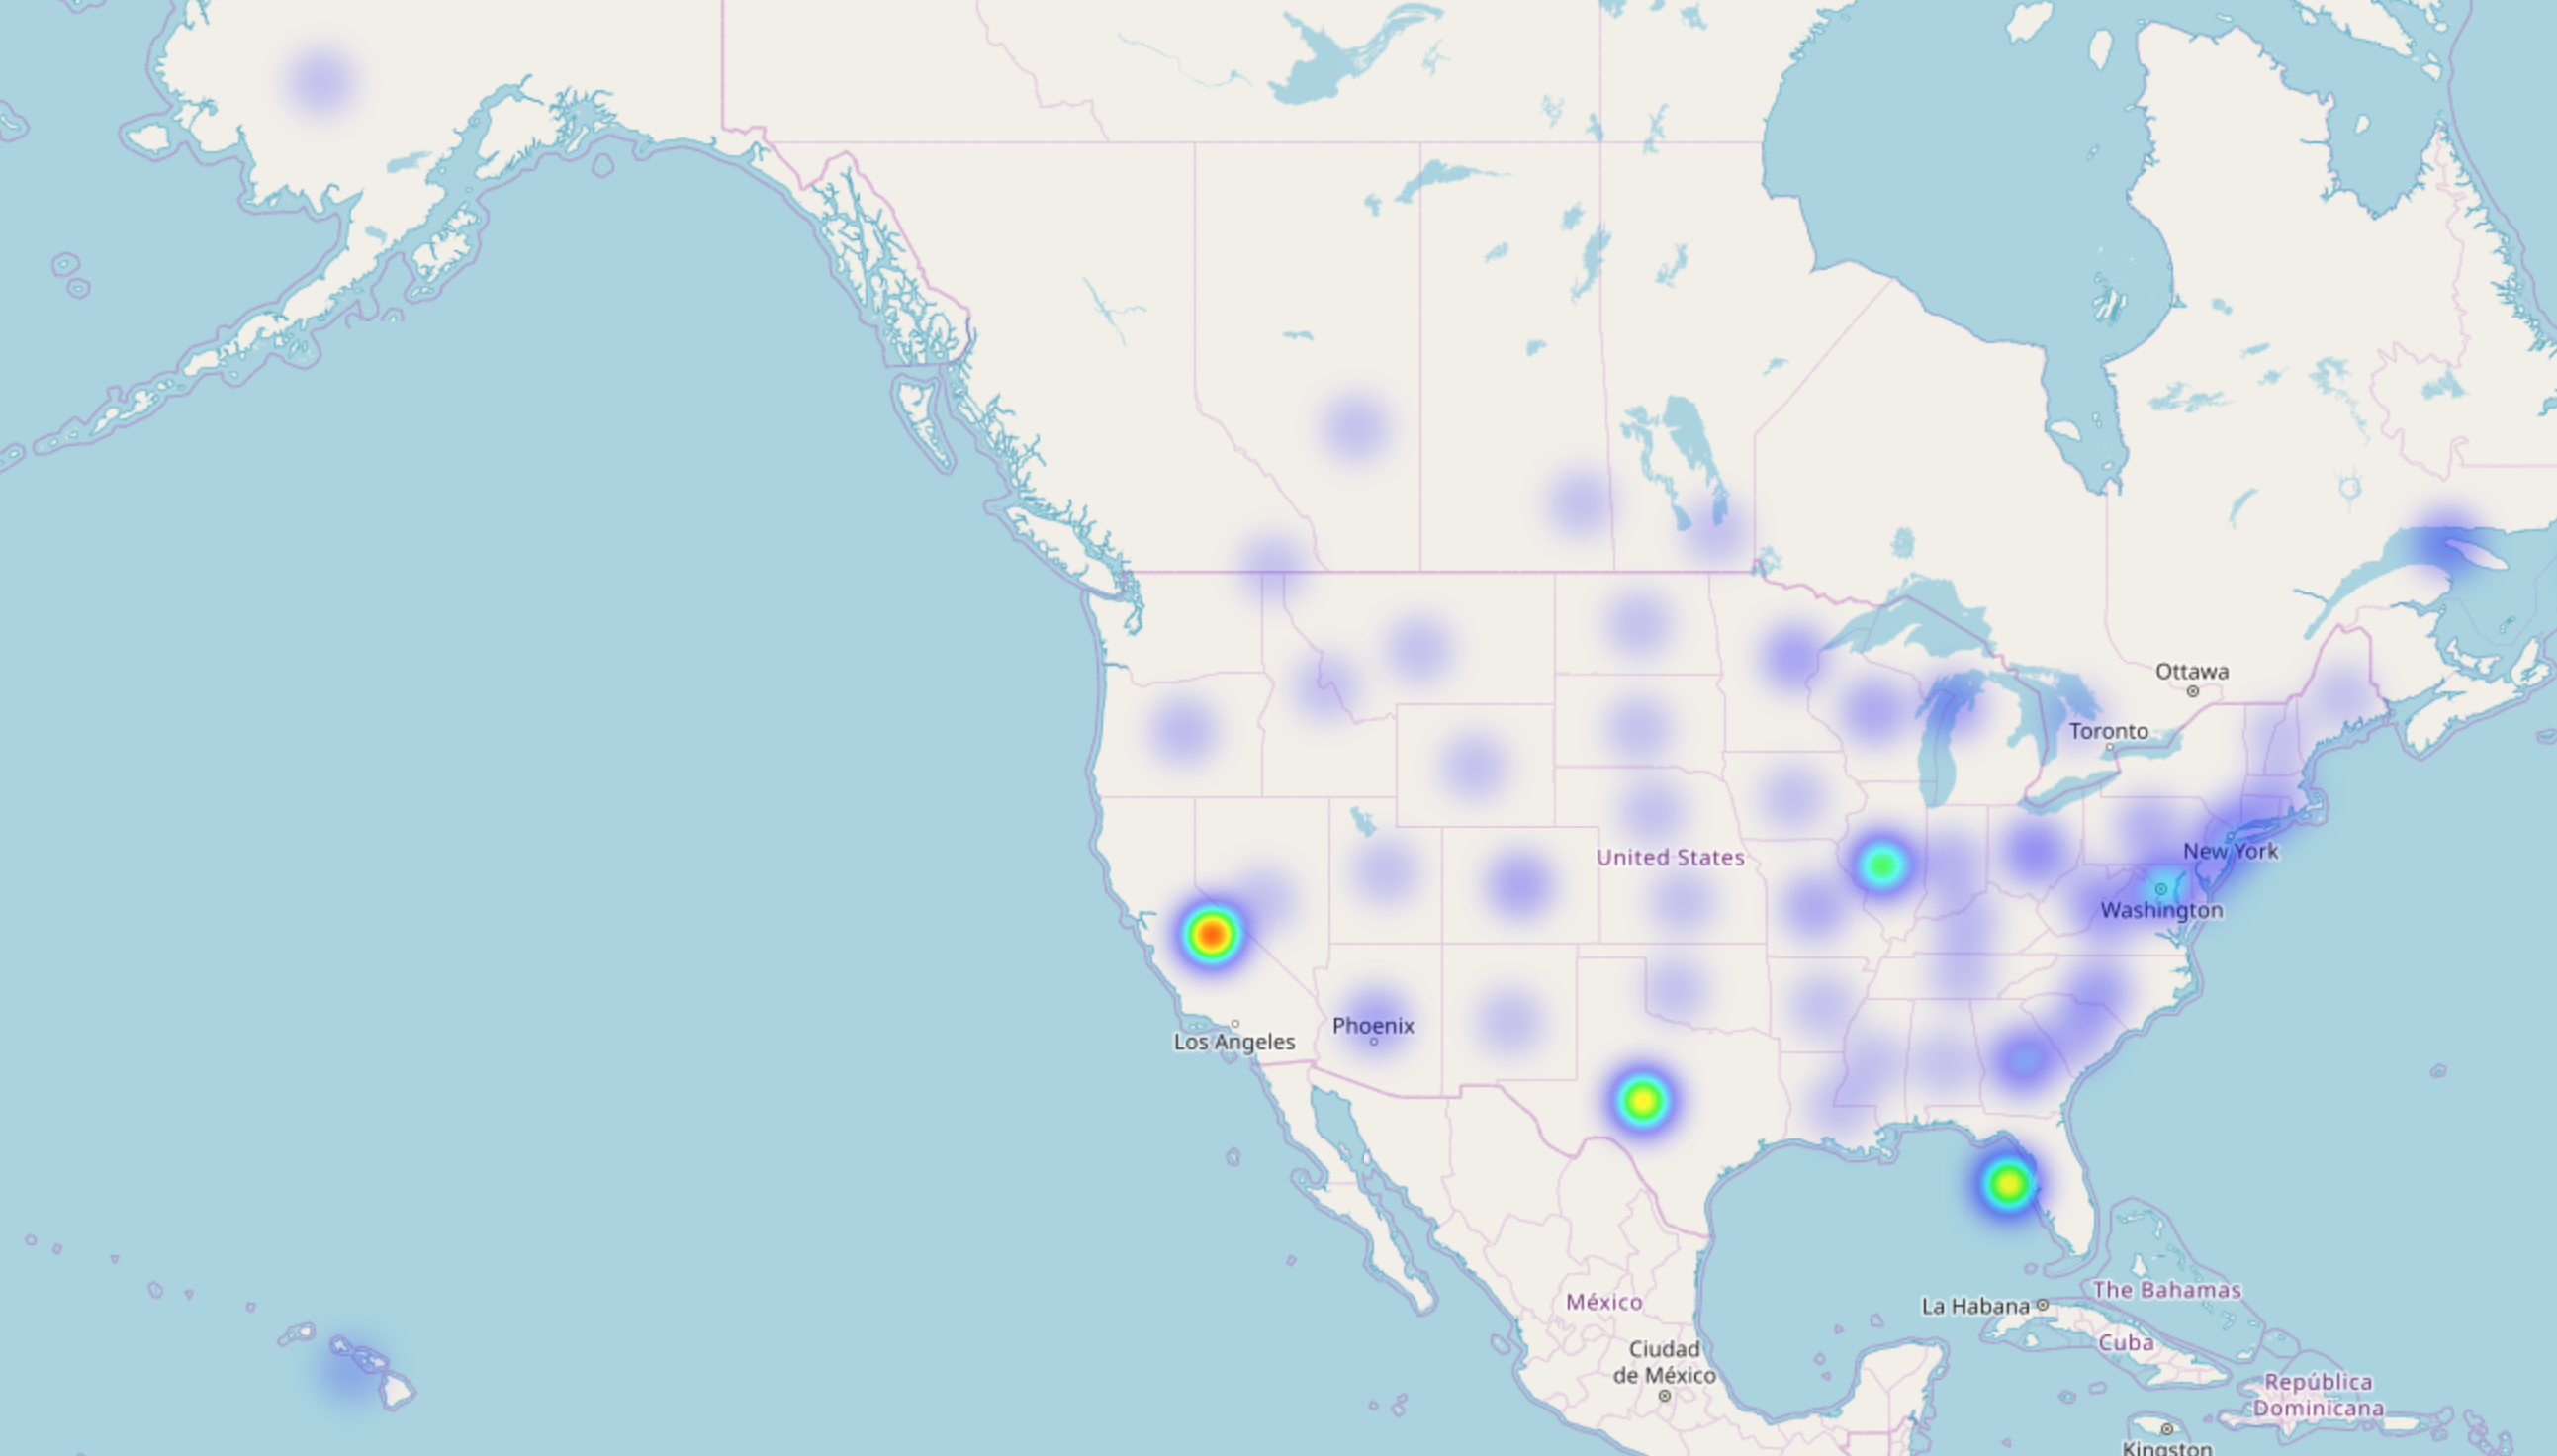
heatmap data for general count for all genres
Inspiration
Wanted to parse the huge amount of data to show something interesting about jukebox selections in North America.
What it does
Ideally, it should generate heatmaps of counts by genre for each pair of coordinates.
How We built it
We request data from the touchtunes API for one page (about 3000) entries for each day of the year and use that to create heatmap images in python. We output csv files containing the data and tie them to a website where they are displayed by genre.
Challenges I ran into
Properly formatting and receiving request data from the API, how exactly to display the images correctly, conversion issues (most of these are still challenges we're currently running into).
Accomplishments that I'm proud of
We we're able to parse a considerable amount of data.
What I learned
We need to have a better formulated idea right away when we start, to avoid being lost as to where to go next. In the future, to ensure a more successful project, I would start by spending a considerably larger amount of time planning.
What's next for ConuHacksIV
Starting off better to avoid misdirection and losing our way.


Log in or sign up for Devpost to join the conversation.