-
-

ControlForge
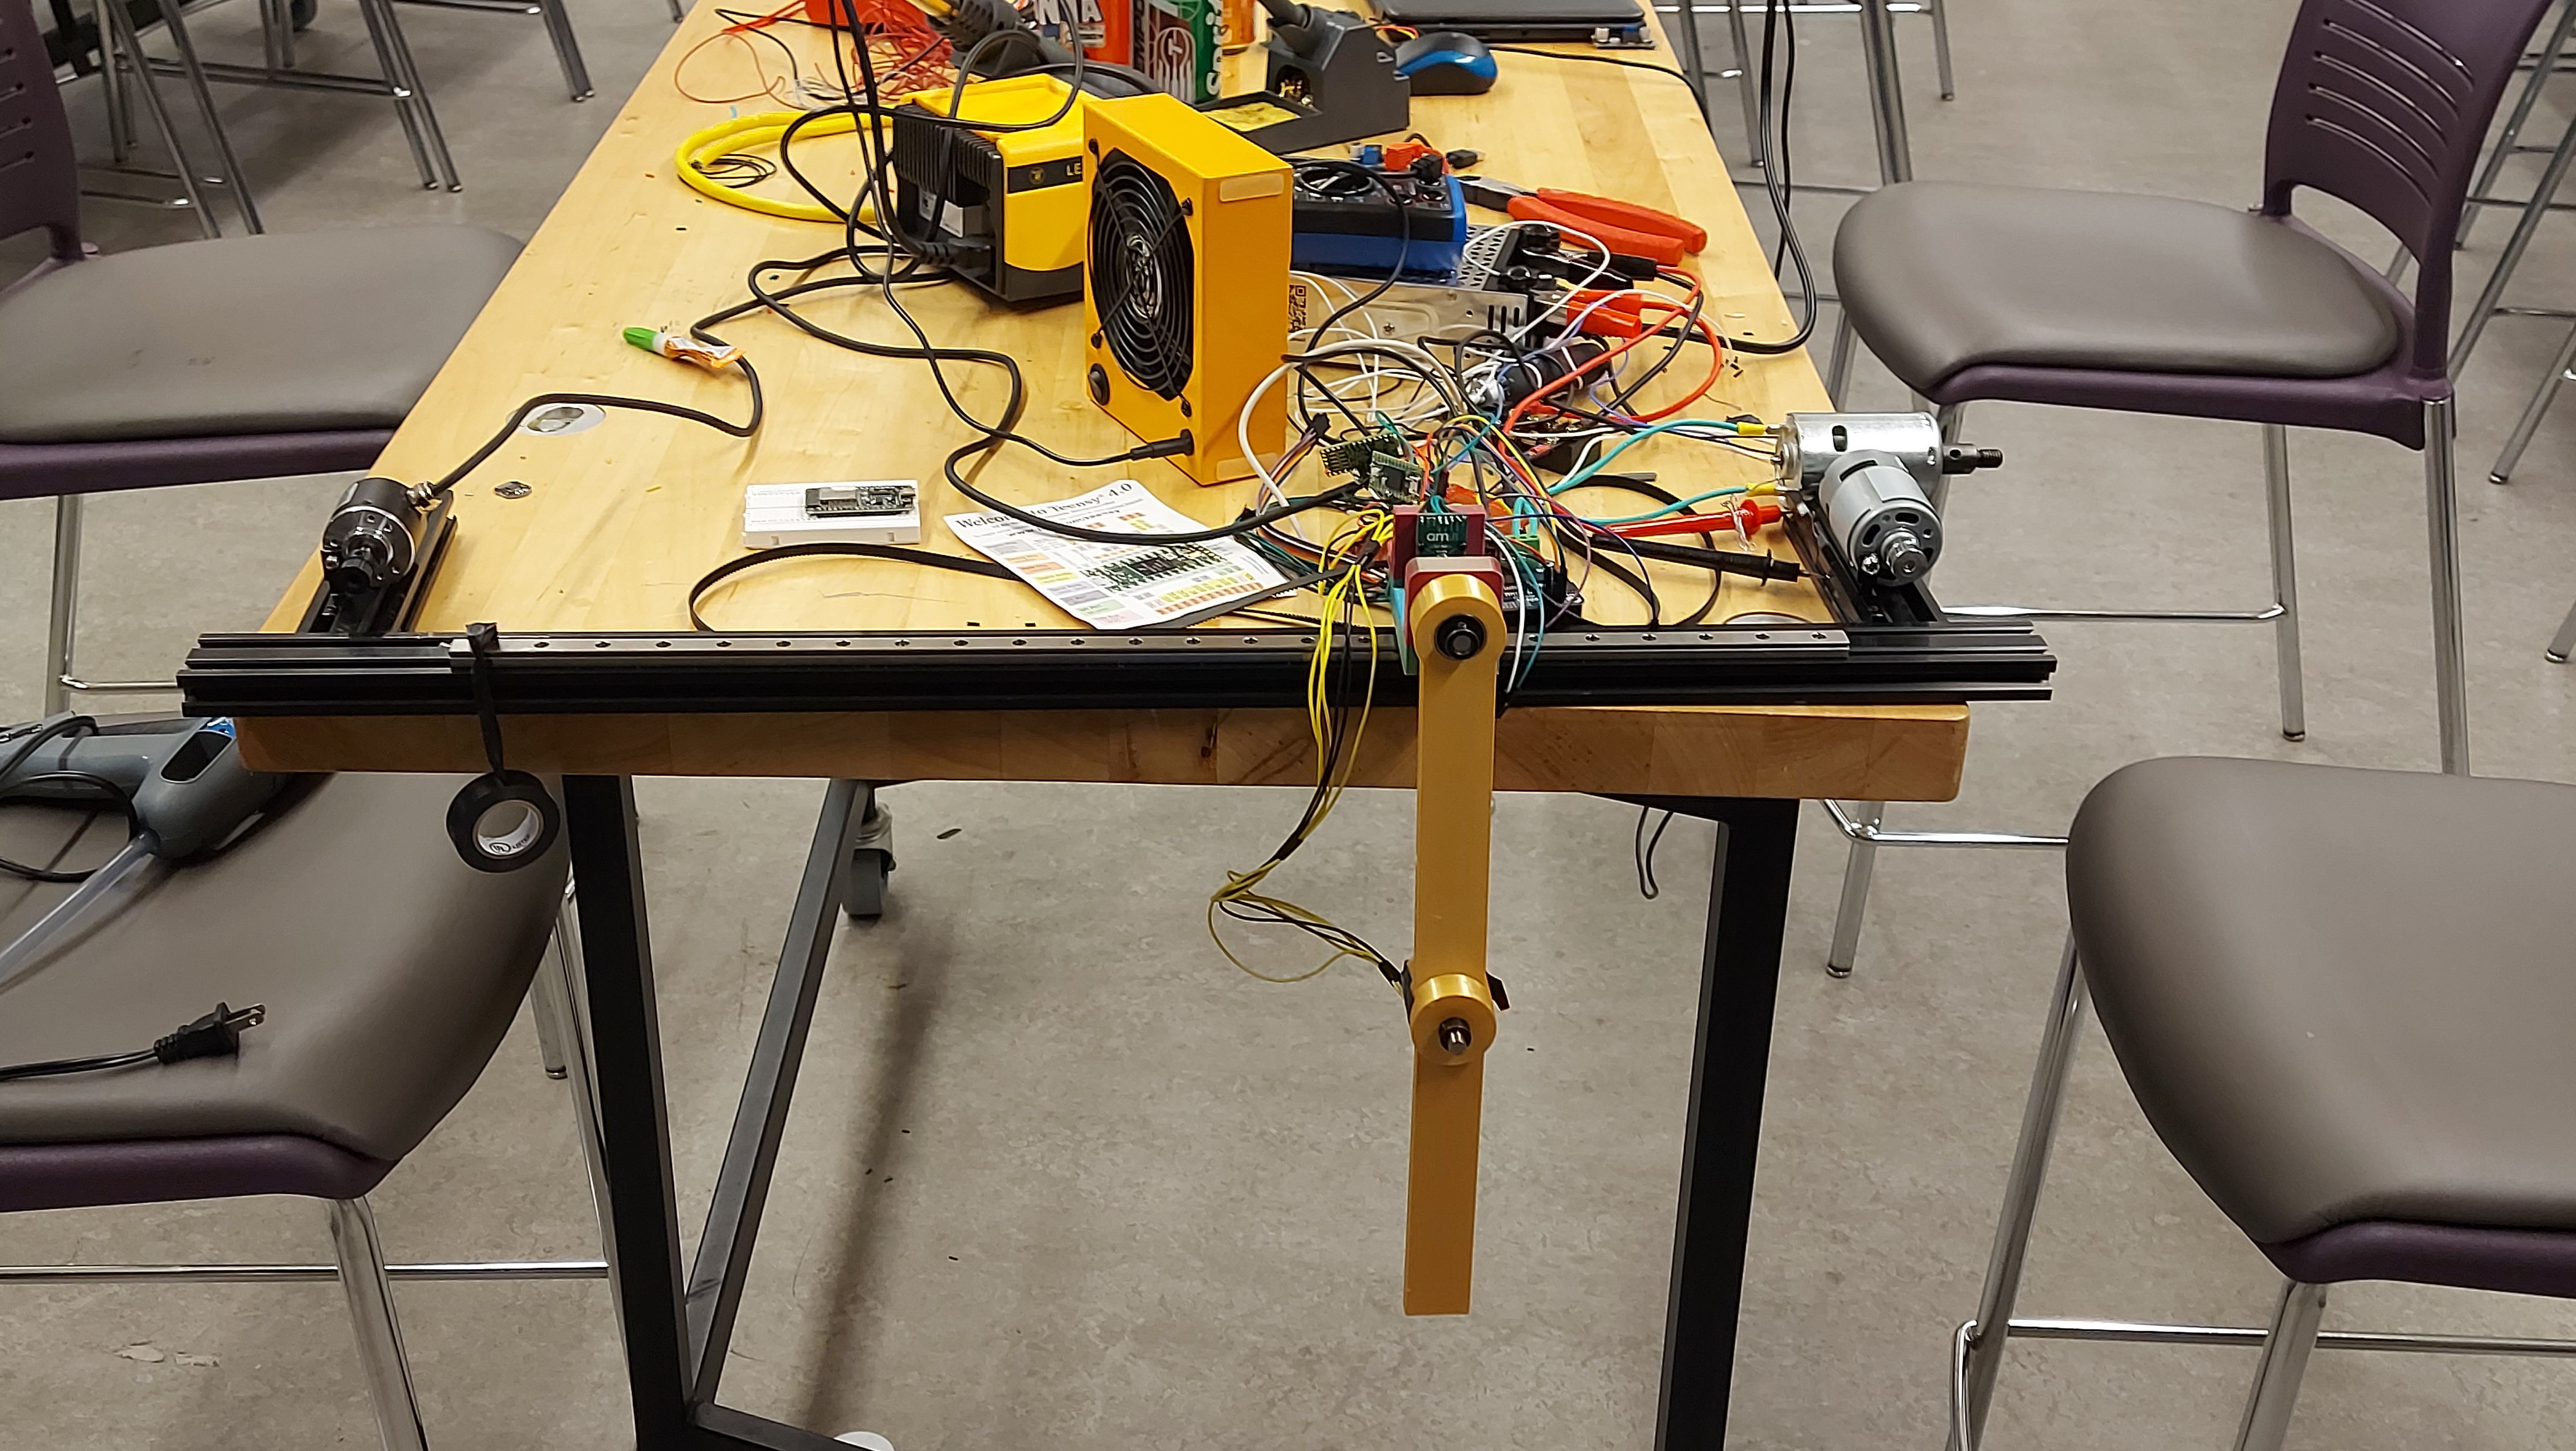
ControlForge was inspired by the challenge of building and understanding a real double inverted pendulum system. A double inverted pendulum is difficult because it is naturally unstable: the cart moves horizontally while two connected pendulum arms swing and react to each other. We wanted to create a project that was not only a physical hardware build, but also a tool that could help people see, measure, and understand what the system is doing in real time.
Our goal was to make control systems more visual and approachable. Instead of only looking at raw sensor numbers, ControlForge turns hardware data into live telemetry, graphs, animations, and run summaries. This makes the system easier to debug, explain, and improve.
ControlForge combines a physical double inverted pendulum setup with a dashboard. The hardware side includes a cart-pendulum structure, a Teensy microcontroller, and magnetic encoders that measure the pendulum angles. The software side reads data from the Teensy, displays the values, visualizes the pendulum motion, tracks system health, and generates reports from experiment runs.
The dashboard shows important state values such as:
theta1: first pendulum angle theta2: second pendulum angle theta1_dot: first pendulum angular velocity theta2_dot: second pendulum angular velocity cart_pos: cart position cart_vel: cart velocity
We built the software using Python and Streamlit. The dashboard includes multiple pages for telemetry, visualization, control preview and analysis mode. We used Plotly to create graphs and a live visual model of the cart double pendulum.
On the hardware side, we used a Teensy microcontroller to send telemetry data over USB Serial. The packet format is:
timestamp, theta1, theta2, theta1_dot, theta2_dot, cart_pos, cart_vel
The dashboard reads this packet, validates the values, and updates the live display. During development, we first used fake Teensy telemetry so the software could be tested before the real hardware was fully ready. Once the hardware was assembled, the same pipeline could be used for real encoder data.
One major challenge was combining hardware and software at the same time. The software needed to be ready before the hardware was fully working, so we created fake telemetry from the Teensy to simulate real sensor data. This allowed us to test the dashboard, visualization, packet reading, and reporting system early.
Another challenge was safety. A double inverted pendulum with a motor can become unstable quickly, so we decided not to send motor commands yet. Instead, we focused on telemetry data, visualization, and analysis first. This made the project safer and gave us a strong foundation before adding active control.
We also had to think carefully about data formatting. The dashboard only works if the Teensy sends clean packets in the correct order, so we used a consistent format. This made it easier to connect the hardware and software sides of the project.
We learned how important it is to build complex engineering projects in stages. First, we tested the software with fake data. Then, we connected serial communication. After that, we prepared the dashboard for real sensor readings. This step-by-step approach made the project easier to debug.
We also learned more about control systems, telemetry, microcontrollers, real-time data visualization, and hardware safety. ControlForge taught us that a successful hardware project is not only about building the physical system, but also about building tools to understand and test it.


Log in or sign up for Devpost to join the conversation.