Continuous Quality
Chenren Shao, Brandon Pang, Paul Flynn
Inspiration
At FINRA, a lot of our tests are done with the JTAF tool. Most of these utilize a failsafe plugin that automatically generates .xml reports of the test run, listing which test cases passed and which ones failed. However, the .xml is not convenient to find or easy to read. At the same time, Jenkins can track JTAF run performance, but only in the form of a +x / -x metric, letting you know how many test cases failed compared to the last run.
We wanted an easier way to view these test results. We also wanted more thoughtful analysis. And, when we first started drafting our ideas, we realized we didn't want to limit our tool to JTAF. Our goal was to create a universal analysis tool for unit and integration tests, provided they give their results in a junit/failsafe style report.
What it does
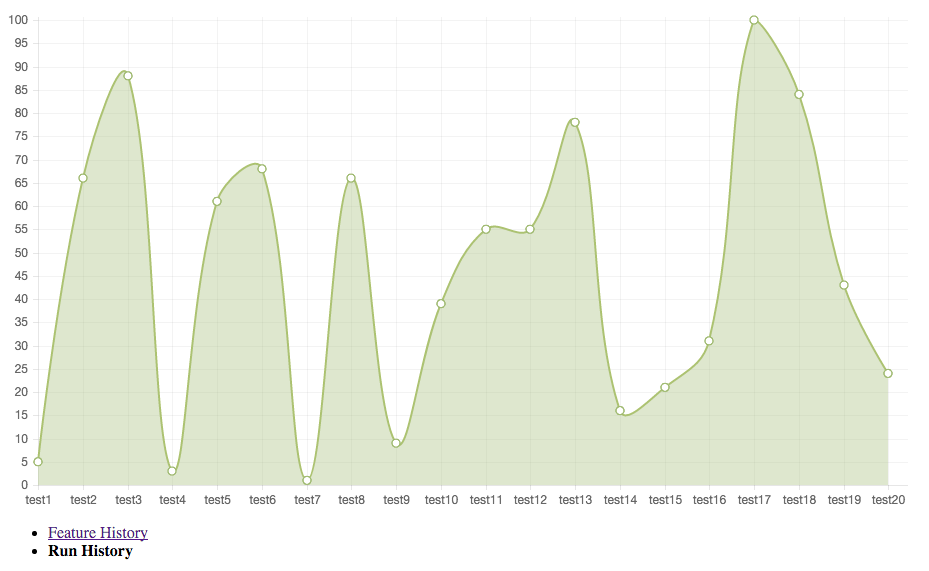
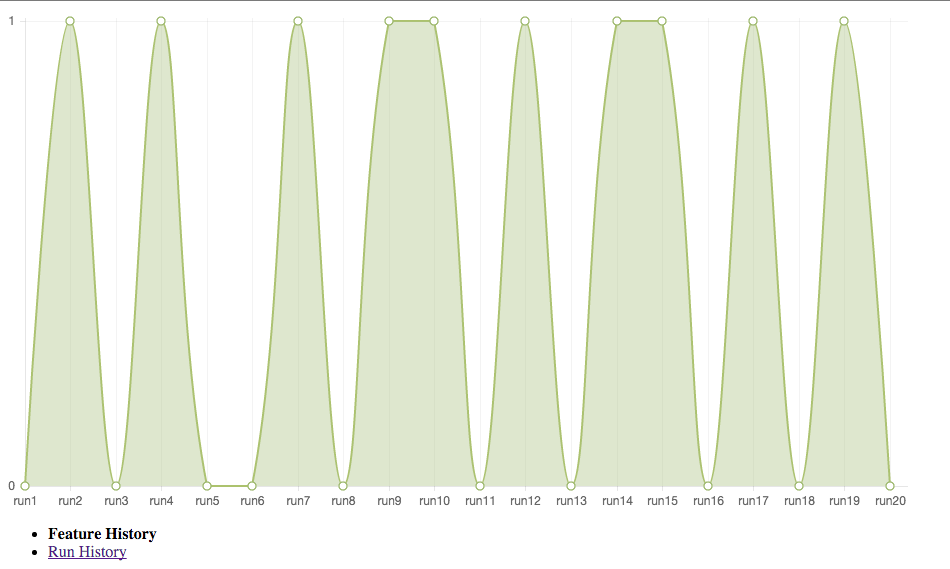
Continuous Quality trawls test reports and saves test performance to a database. The GUI aspect allows users to access sets of the data in different views; you can choose to see a test suite's success rate over time or the success rate of a specific feature's test steps.
How We built it
We used a Java xml parser to strip the junit style test reports and jdbc to save the info to a database. The client gathers information from the user which is sent back to the database through REST calls. After the information is passed to the database, the REST service gathers the data requested by the user in JSON format. To make the graphing widget easier to work with, we created a custom parser in python to turn the JSON responses into arrays. The graphs are powered by chart.js, an open source javascript library.
Challenges We ran into
Only one of us is experienced with UI development, which made balancing the workload for designing the client difficult. Another challenge was that we did a full stack service, designing both the front and back end. Given the time constraints, this made it hard to implement all the ideas we had. Also, despite the fact that we finished all the moving parts, it ended up being very extremely difficult to put the machine together; waiting until the end to integrate gave us a pretty bad headache. The irony was not lost on us.
Accomplishments that We're proud of
It works and is a complete solution. While it isn't pretty, we're very excited to have implemented it any form at all in the time we were given. It is also a universal solution; while the inspiration came from FINRA's JTAF, it can pull data from any junit style .xml reports. In fact, by switching out the initial parser, it can be extended to work with any type of test report as the input.
What We learned
It's tough to use the principles of continuous delivery on a 12 hour project, especially one with a hard deadline. We also learned that we're not as comfortable with javascript as we would like to be.
What's next for Continuous Quality
With less than 12 hours of dev time, we didn't get to accomplish everything we wanted to, and the site is not as pretty as it could be. We were only able to implement data collection from .xml failsafe reports, but we want to extend our coverage to all types of test reports. Some of the other planned features include being able to pull up run specific data from a graph view by clicking the corresponding point on the graph. If we had unlimited time, we also would have explored what other data views are useful and tried to implement more than the two graphs we included.


Log in or sign up for Devpost to join the conversation.