Inspiration
Every engineering team lives in Jira. Tasks pile up, story points get estimated, deadlines loom. But here's the problem: Jira tells you what already happened. It doesn't warn you about what's coming.
So managers are stuck playing detective. They scroll through tickets, check Slack, and maybe ask around in standups. They're guessing at questions that actually matter:
- Can this engineer handle another sprint's worth of work?
- Is that deadline quietly about to blow up?
- Who's overloaded but not saying anything?
We built Context Radar because that shouldn't be a guessing game. What if your tools could spot the warning signs before everything catches fire?
That's the idea: turn Jira from a record-keeper into an early warning system.
What It Does
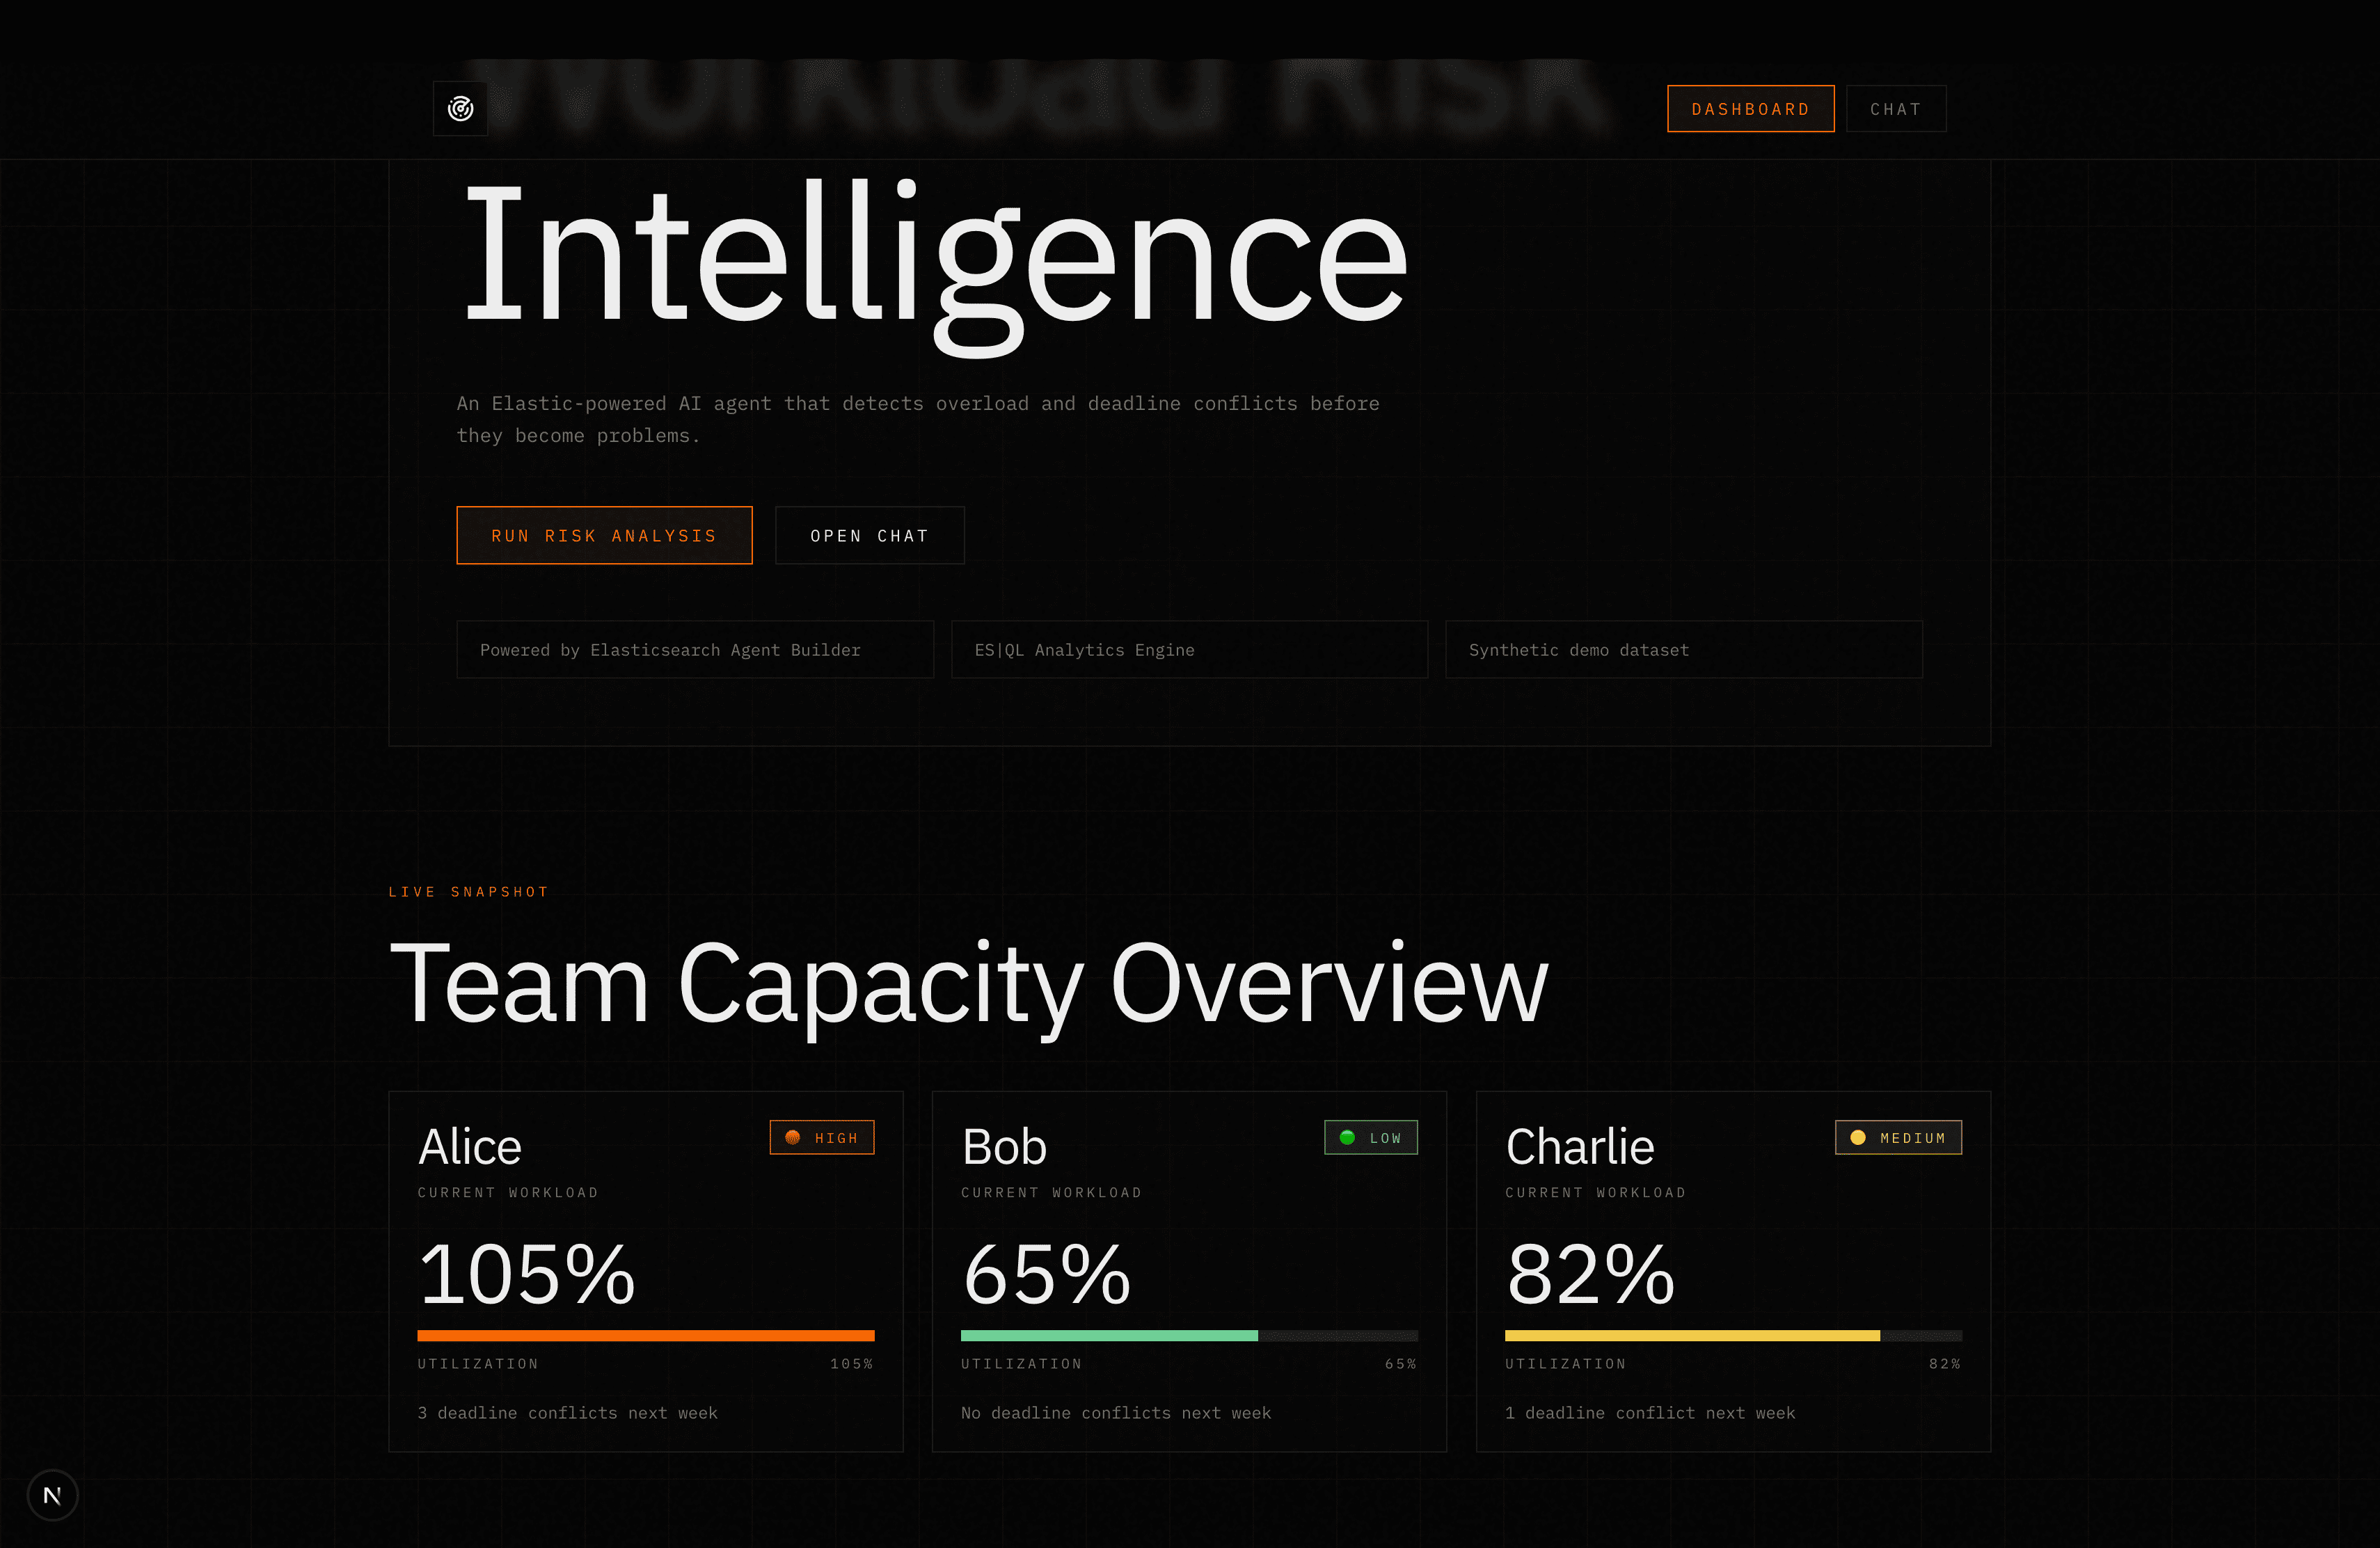
Context Radar transforms Jira from a static task tracker into an intelligent workload radar. It connects to your Jira Cloud instance, continuously syncs issue data into Elasticsearch, and exposes a natural language interface where you can ask real questions about your team's capacity and risks.
Here's how it works:
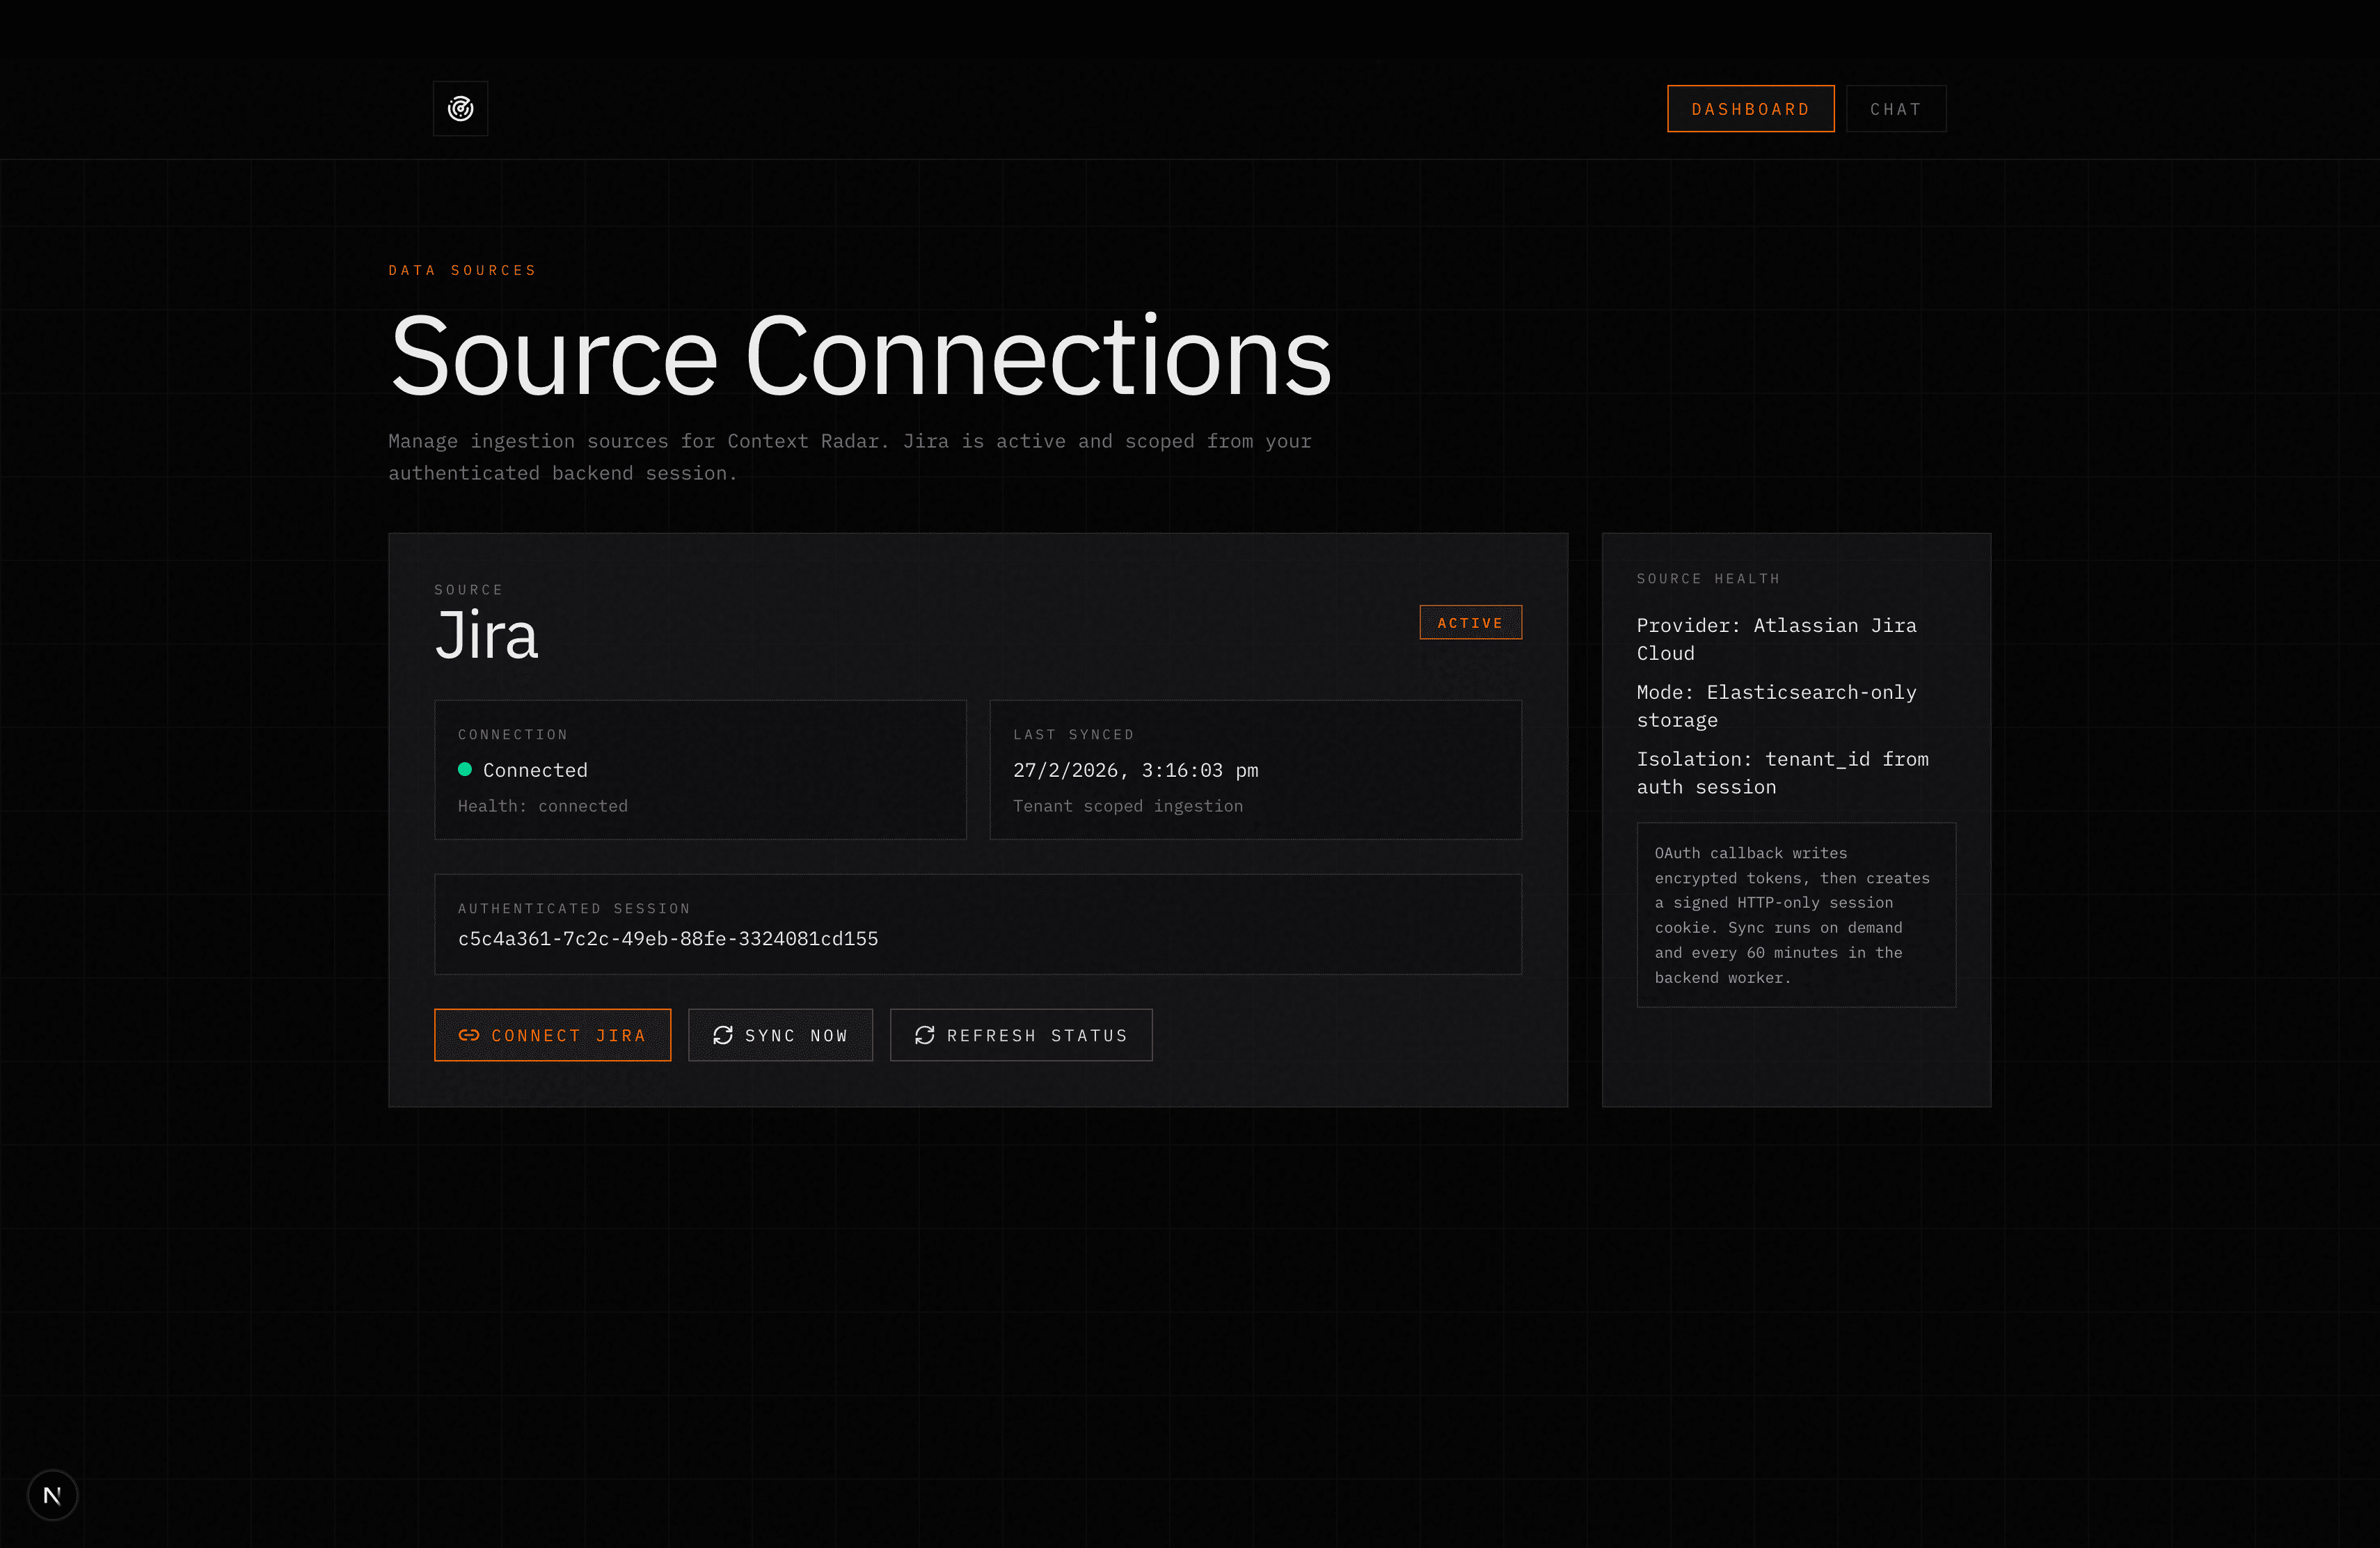
Connect — One-click OAuth with your Jira Cloud account. We encrypt and store your tokens securely in Elasticsearch (AES-256-GCM), never touching our servers.
Sync — A background worker pulls your issues every hour, normalizing them into a clean workload format: assignee, effort estimate, due dates, status, and project context. Everything lives in Elasticsearch under your isolated tenant ID.
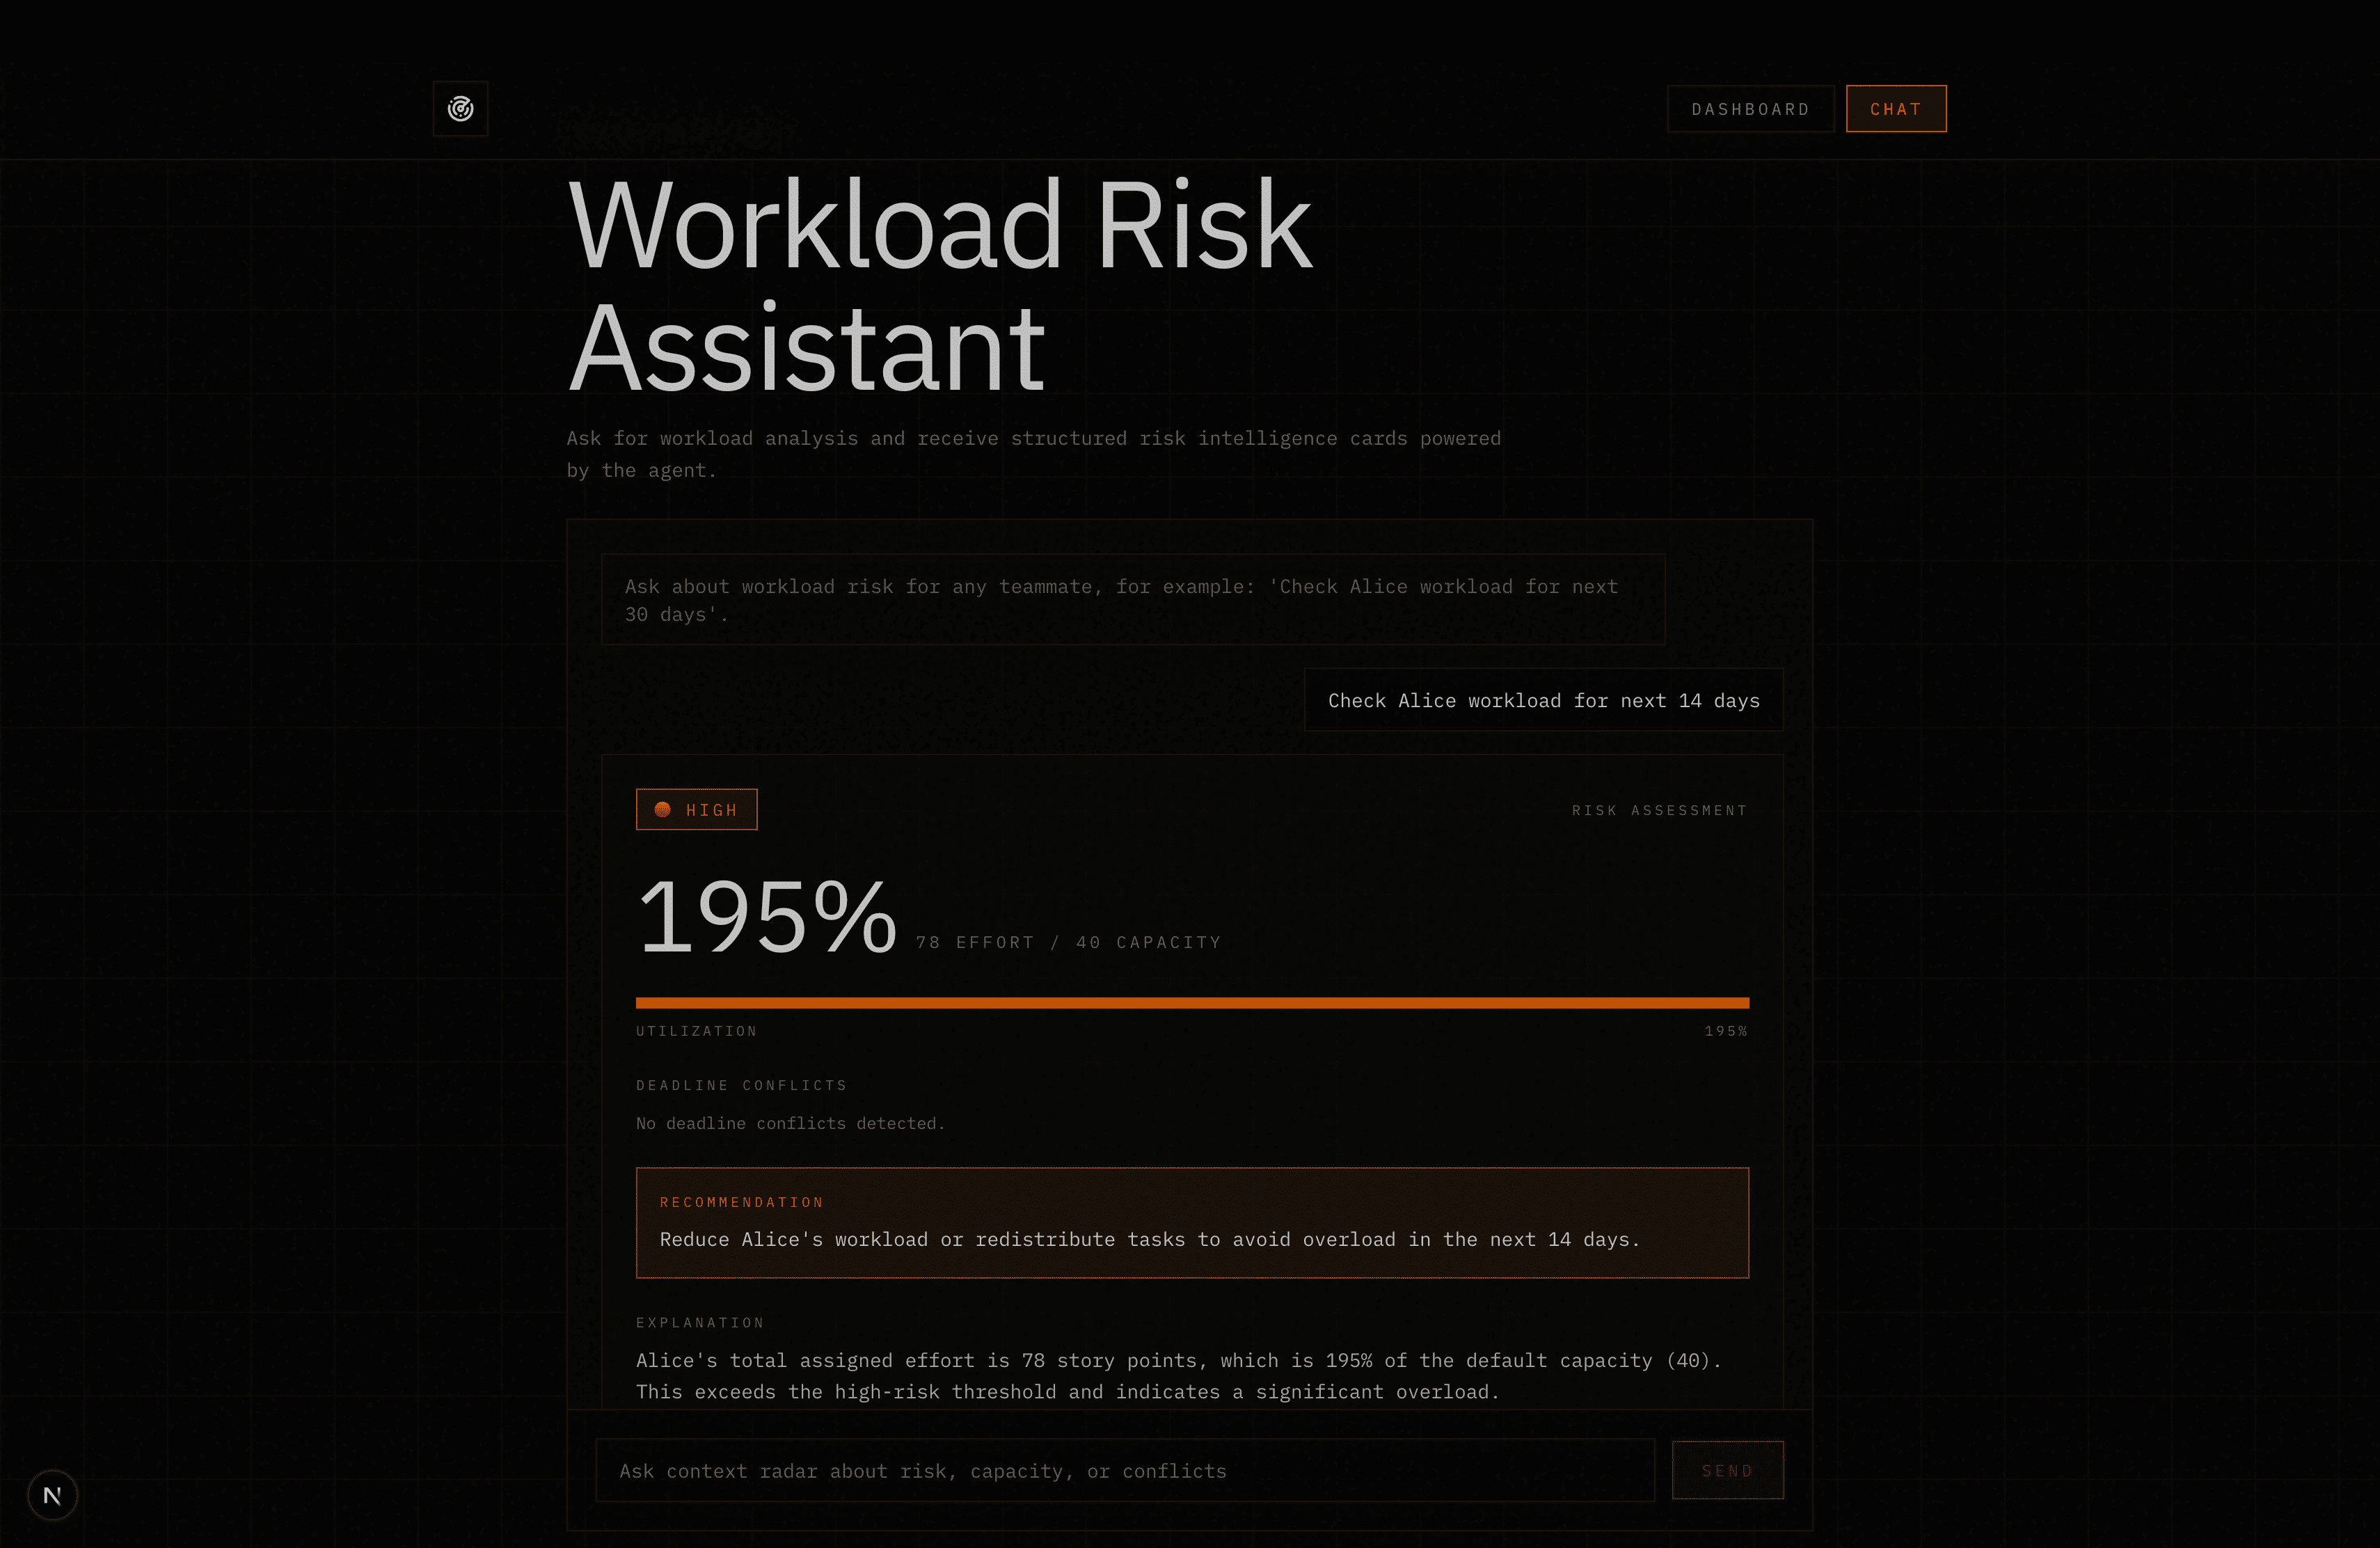
Analyze — When you ask a question like "Is Bob overloaded this month?" or "Compare Alice vs Charlie for the next sprint," our backend forwards your query to the Kibana Agent Builder along with your tenant context. The agent runs specialized ES|QL tools we built:
capacity_analyzer— Calculates total effort vs. assumed capacity (40 points) and utilization percentageconflict_detector— Identifies weeks where assigned effort exceeds safe thresholds (15+ points)project_context_summary— Surfaces up to 25 relevant workload items for broader context
Act — The agent returns structured JSON with risk levels (LOW, MEDIUM, HIGH), specific metrics, detected conflicts, and concrete recommendations. No raw ticket dumps. No digging required.
You get answers like:
| Risk Level | Utilization | Conflicts | Recommendation |
|---|---|---|---|
| HIGH | 105% | Week of Oct 15, Oct 22 | Reassign 2 tickets or extend deadline |
| LOW | 65% | None | Can absorb 2-3 additional 3-point tasks |
The frontend renders these as rich, interactive cards with capacity bars, color-coded risk badges, and side-by-side comparisons. Ask in plain English. Get clarity instantly.
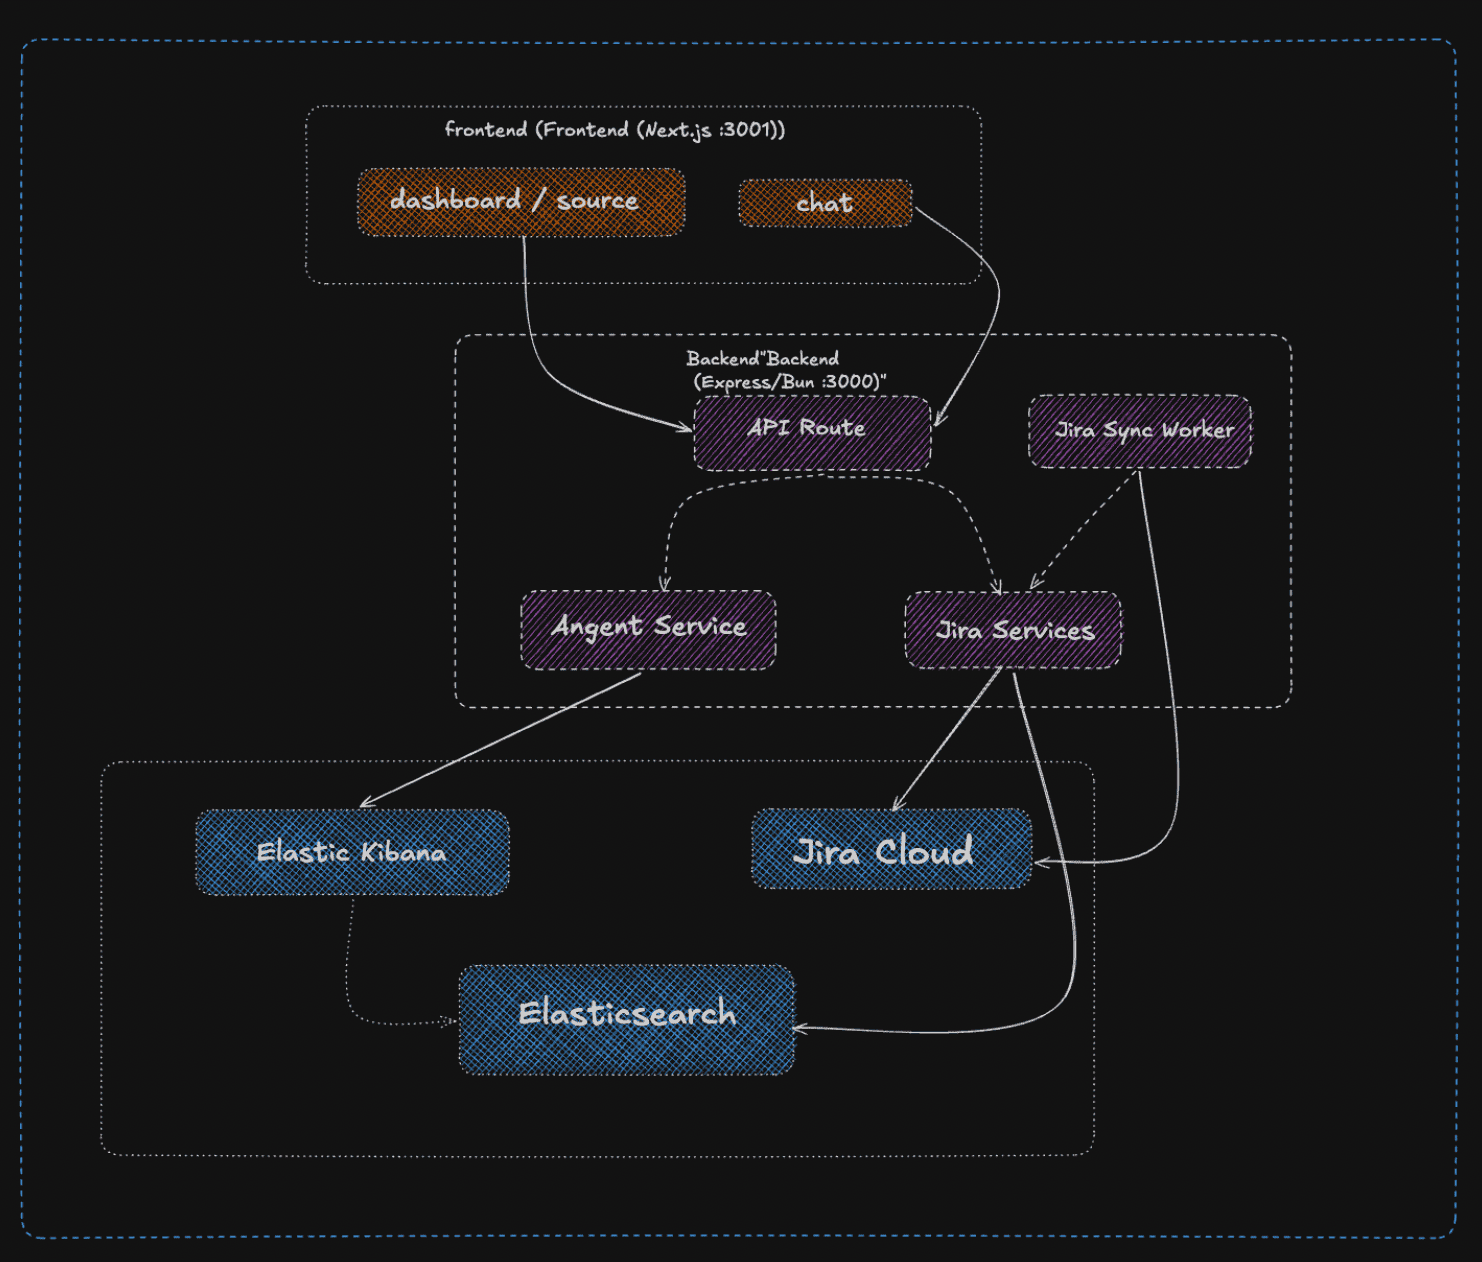
How We Built It
Three layers working together:
Data Layer — Connect Jira via OAuth, pull issues with JQL, normalize them into clean workload documents. Everything lands in Elasticsearch with tenant_id tags for isolation. No secondary database—Elasticsearch stores encrypted credentials, workload data, the lot.
Intelligence Layer — A custom agent running on Kibana Agent Builder, equipped with three ES|QL tools. The LLM provides reasoning, but all workload math is deterministic and enforced by Elasticsearch queries. Structured JSON out, minimal hallucination.
Risk Model — Dead simple:
$$\text{Utilization} = \frac{\text{Assigned Points}}{\text{Capacity}}$$
Cross 100%? That's a conflict week. Risk levels flow from there: green under 80%, yellow 80-100%, red above.
Security — All hand-rolled. JWT sessions signed with HS256, stored in HTTP-only cookies. OAuth tokens encrypted with AES-256-GCM at rest. CSRF protection via encrypted state nonces. No Passport, no Auth0, no bloat.
Keeping It Fresh — A background worker wakes up every hour, refreshes OAuth tokens, fetches latest Jira data, normalizes, re-indexes. Your radar stays current without anyone lifting a finger.
Challenges We Ran Into
Keeping tenants apart. One Elasticsearch cluster, multiple teams. We scoped every query by tenant_id from the start—no exceptions.
OAuth headaches. Tokens expire. States need validation. Everything wants encrypting. Secure auth is just inherently messy.
Taming the AI. We needed structured data, not chatbot rambling. Getting the agent prompts to return clean JSON took iteration.
What We're Proud Of
Hand-rolled security that actually works. No external auth libraries, no shortcuts. Custom JWT sessions, AES-256-GCM encryption, the lot. It was more work, but we own every line.
Elasticsearch as the everything store. No database sprawl. Credentials, workload data, search—all in one place. Simpler architecture, less to break.
Shipping a full stack in hackathon time. OAuth, background workers, encryption, AI orchestration, polished UI. We didn't cut corners where it mattered.
What We Learned
Elasticsearch can be your everything. We ditched Postgres and put credentials, sessions, and app data straight into indices. Surprisingly smooth once we committed.
ES|QL beats Query DSL. Writing analytics felt like SQL, not wrestling nested JSON. Way faster to iterate.
Agent Builder saves you months. Register your tools, write a solid system prompt, and Kibana handles the LLM orchestration. We didn't build any of that ourselves.
Encryption is fiddly. AES-256-GCM in Elasticsearch works, but managing IVs, auth tags, and key formats ate more debugging time than expected.
What's Next
Proactive alerts. Instead of waiting for you to ask, the agent should surface risks automatically. "Alice just got assigned a 13-point ticket and she's already at 95%."
Multi-source context. Jira is just one piece. Pull in GitHub activity, Slack status, and calendar density. A fuller picture of actual capacity.
Built With
- bun
- elasticsearch
- framer
- jira
- jwt
- kibana
- motion
- next.js
- openai
- radix
- recharts
- tailwind
- typescript

Log in or sign up for Devpost to join the conversation.