-
-
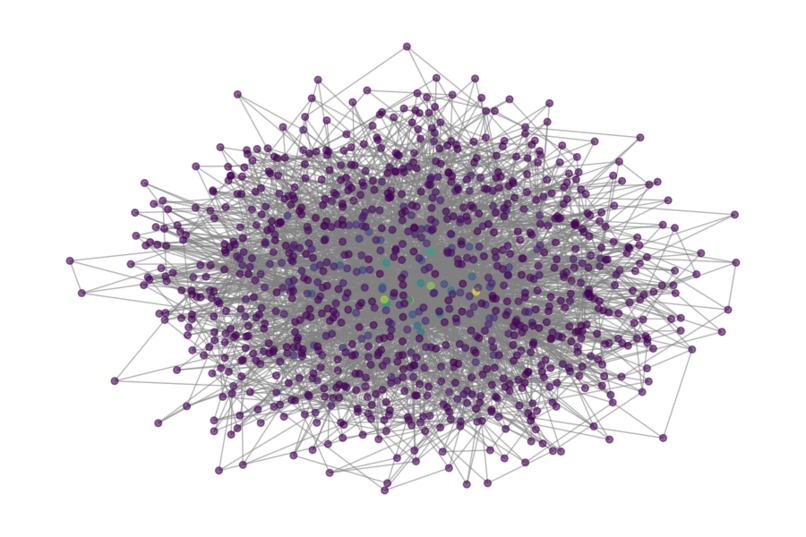
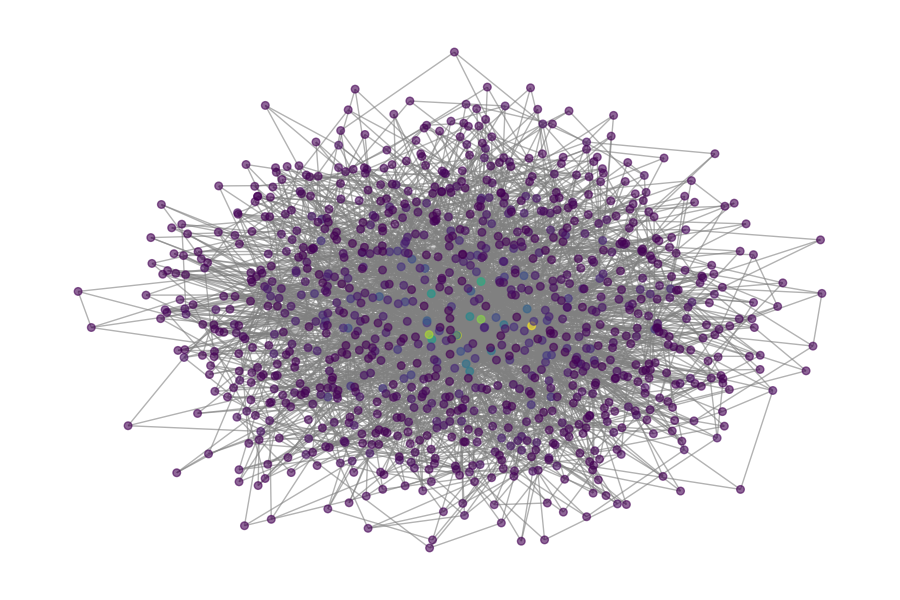
network_structure.png — establishes the substrate, visually shows hub structure
-
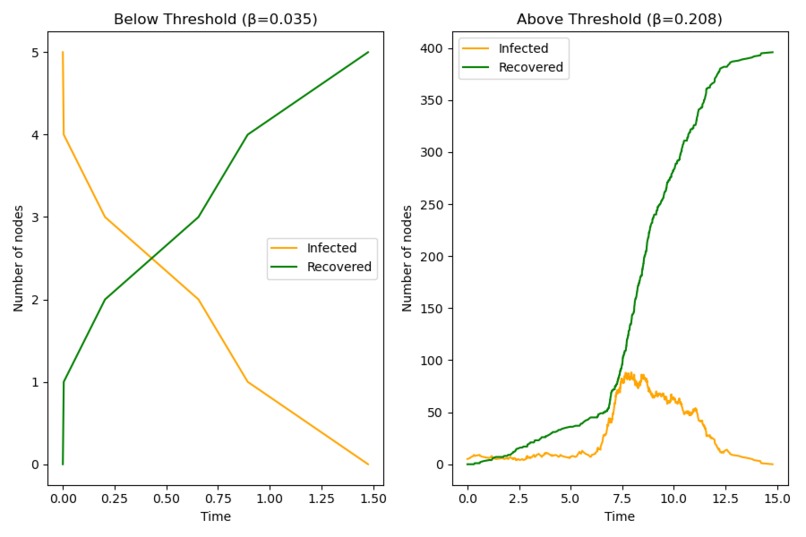
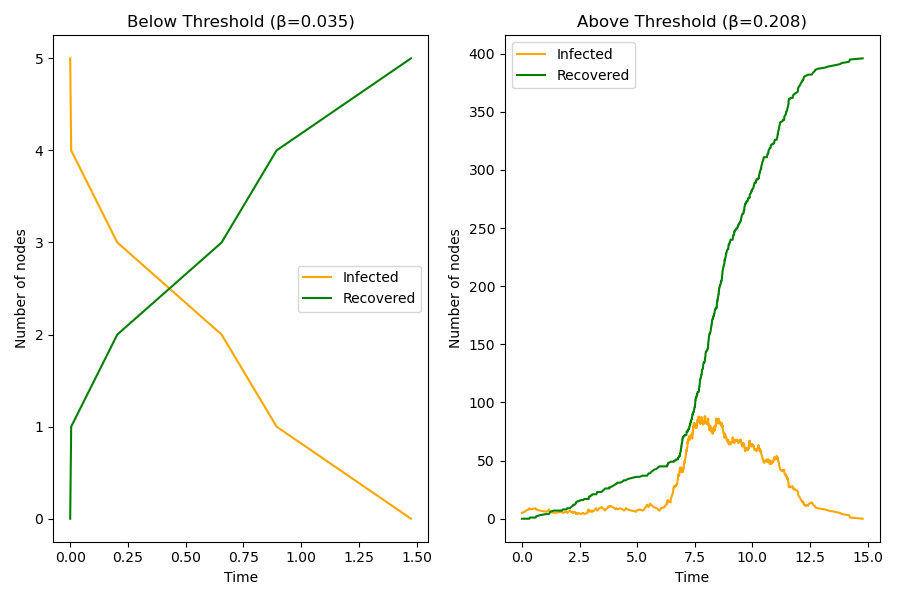
threshold_validation.png — the below/above-threshold comparison, proves rigor early.
-
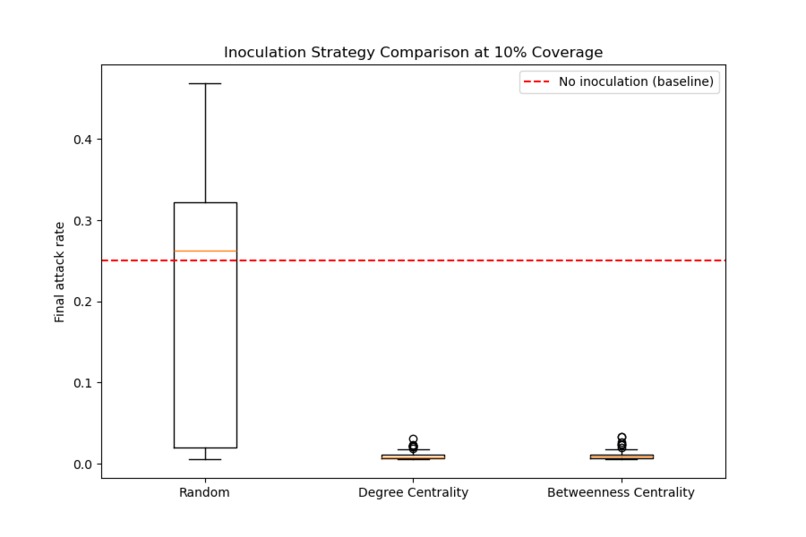
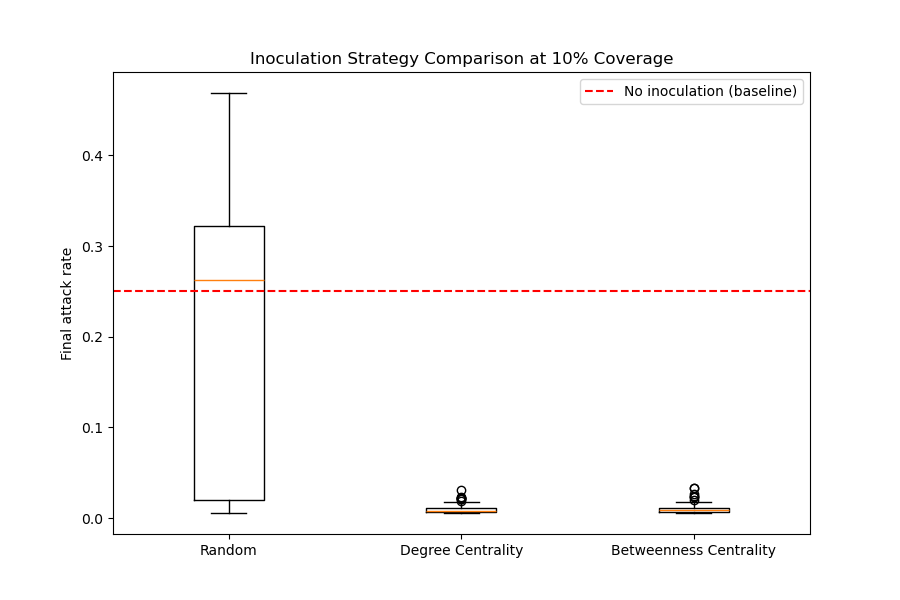
strategy_comparison_10pct.png — the three-way boxplot at fixed coverage, first 'aha'.
-
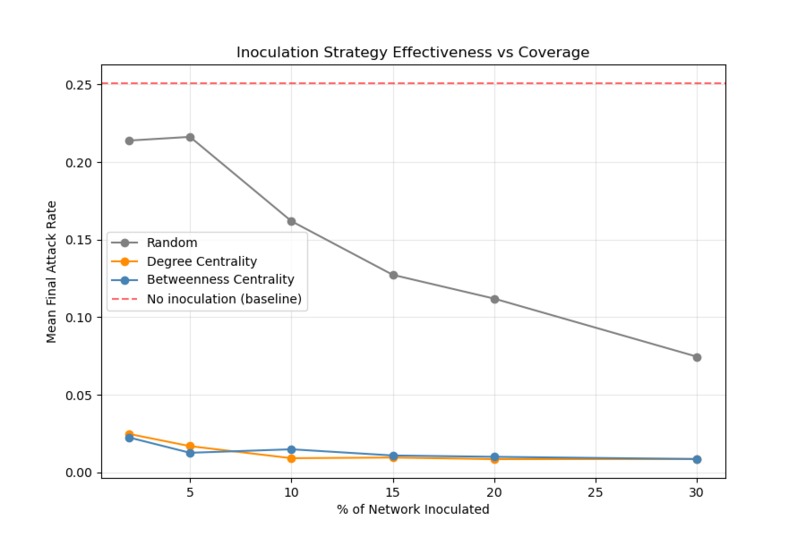
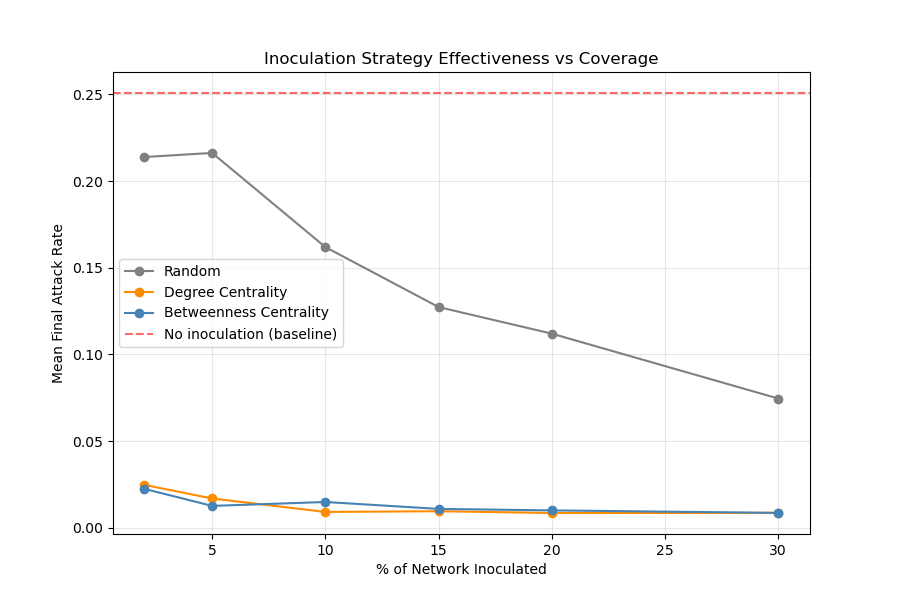
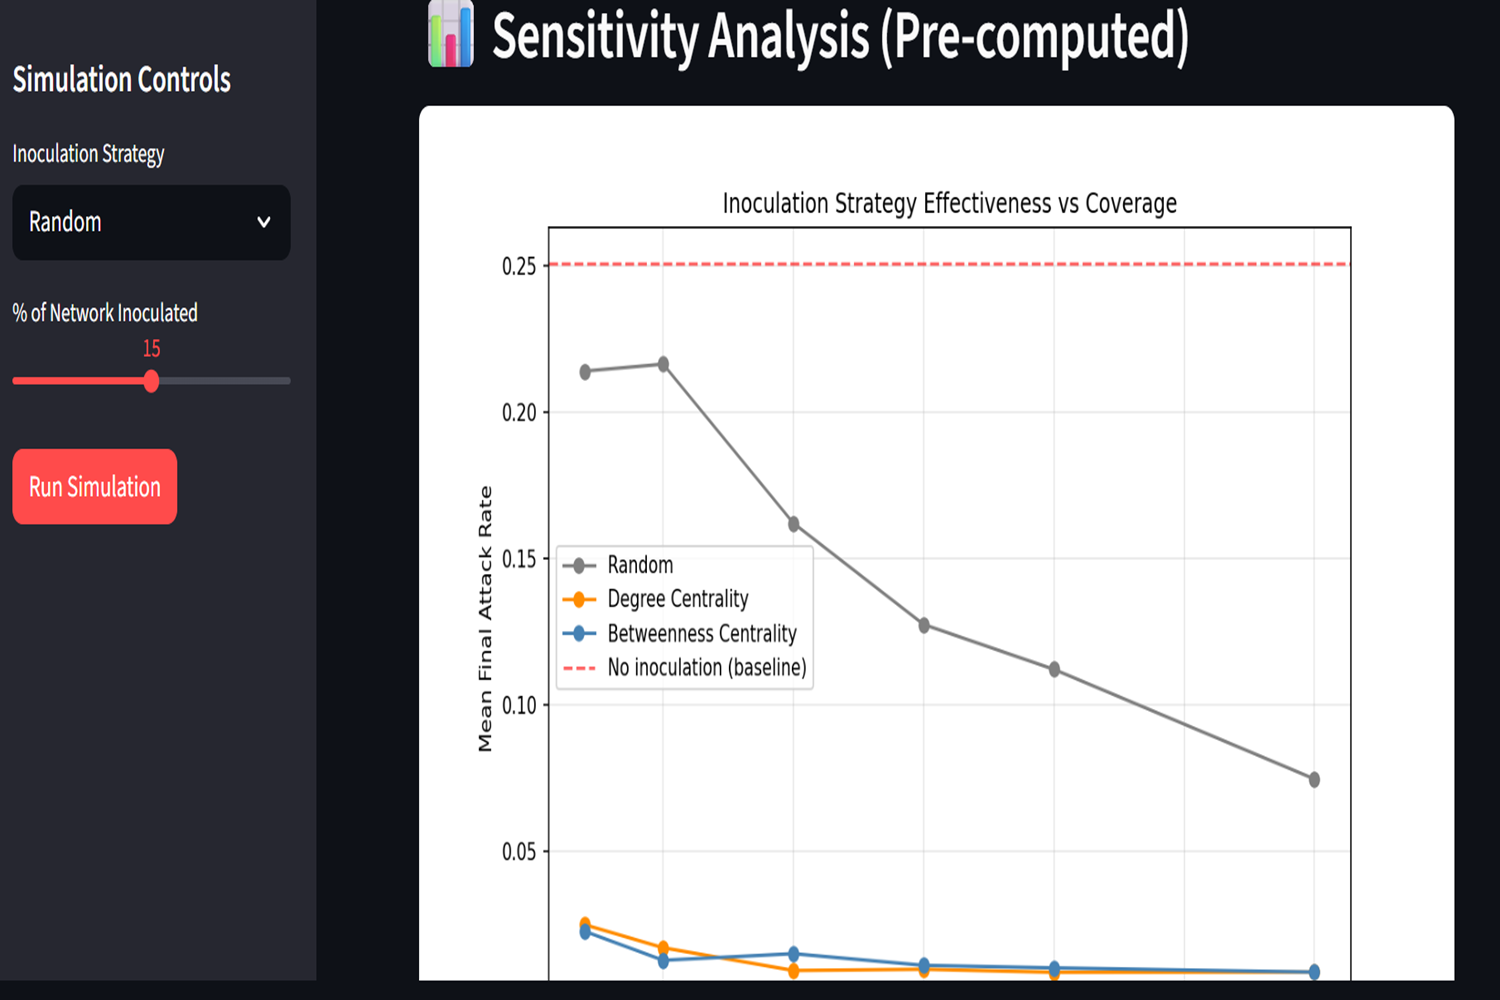
sensitivity_sweep.png — the centerpiece chart, should appear early/prominently given its importance.
-
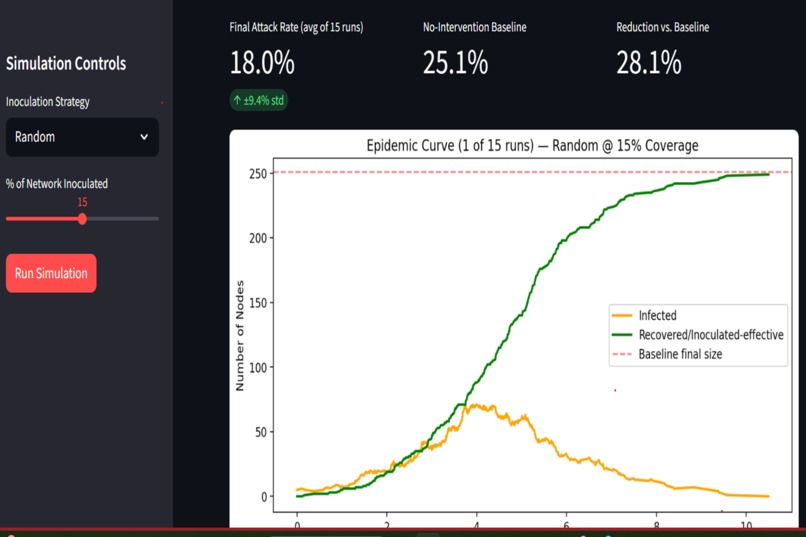
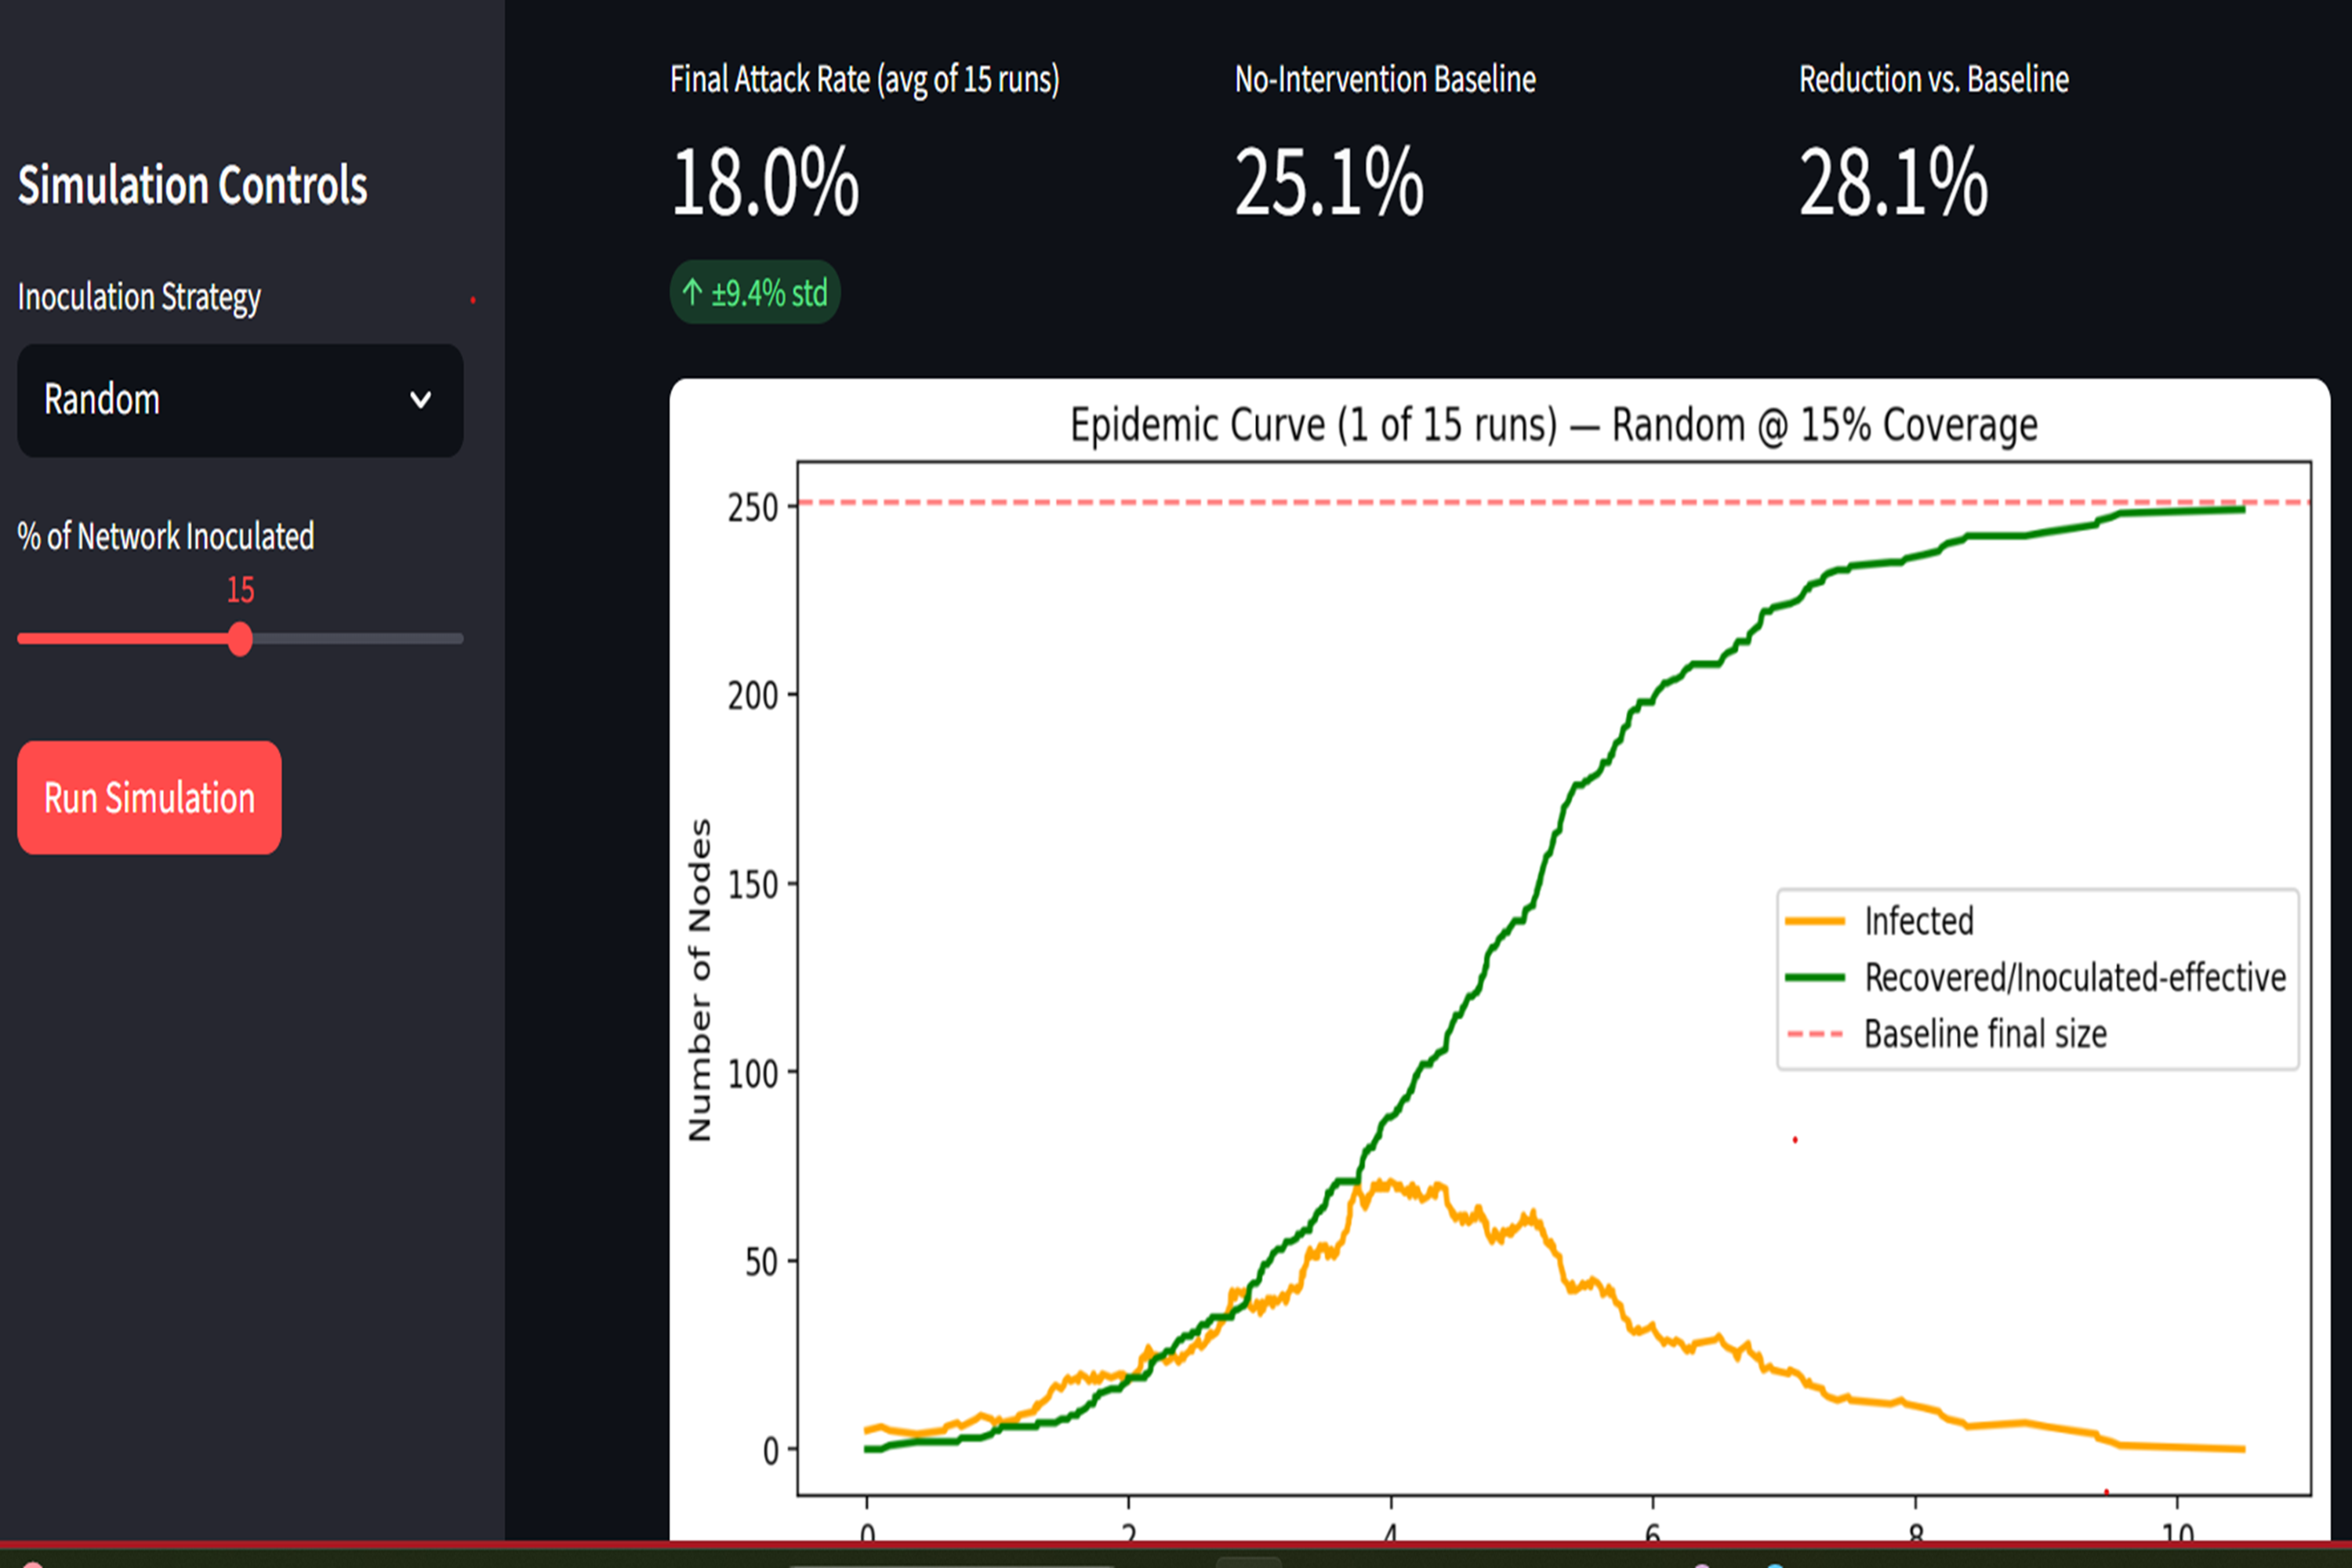
Epidemic Curve
-
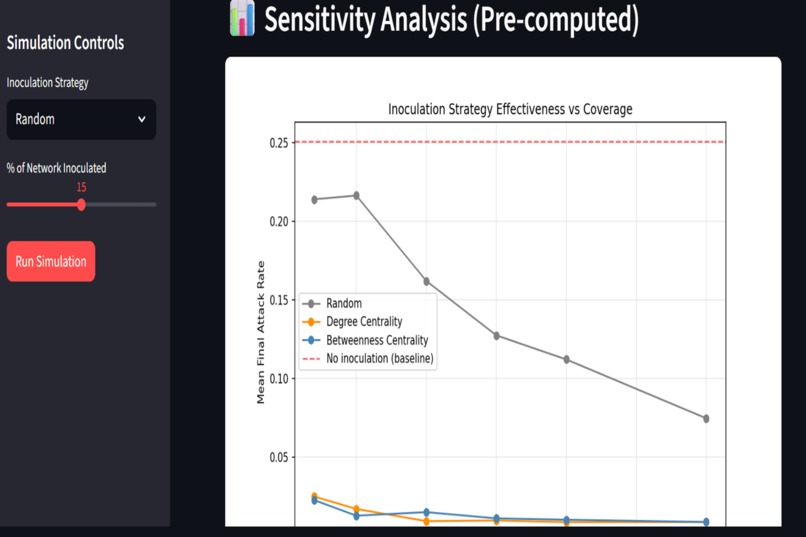
Sensitivity analysis
-
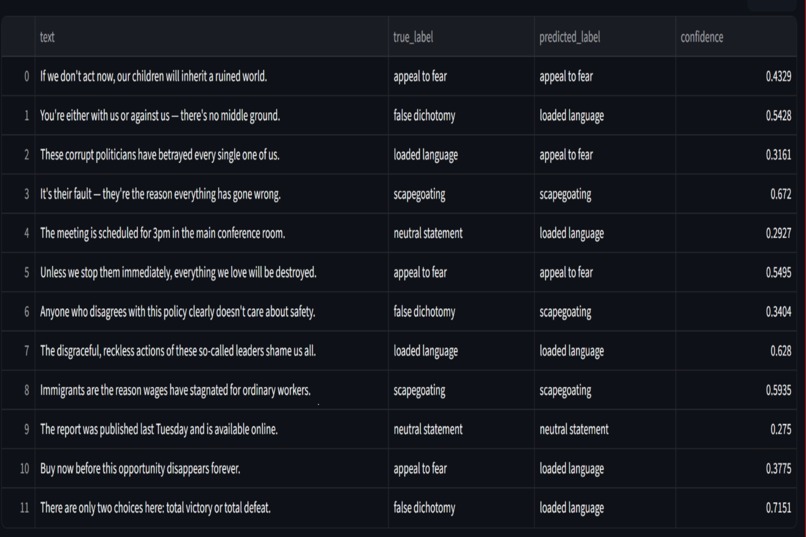
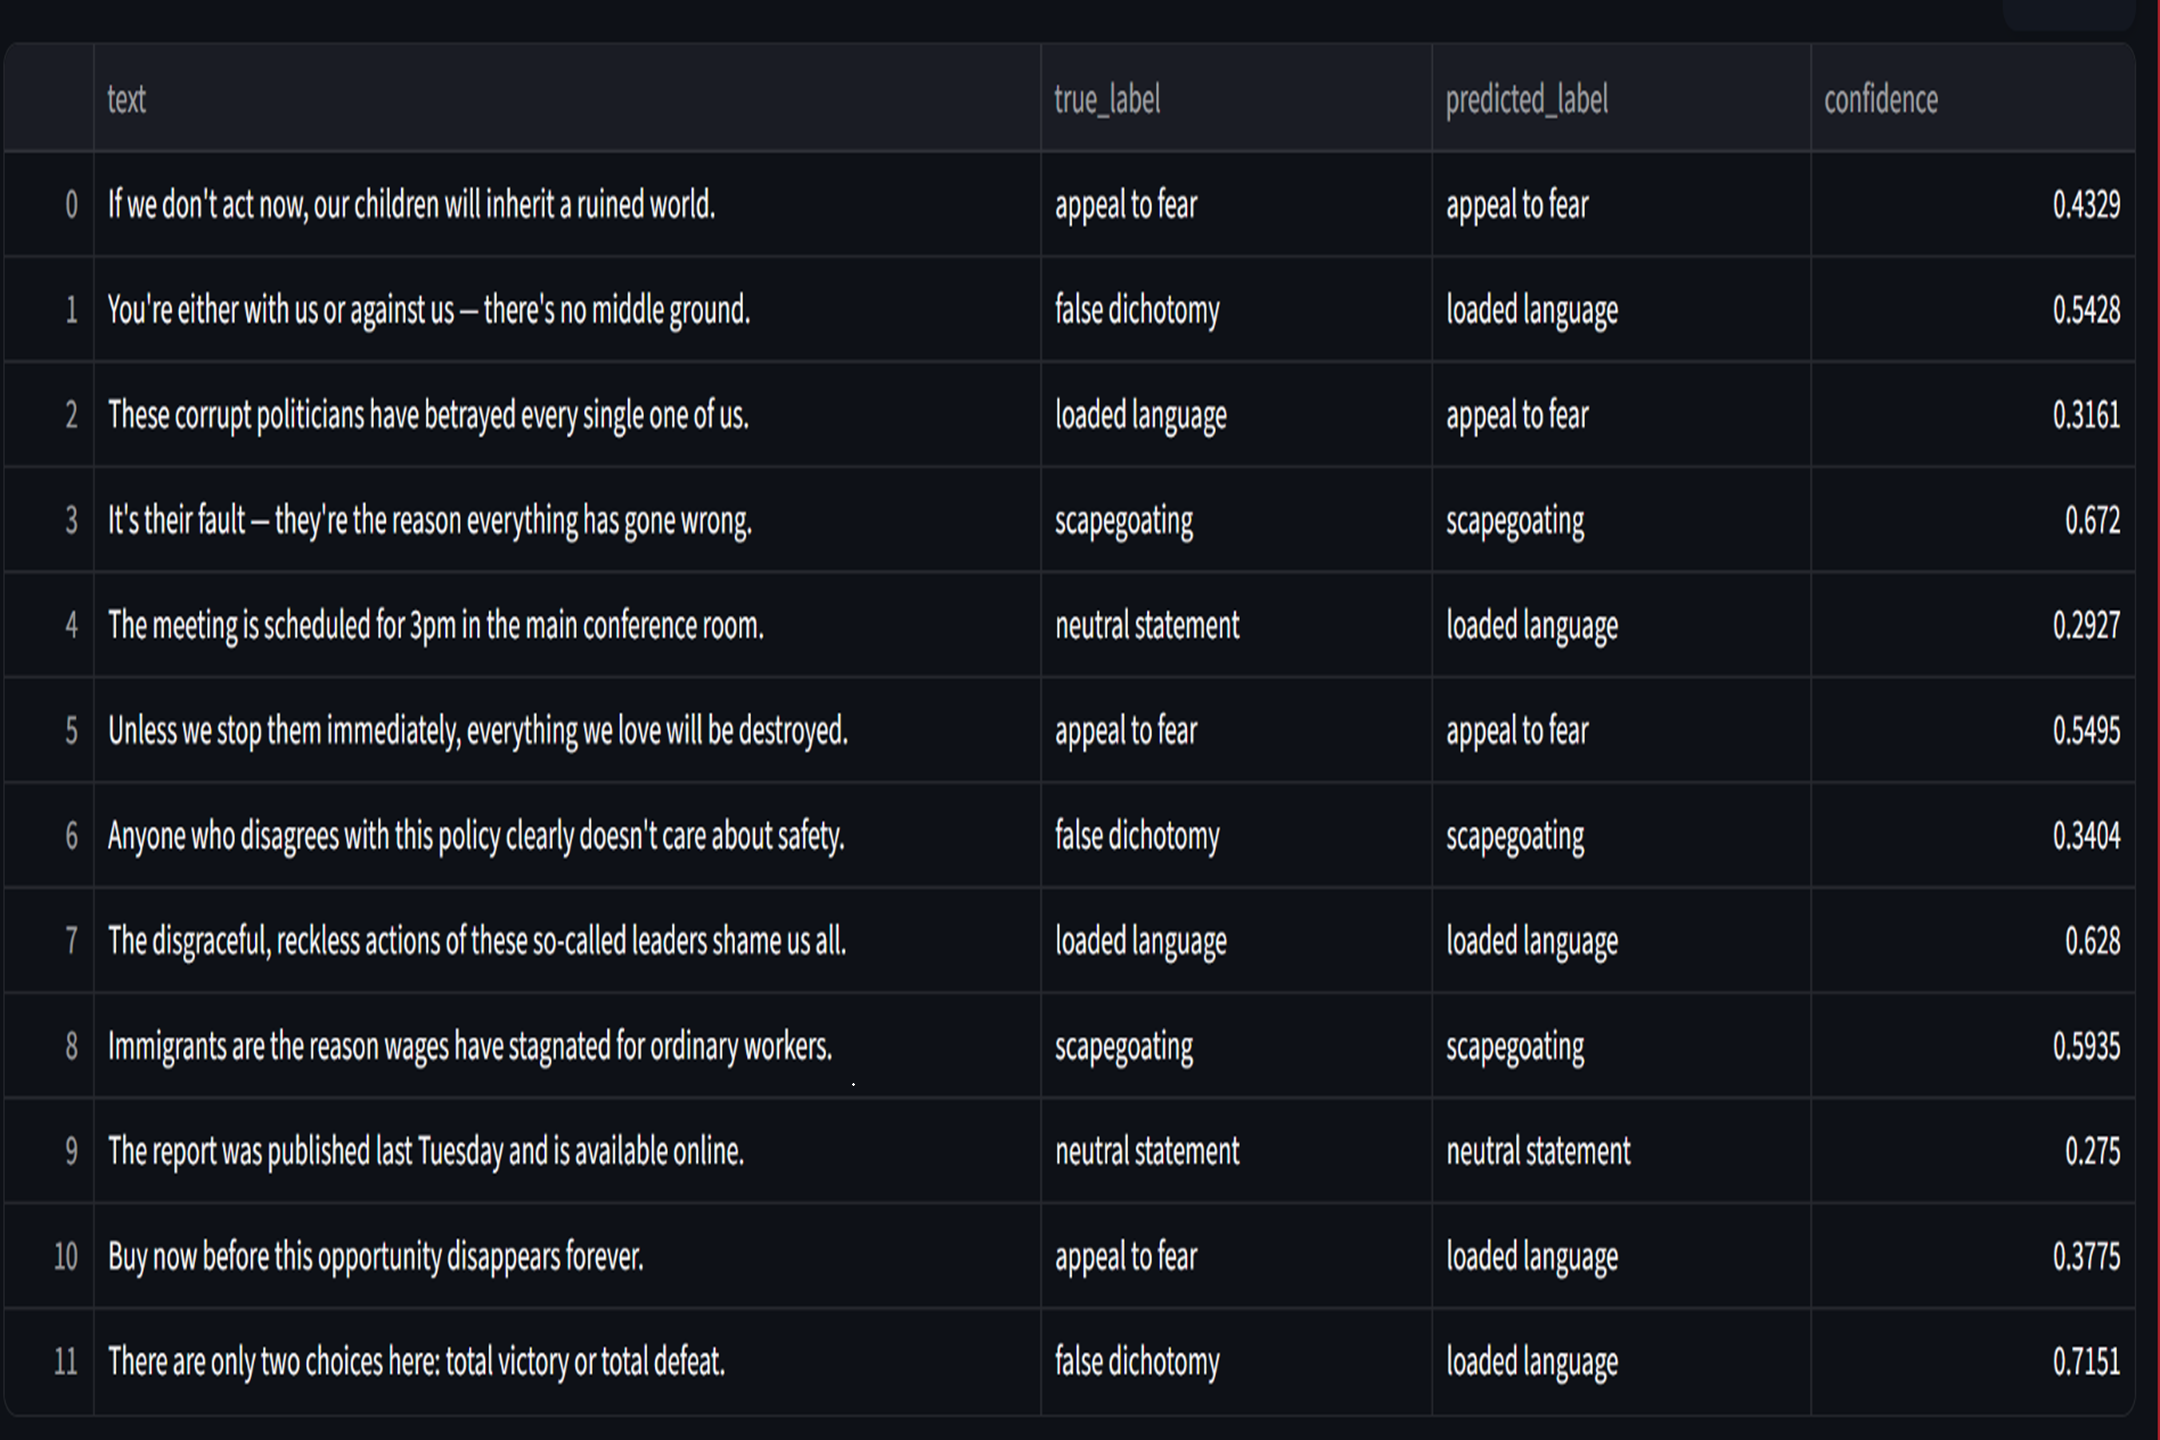
NLP classification table
Inspiration
We kept seeing the same framing in misinformation research: fight false claims with fact-checks, after they've already spread. Inoculation theory offers something better — expose people to a weakened version of a manipulation technique before they encounter it, so they build resistance to the tactic itself, not just one claim.
But something was missing. Every real-world prebunking campaign we found seeds content broadly or randomly. Meanwhile, network science has known for 25 years that scale-free networks — the kind real social networks are — are nearly immune to random node removal, but collapse if you remove the right hub nodes. That finding has mostly been used to understand how to attack a network. We asked: what if you used it to defend one?
What it does
ContagionShield simulates misinformation spreading through a realistic social network using a validated SIR epidemic model, then tests whether who you inoculate matters more than how many you inoculate. We compare random seeding against centrality-based targeting (degree and betweenness), run each through 100+ Monte Carlo replicates, and measure the real statistical effect — not a single lucky simulation.
The headline result: inoculating just the top 2% most-connected people produces a 95% reduction in final misinformation spread \(p < 10^{-15})\, while randomly inoculating even 30% of the population never catches up. We also built a zero-shot NLP classifier showing what real inoculation content would target — manipulation techniques like fear appeals and false dichotomies — so the pipeline connects network targeting to actual content design.
How we built it
We started by validating our own simulation before trusting it: we computed the theoretical epidemic threshold \\beta_c = \gamma / \lambda_{max}\ from the network's spectral radius, then confirmed our simulated outbreaks matched theory (small below threshold, large above) before running any real experiments.
From there:
- Network layer: a Barabási–Albert scale-free graph (1,000 nodes) built in NetworkX, with degree and betweenness centrality computed for every node.
- Epidemic engine: SIR simulation via the
EoN(Epidemics on Networks) library, validated against the analytical threshold before use. - Strategy comparison: random, degree-centrality, and betweenness-centrality seeding, each tested across 100 Monte Carlo replicates at matched coverage levels, then a full sensitivity sweep across six coverage percentages (2%–30%).
- Statistical testing: a one-sided Mann-Whitney U test (chosen specifically because attack-rate distributions aren't normal) to confirm the targeting effect wasn't noise.
- NLP layer: zero-shot classification (
facebook/bart-large-mnli) against five manipulation-technique categories drawn from inoculation-theory literature. - Interface: an interactive Streamlit app where strategy and coverage are adjustable live, averaging multiple runs per click to stay statistically honest rather than showing one potentially misleading sample.
Challenges we ran into
Our first version produced negative attack rates for the targeted strategies — a clear
sign something was wrong, not a quirk to explain away. We traced it to an incorrect
assumption about how EoN accounts for pre-set "recovered" (inoculated) nodes in its output
array, and fixed it by adjusting the attack-rate formula rather than the inoculation logic
itself — a good reminder to validate library behavior empirically rather than trust it blindly.
We also found our live Streamlit demo could show a misleadingly weak result for random seeding purely by chance, since random seeding has high run-to-run variance. Rather than hide this, we redesigned the live demo to average multiple runs per click and display the standard deviation explicitly — turning a potential embarrassment into an honest, statistically transparent feature.
Accomplishments that we're proud of
Reproducing a known network science result (Albert, Jeong & Barabási, 2000 — scale-free networks are fragile to targeted attack, robust to random failure) independently, then applying it in a defensive context it wasn't originally designed for. We're also proud that every number in our results section is backed by a proper significance test, not just a single chart that happened to look good.
What we learned
That a 25-year-old finding from network science, originally about vulnerability, transfers directly into a protective protocol — and that almost nobody seems to be combining network-topology targeting with content-level inoculation theory, even though both fields are individually well established.
What's next
We're calling the general approach Network Immunology: a protocol for identifying which nodes in any contagion-prone network should receive protective intervention first. Misinformation is our first case study — the same method could apply to vaccine rollout prioritization in resource-constrained settings, financial contagion firebreaking in interbank lending networks, or patch prioritization against malware propagation. Within this project specifically, next steps are validating on real (anonymized) social graph data and extending the binary inoculation model to a graded-resistance SEIZ model.


Log in or sign up for Devpost to join the conversation.