-
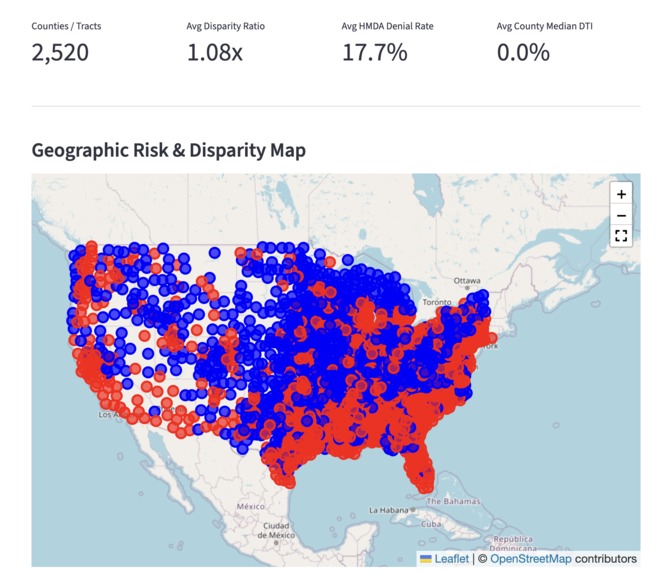
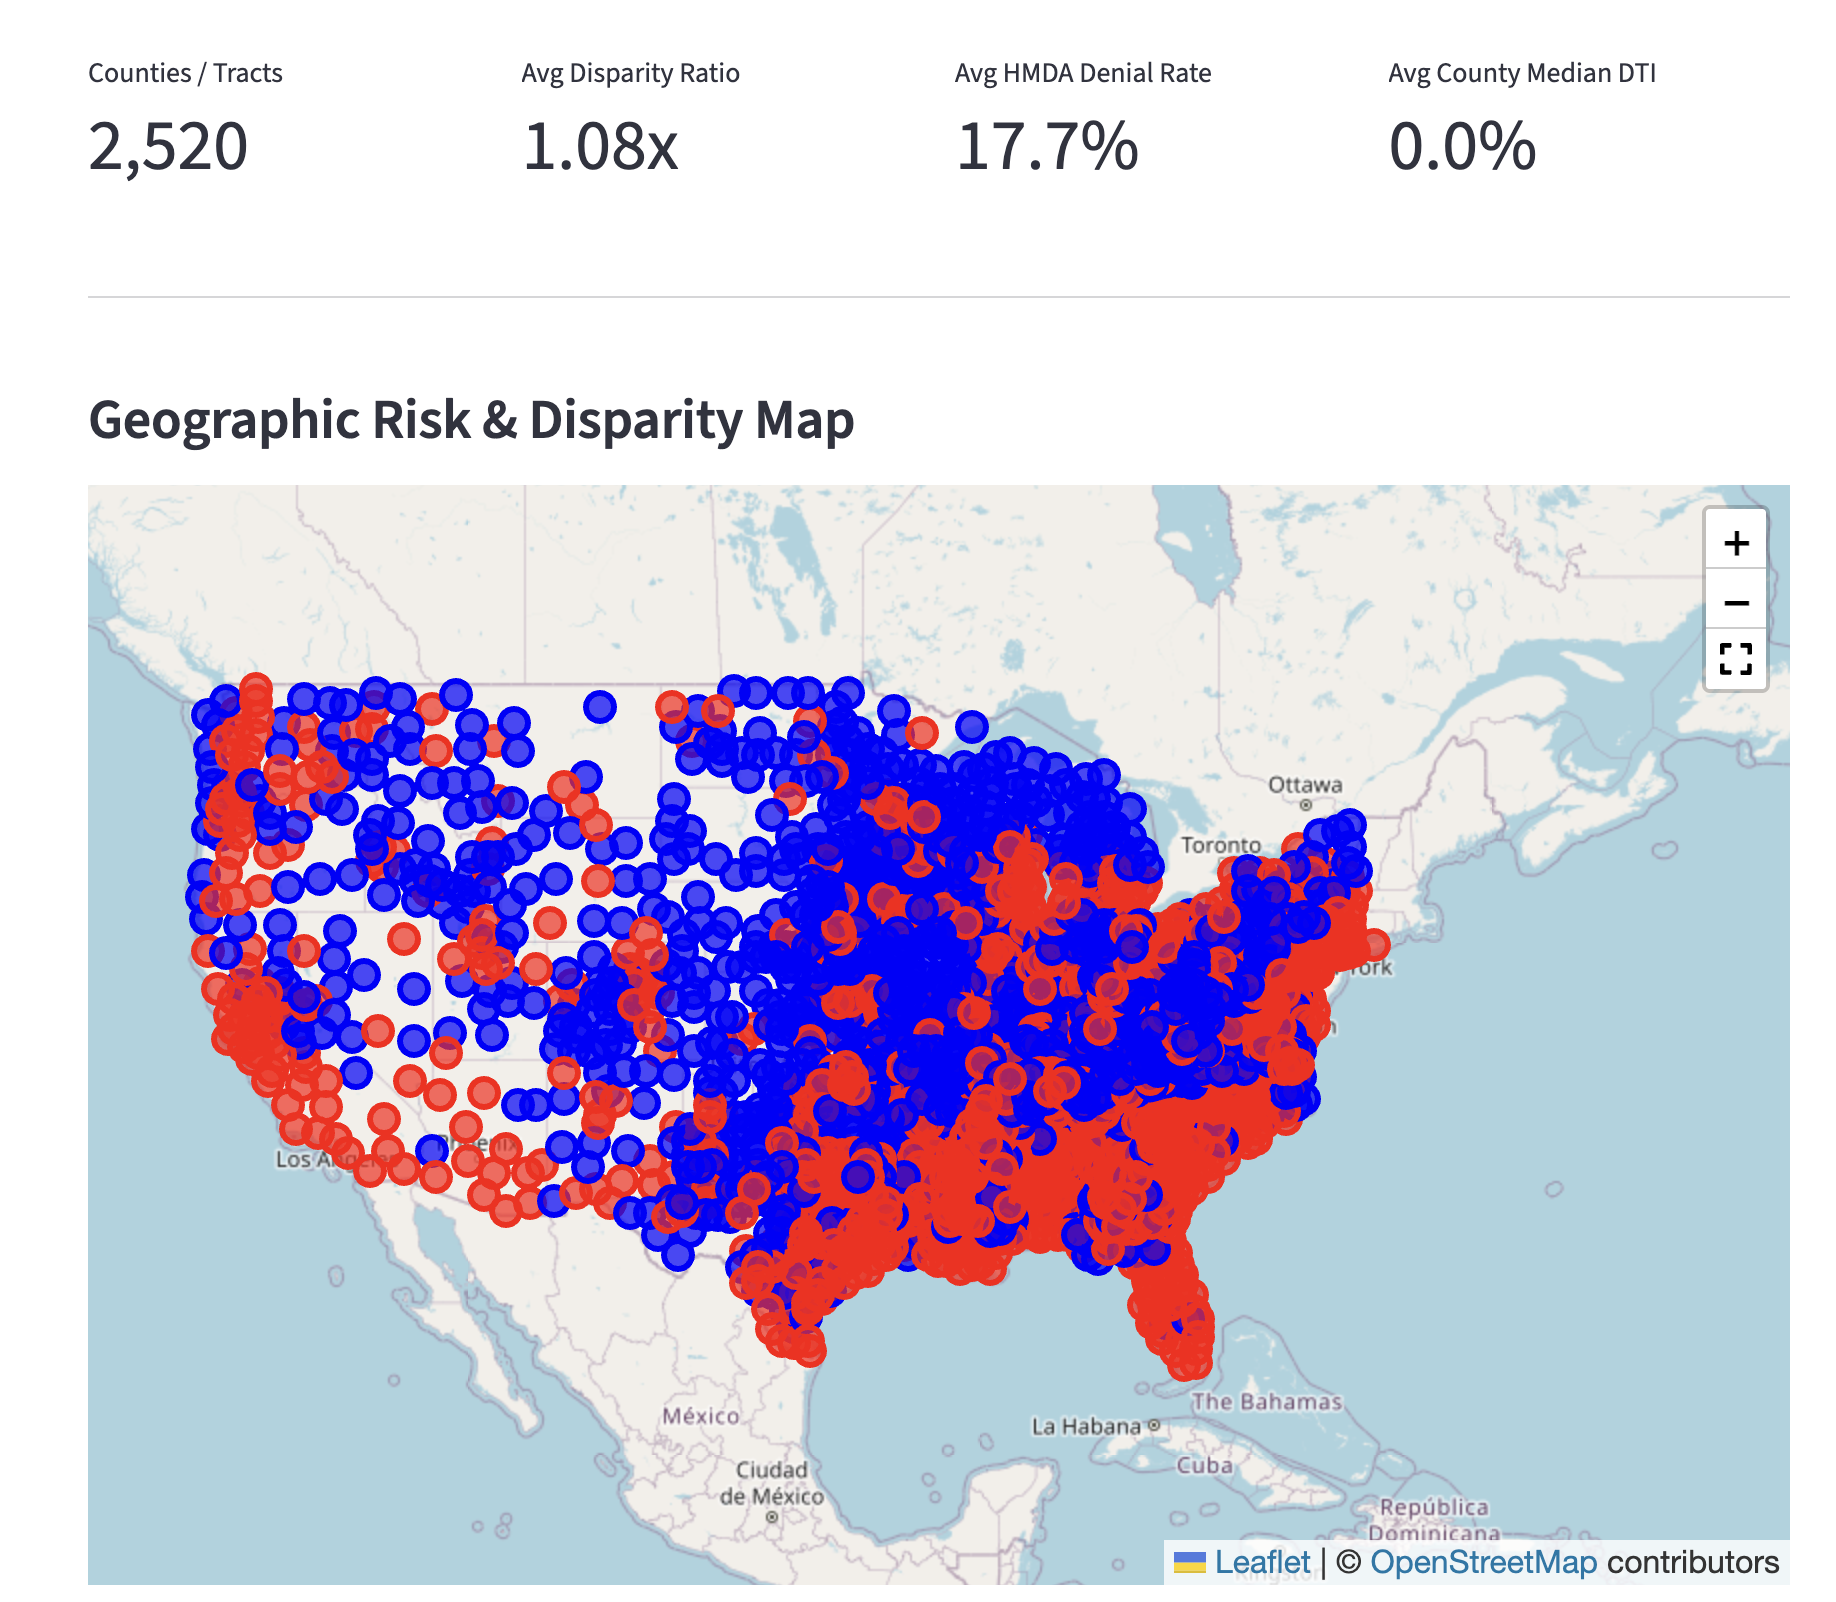
Homepage showing CFPB Complaint Volume map
-
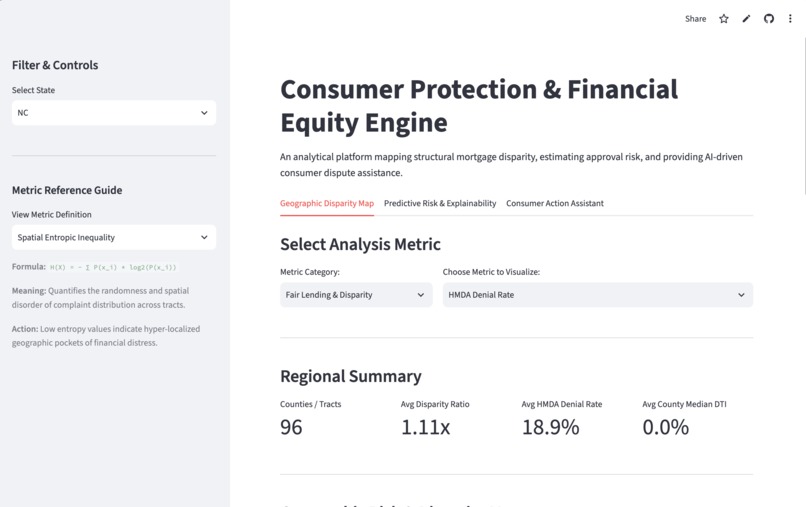
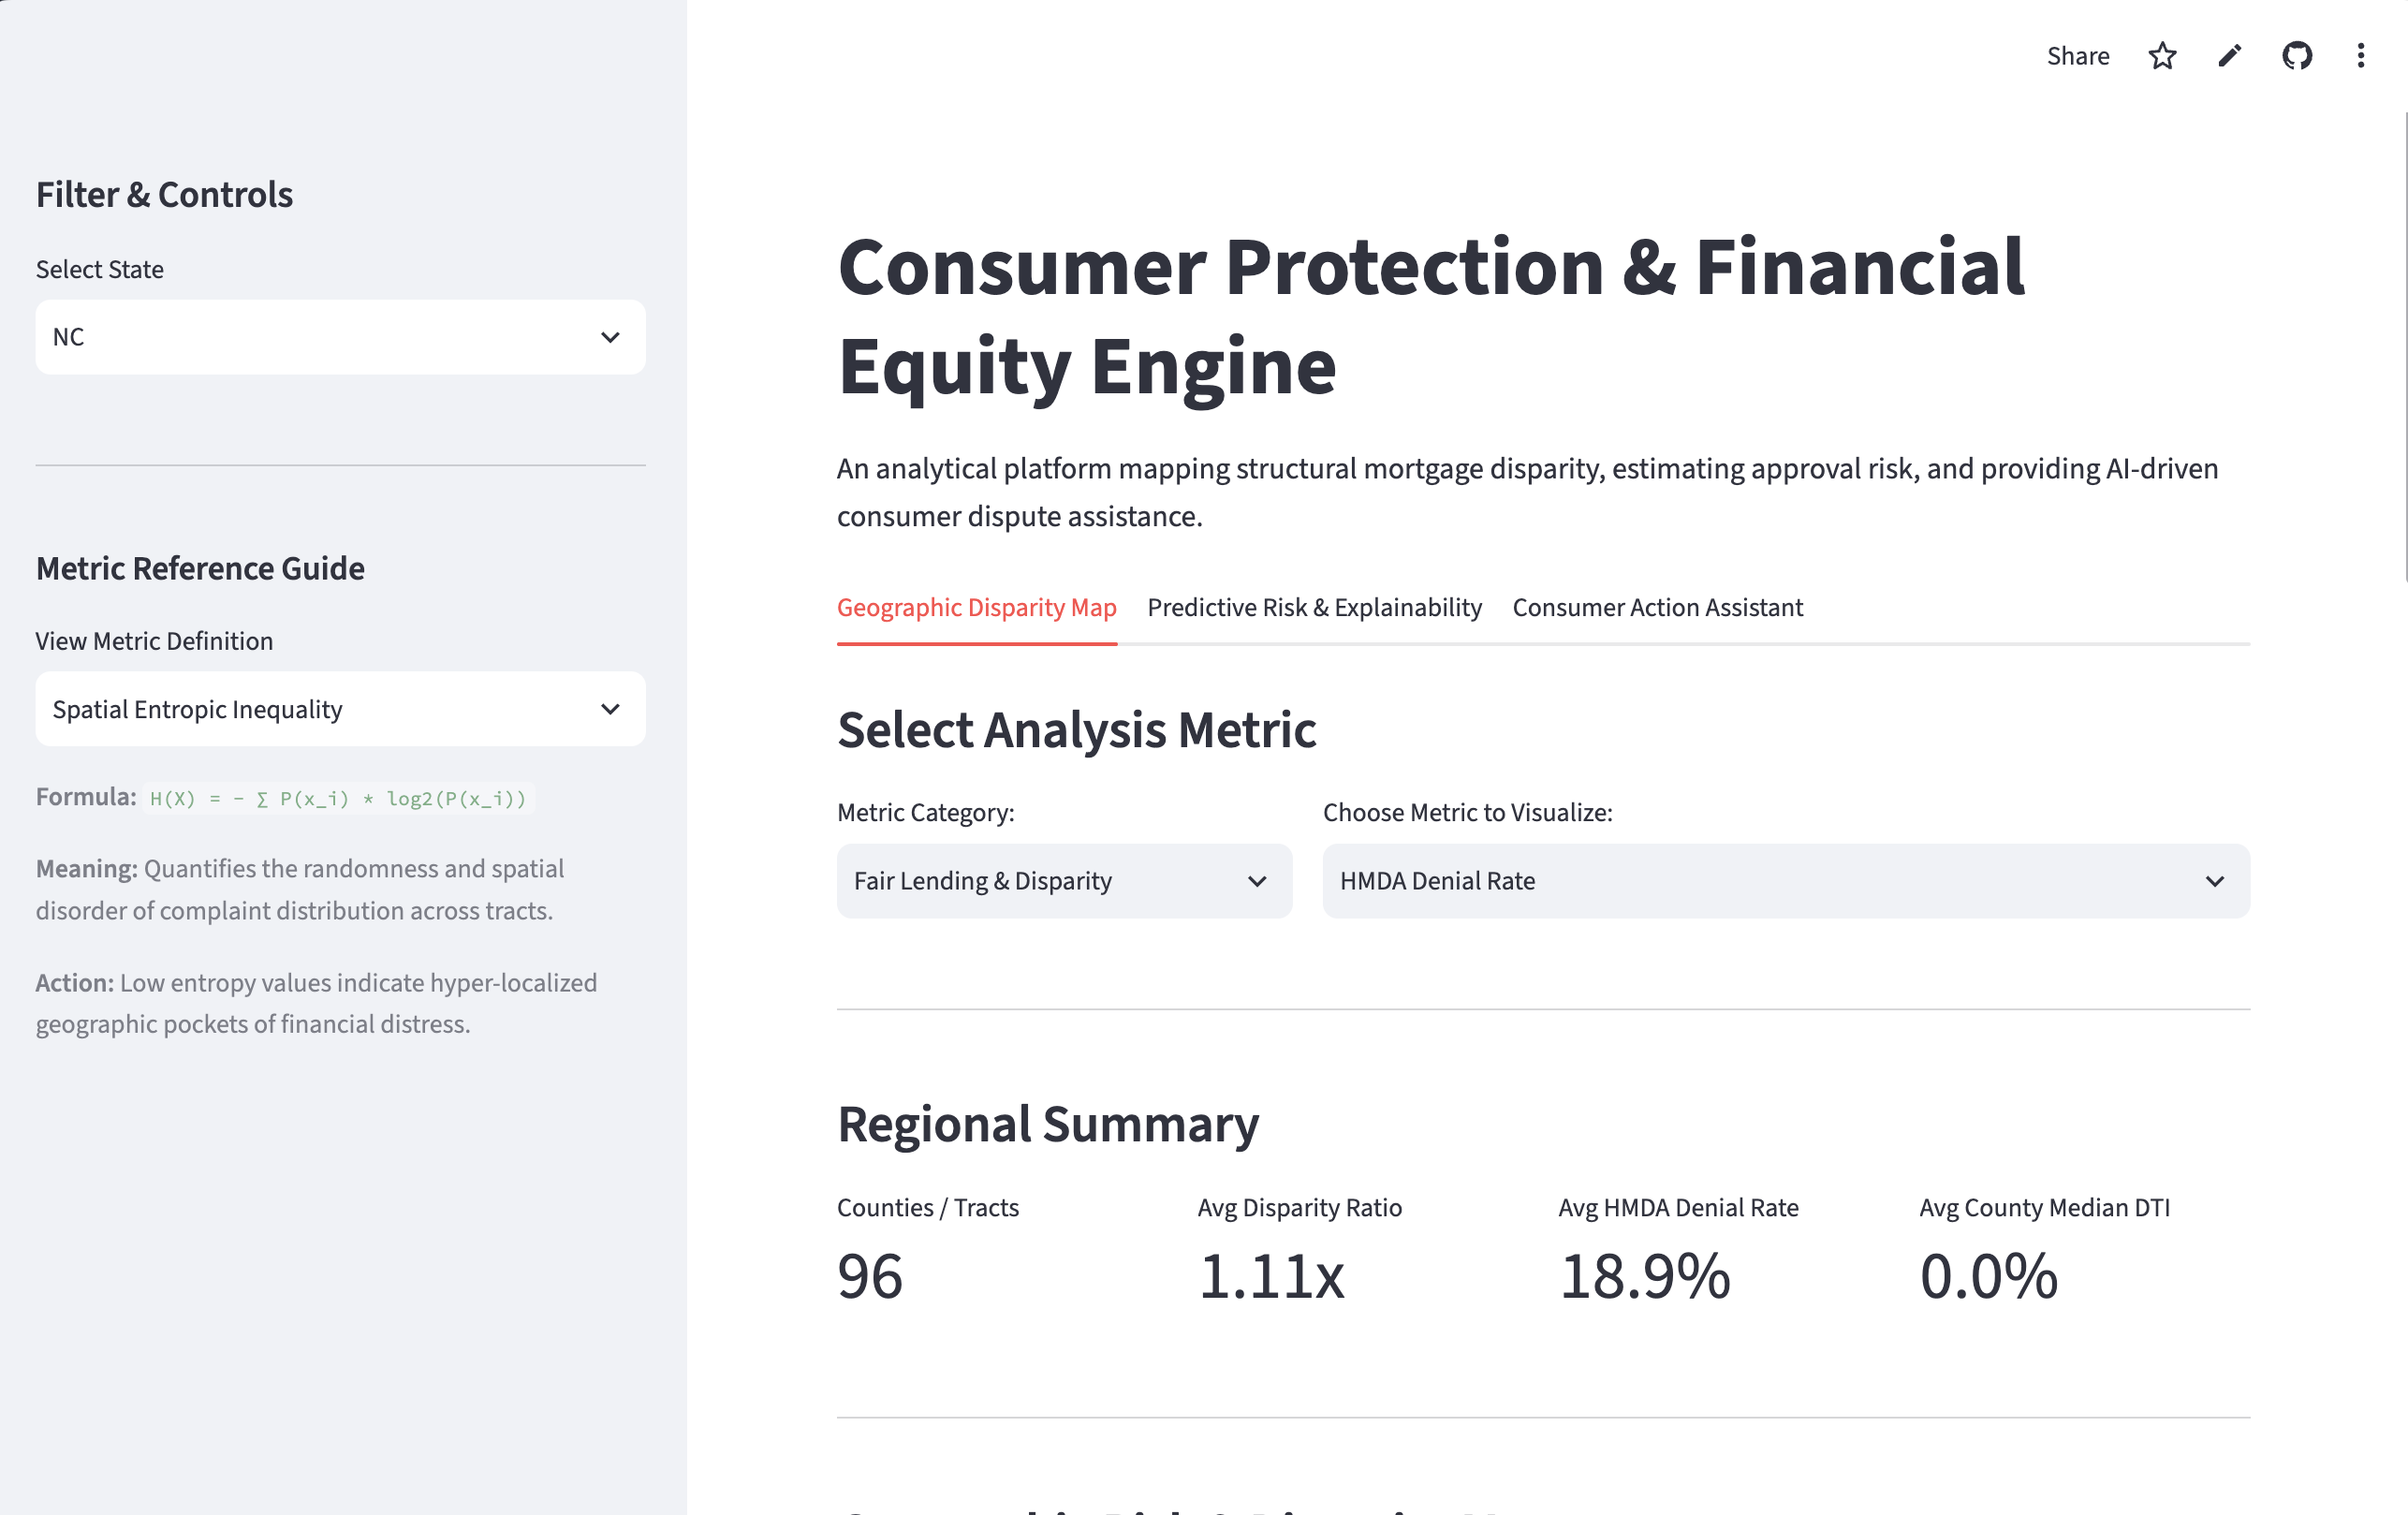
Homepage with data tabs, analysis metrics, filters, and regional summary
-
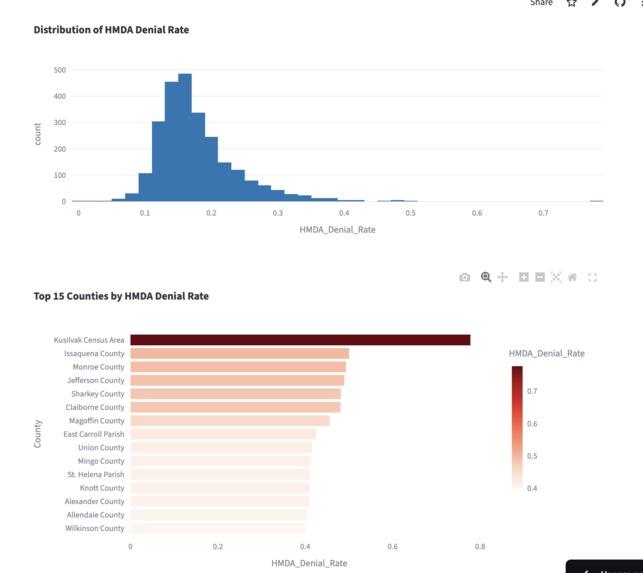
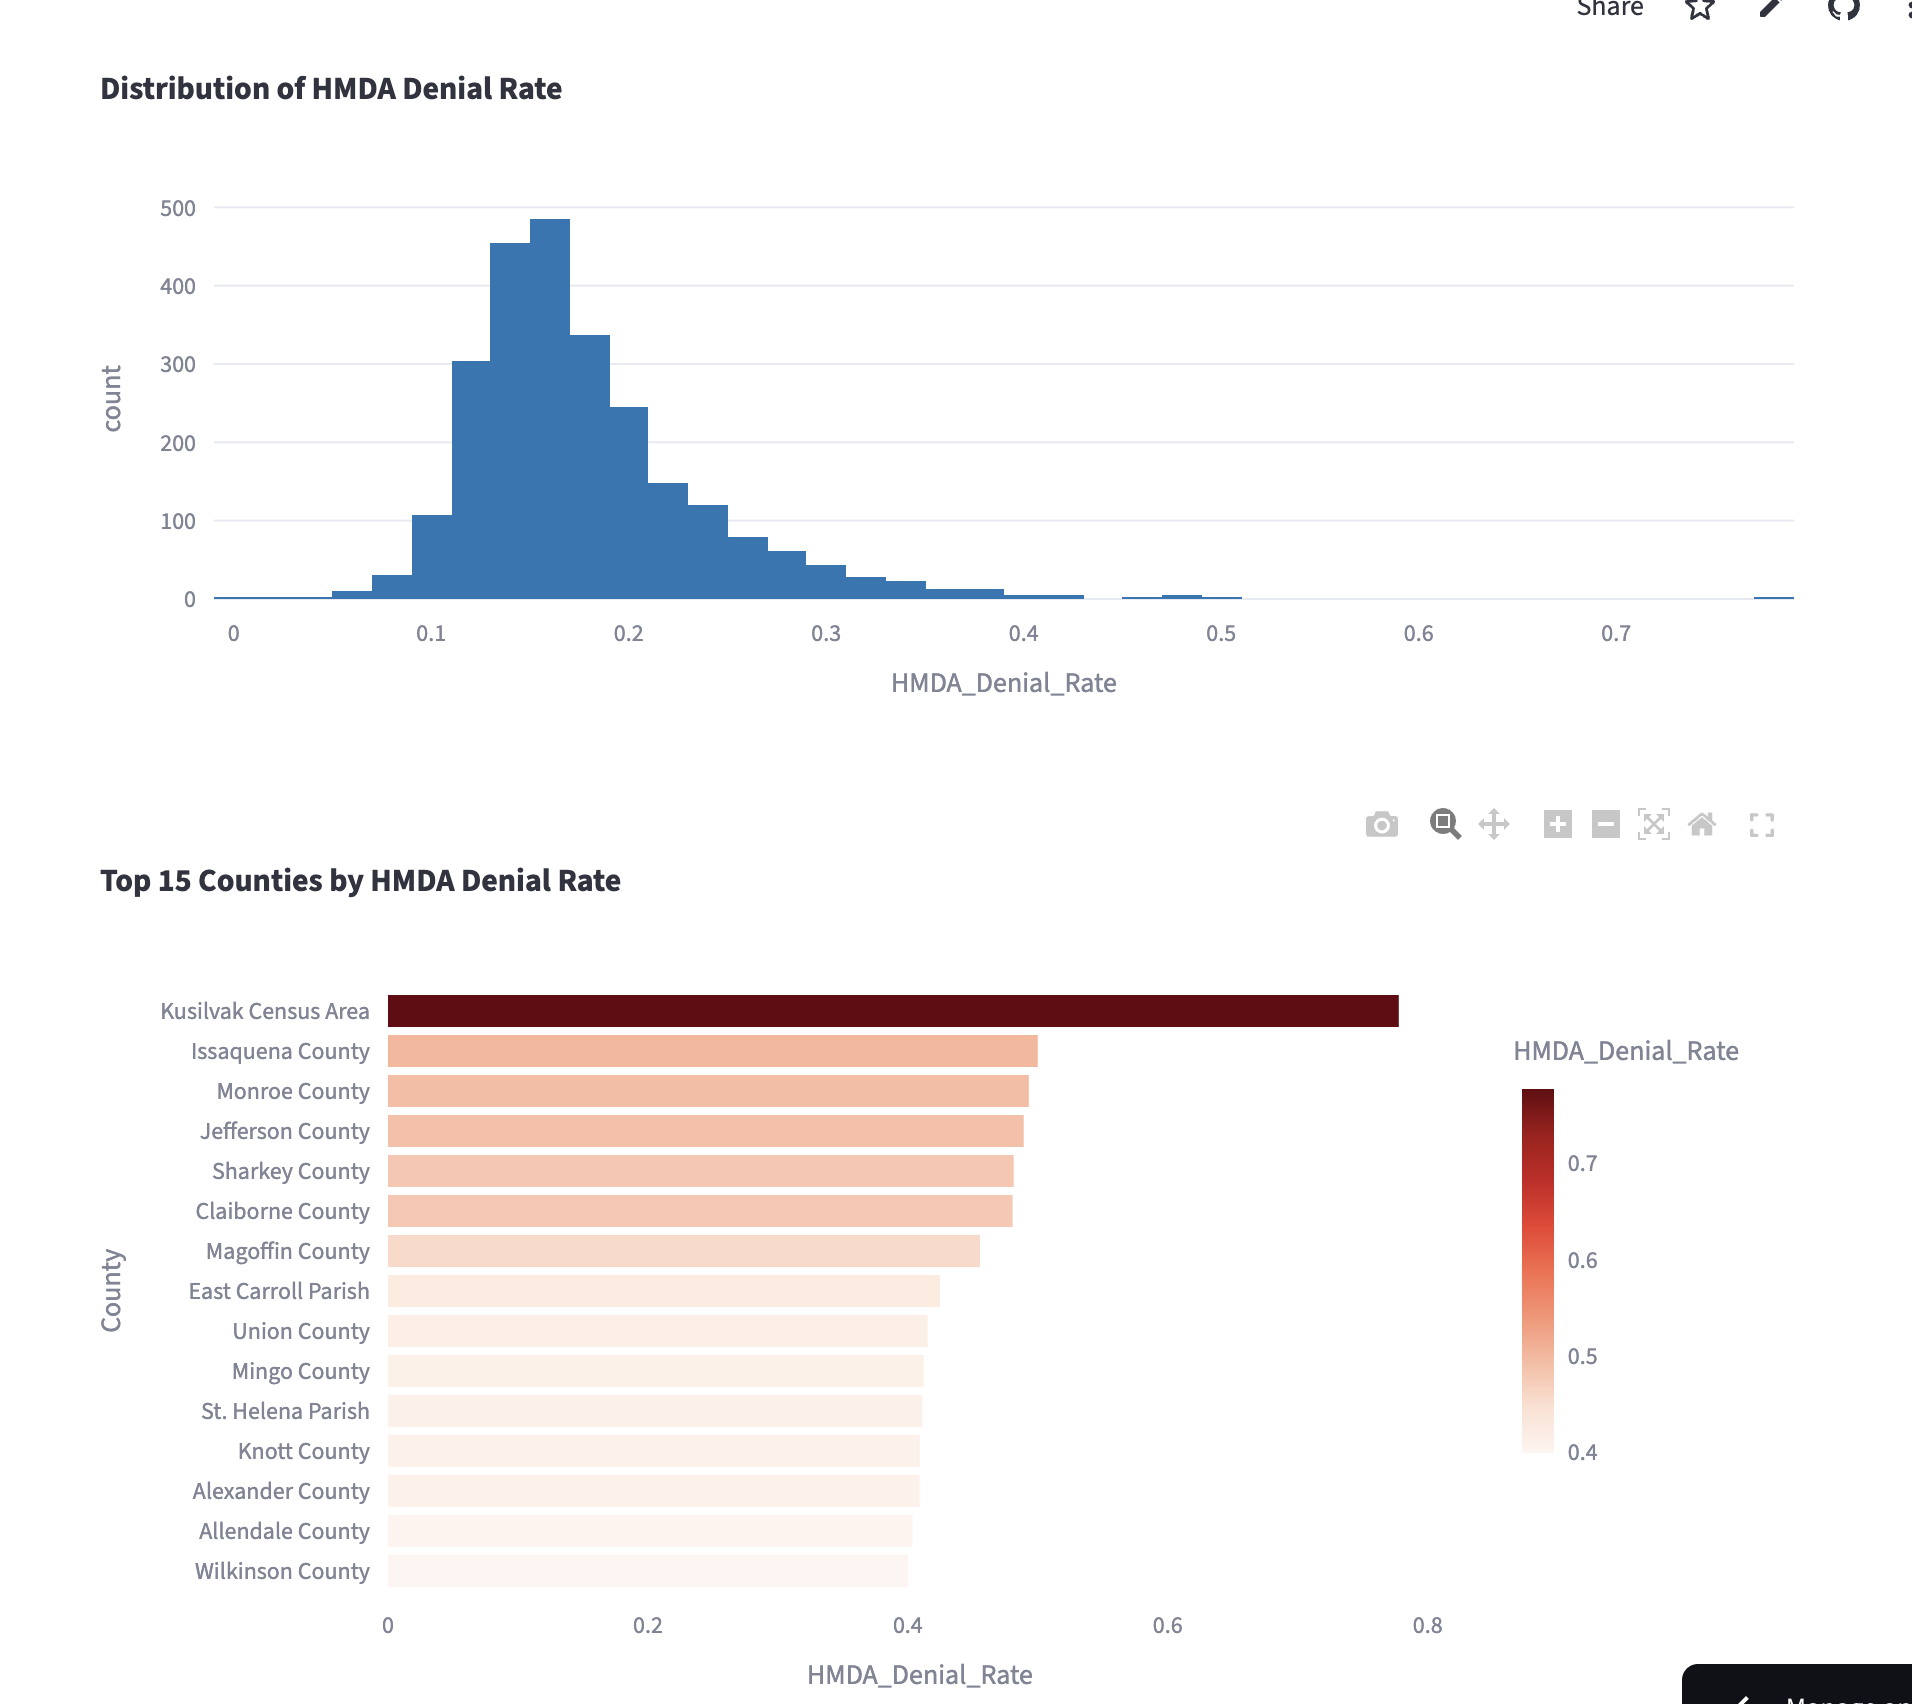
HMDA Denial rate analysis
-
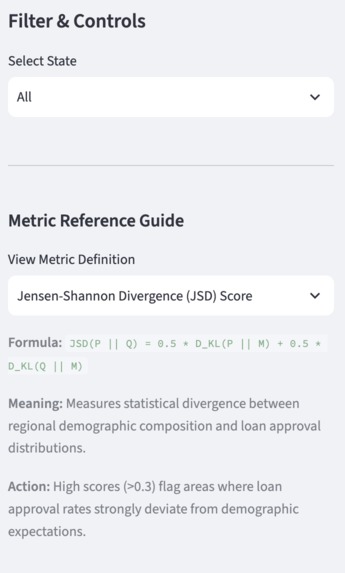
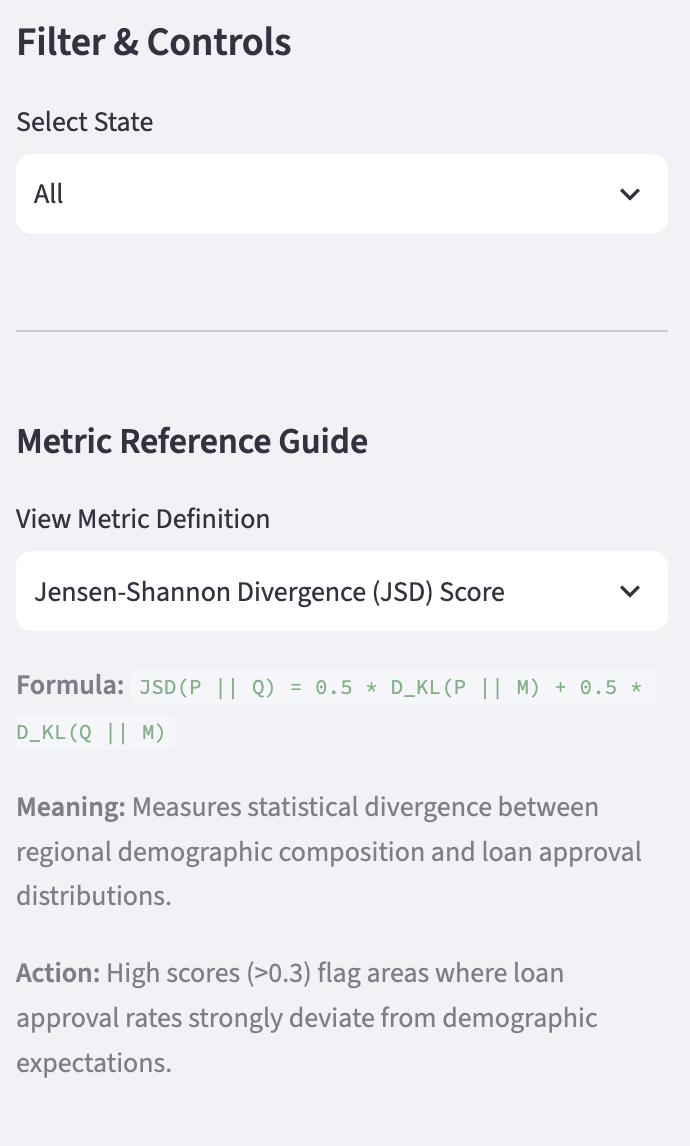
Sidebar with State filter and metric reference guide
-
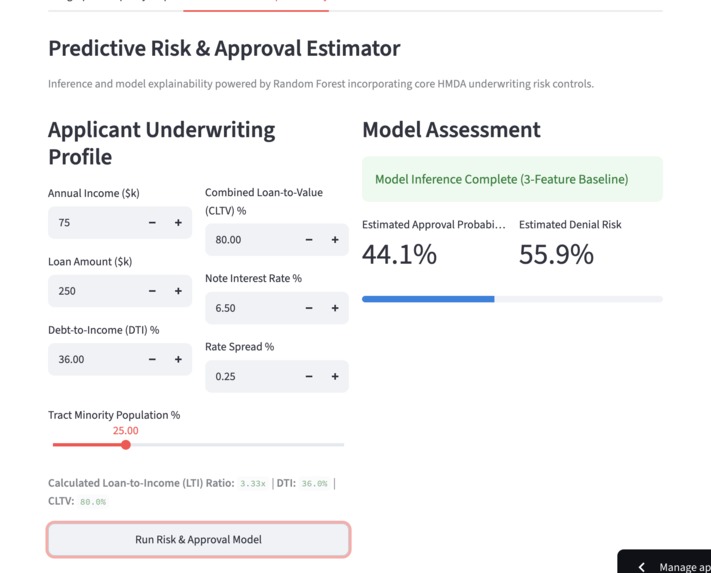
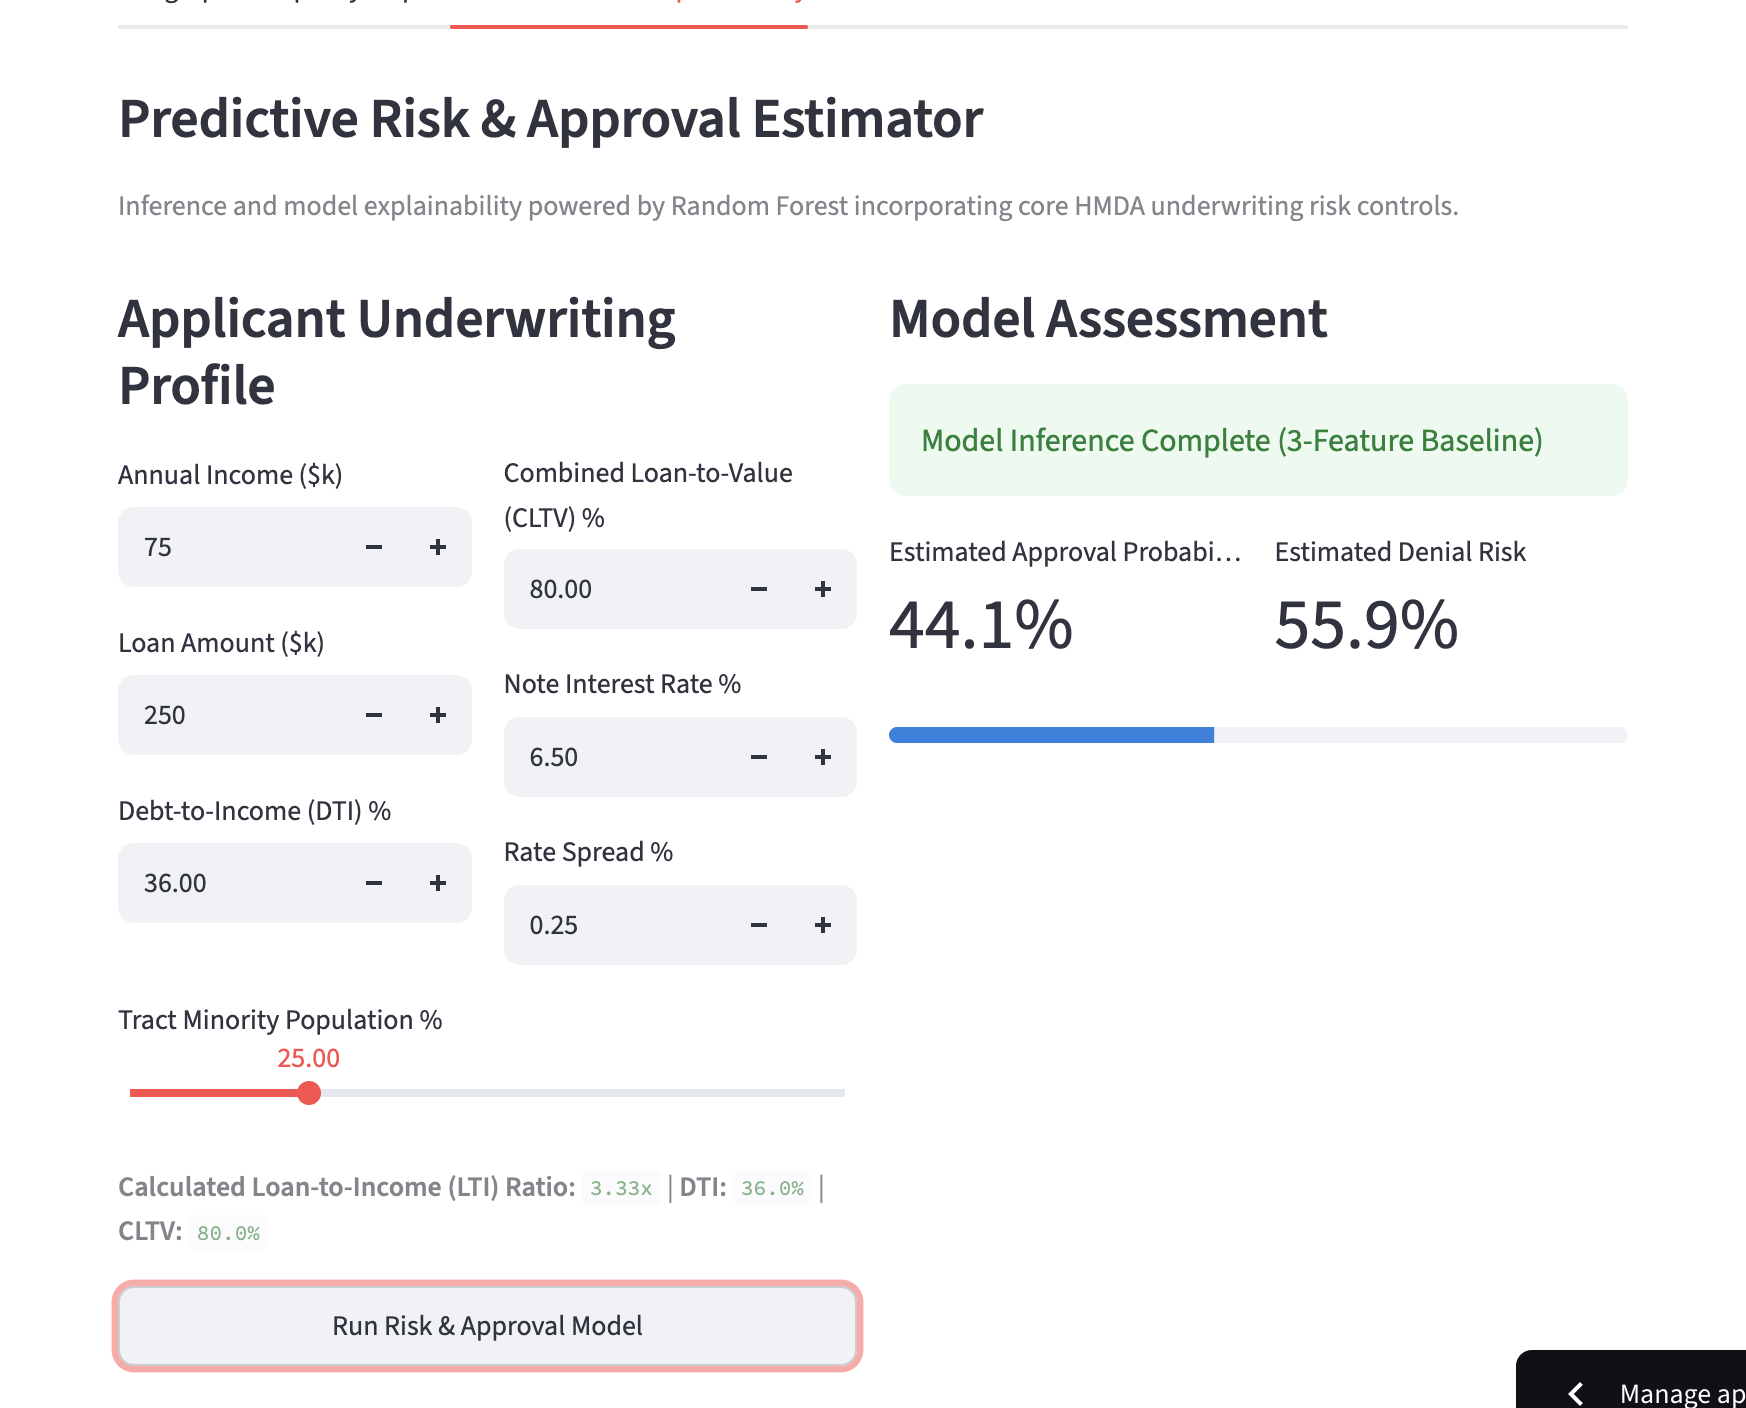
Random Forest predictive model tab
-
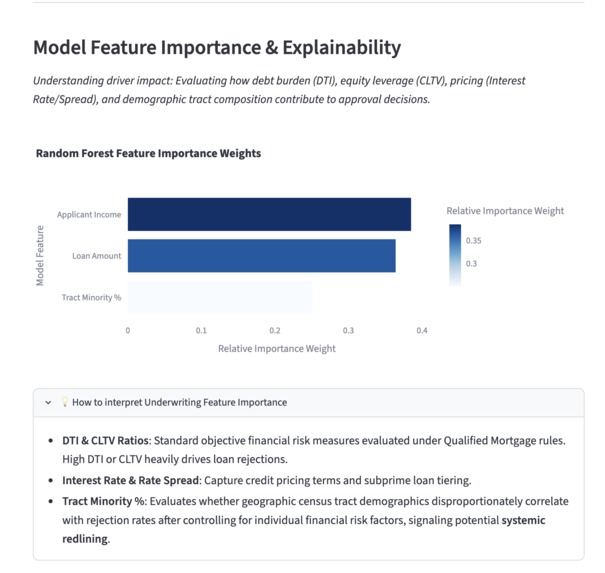
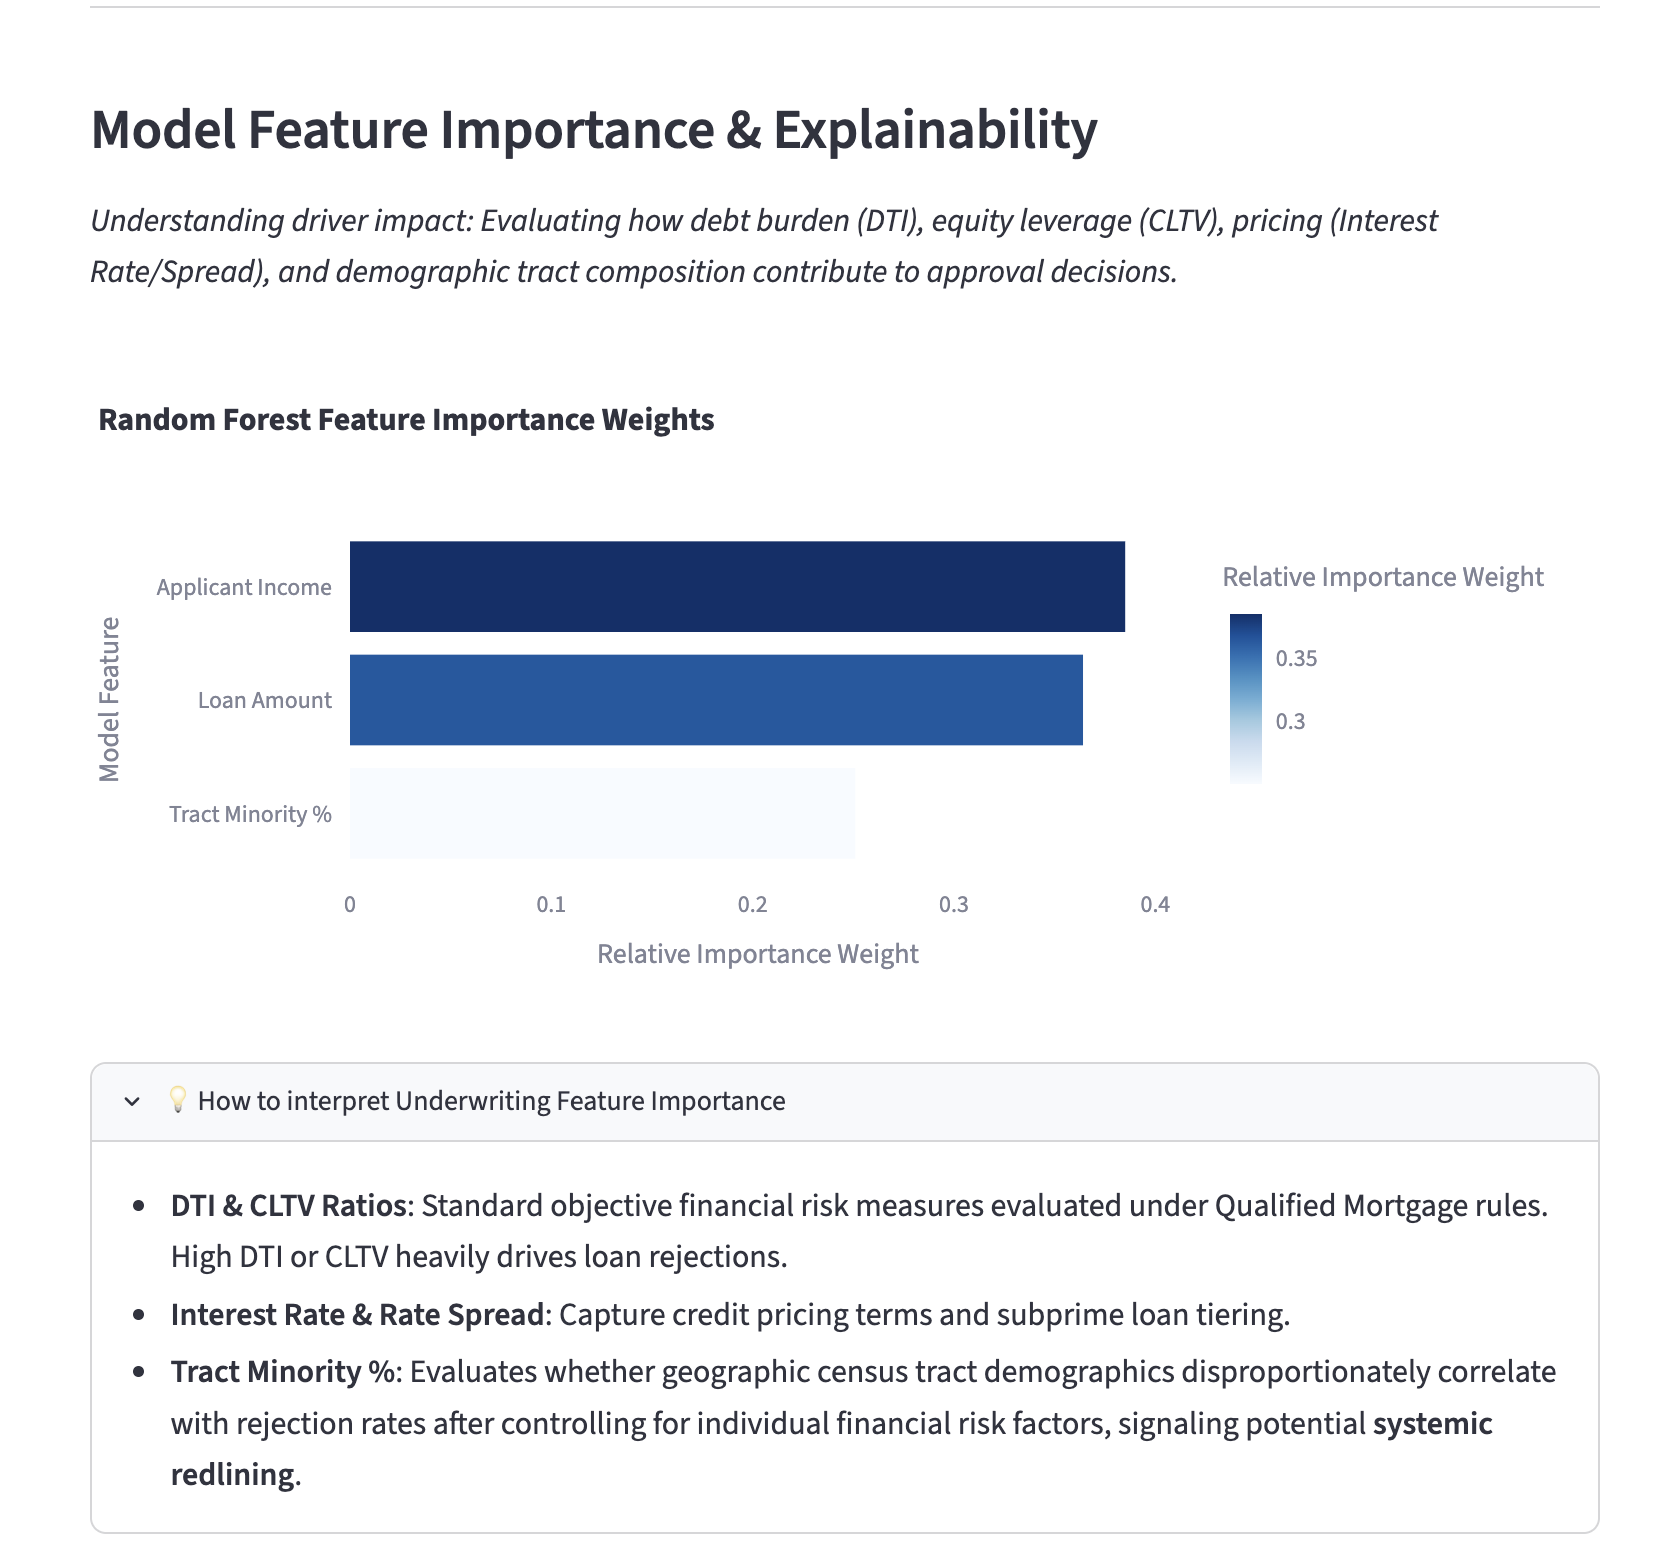
Model feature importance and explanation
-
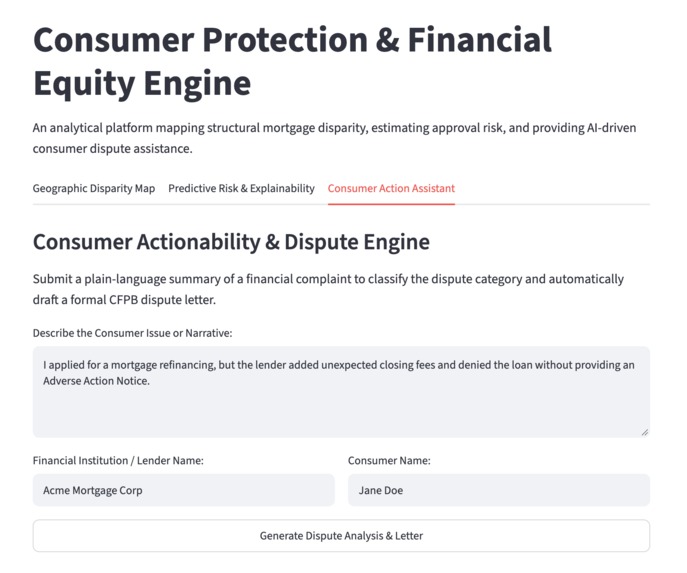
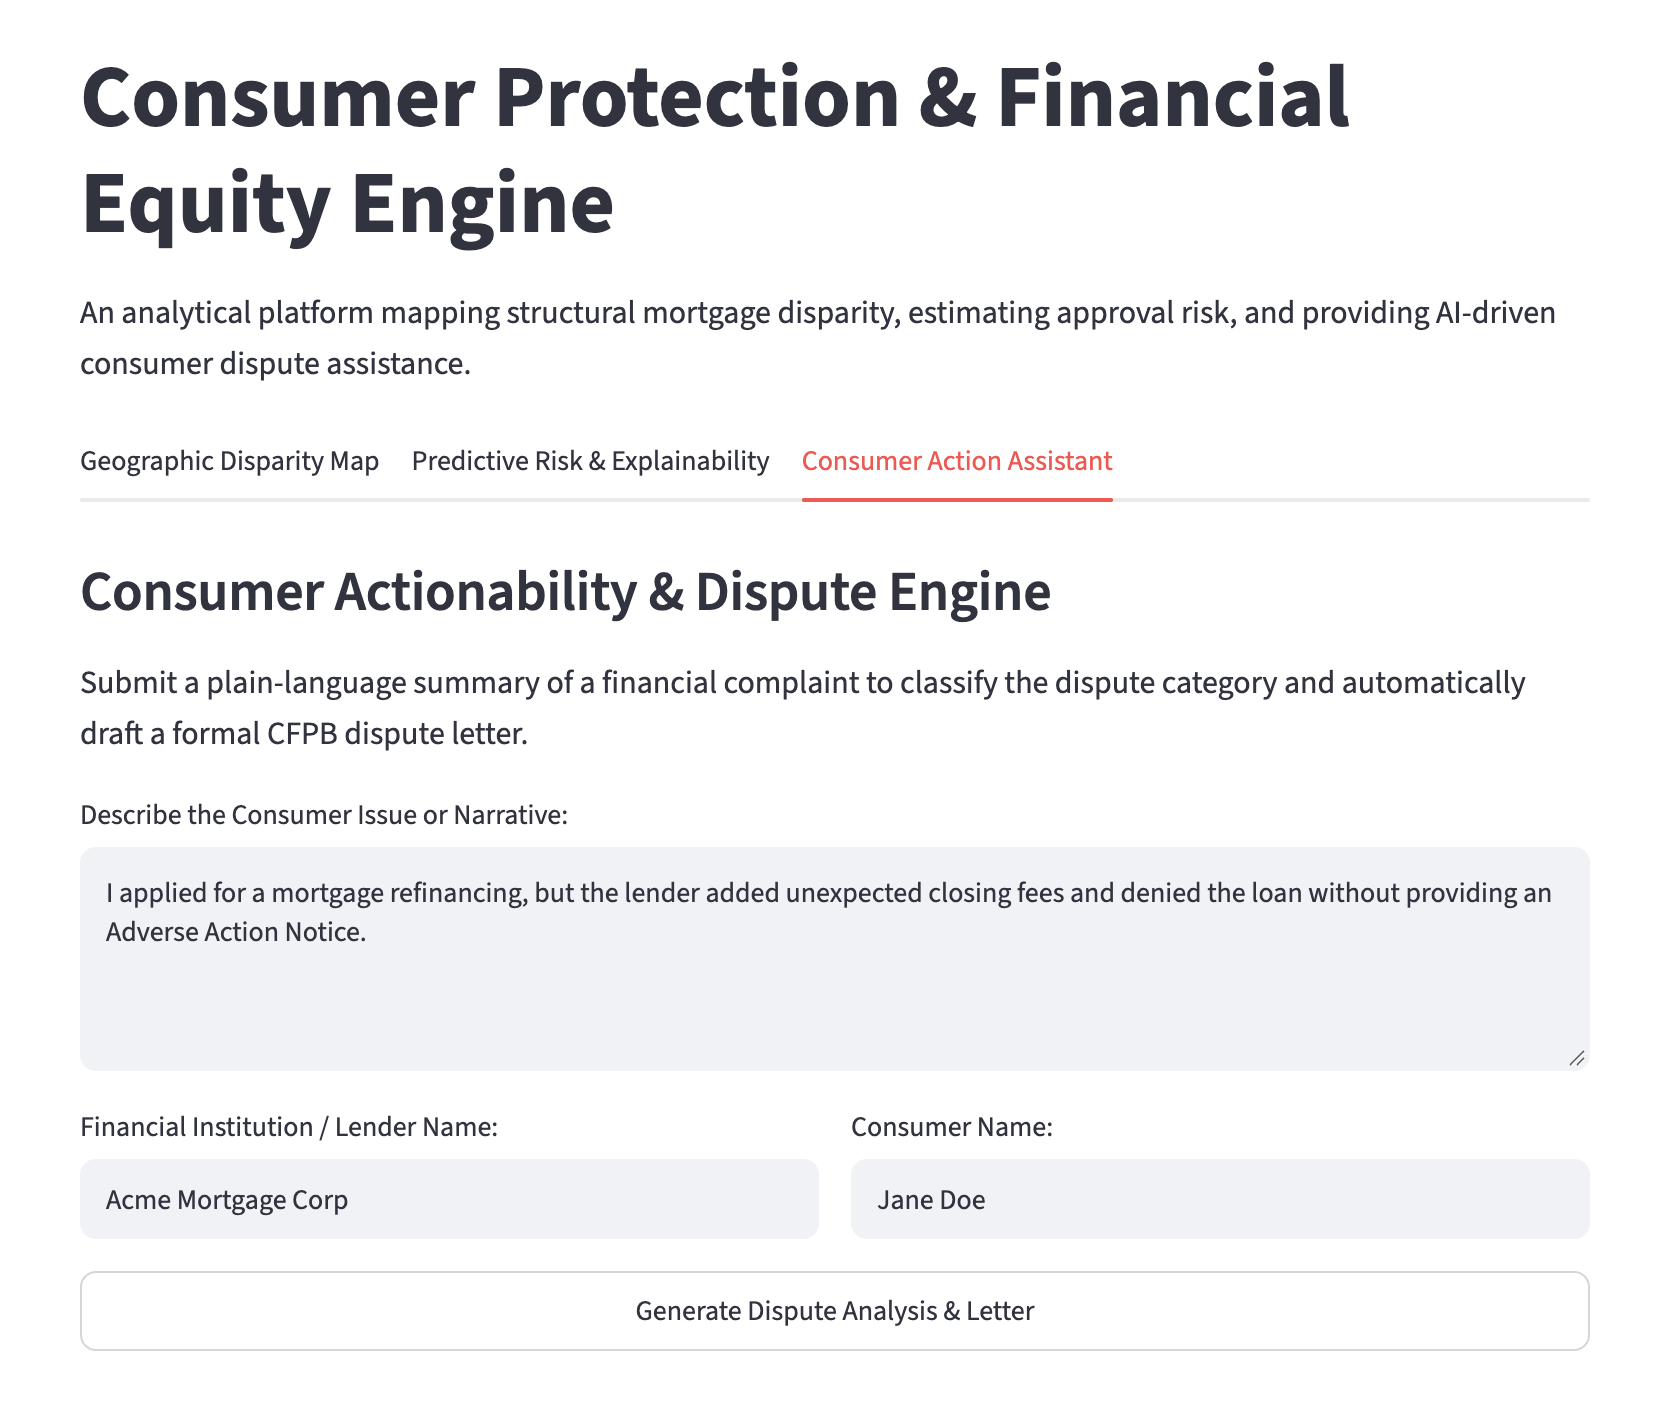
Formal dispute letter generator
-
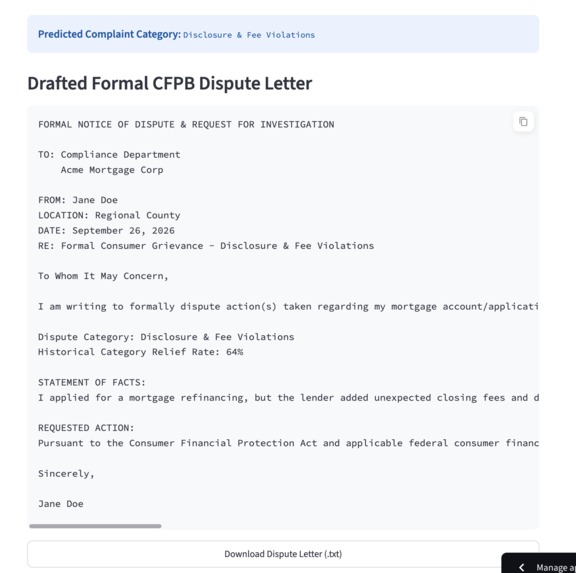
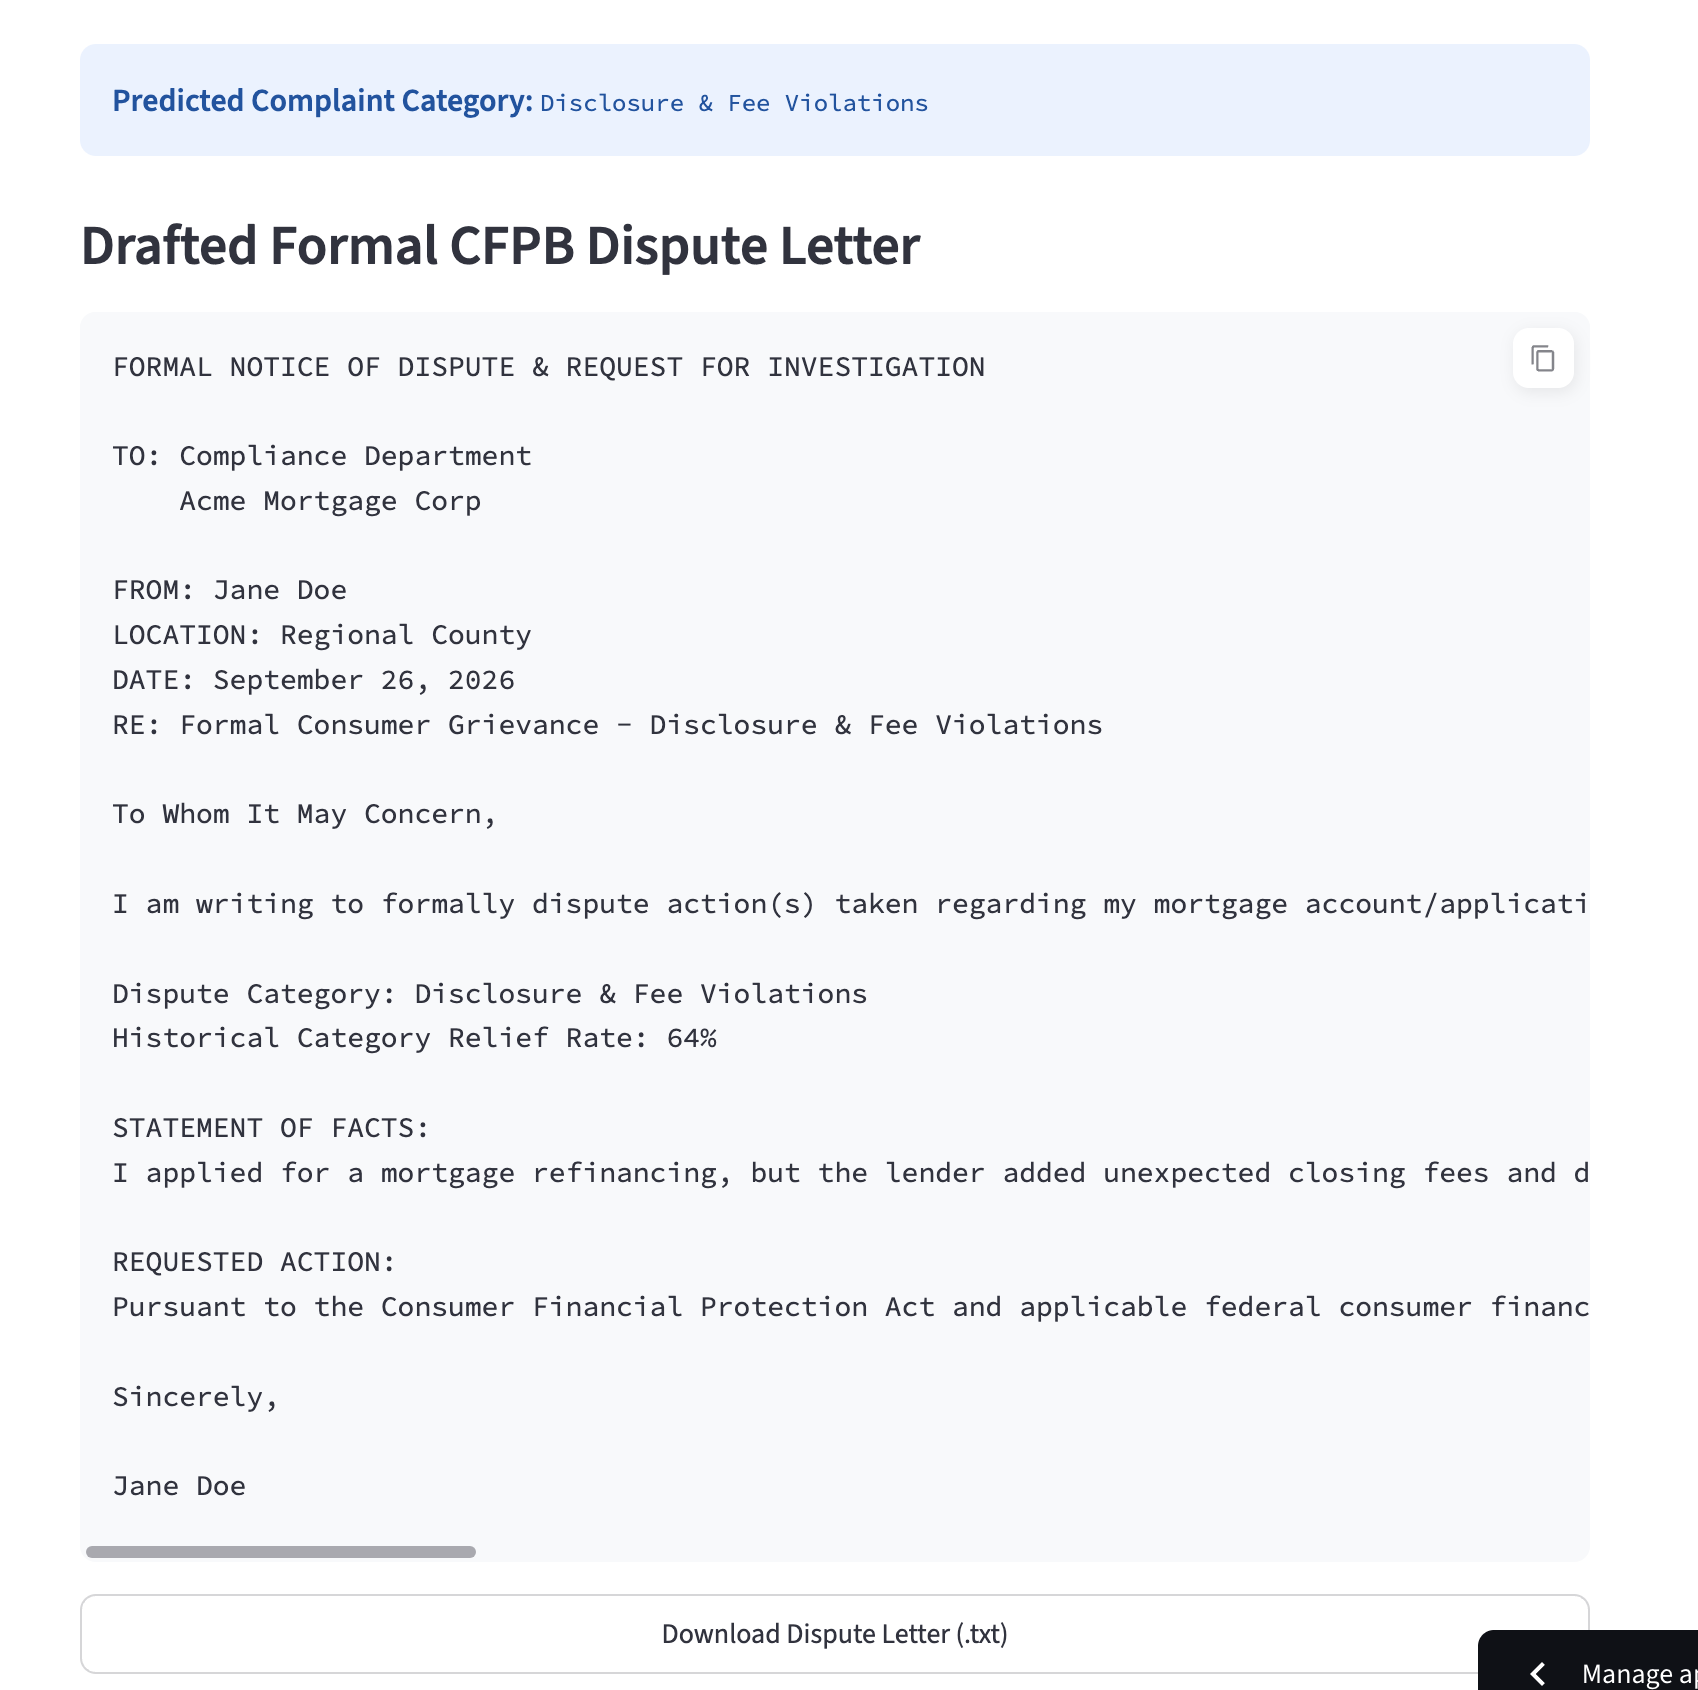
Generated formal dispute letter
Inspiration
We were motivated by the complaint patterns in the CFPB database to make something that provides useful and interactive insight to concerned consumers, analysts, and legislators beyond what traditional financial statistics tell us about lending. We wanted to highlight the disparities in customer representation through these financial products at a more granular level.
What it does
Our application provides an interactive geographic map that highlights several key metrics regarding consumer complaints and financial information at the tract/county level: disparity ratio, HMDA denial rate, JSD Divergence, media DTI, CLTV, applicant income, loan amount, mean interest rate, rate spread, and CFPB complaint volume. It trains a Random Forest model to predict risk and approval for a lender given certain features. It also provides a built-in generator to write financial complaints.
How we built it
We used Python and Excel to process the data. Our application is hosted with streamlit and uses folium + OpenStreetMap to display county/tract level geographic datapoints. The ML model for predicting disparity given the data uses a scipy Random Forest model. Datapoints like JSD and spatial entropy were calculated using scipy's built-in functions. Gemini was used to generate code and debug.
Challenges we ran into
The biggest challenge we ran into was processing large datasets using xlookup, creating a hardware bottleneck that forced us to switch to Python.
Accomplishments that we're proud of
We think that the data visualized is significantly insightful for providing a glimpse of some of the large-scale yet unnoticed financial problems across the US. We think that this tool could help underserved citizens get the representation that they deserve, by bringing attention to potential predatory lending practices and racial disparities dependent on geographic location (e.g. Wells-Fargo's predatory lending scandal).
What we learned
We learned how macro and micro economic lenses play a large role in understanding financial data across the US. We also learned how redlining, disenfranchisement, and predatory practices continue to exist "under the radar". We also learned how current and widespread these issues are despite decades of combating systemic equality.
What's next for Consumer Protection & Financial Equity Engine
Implementing real-time data fetching from government databases via API so information can stay up to date. Also implementing Laplace smoothing to address zero-probability problem.

Log in or sign up for Devpost to join the conversation.