
ConstructWatt — Project Proposal
Turning half-built renewable assets into usable construction power.
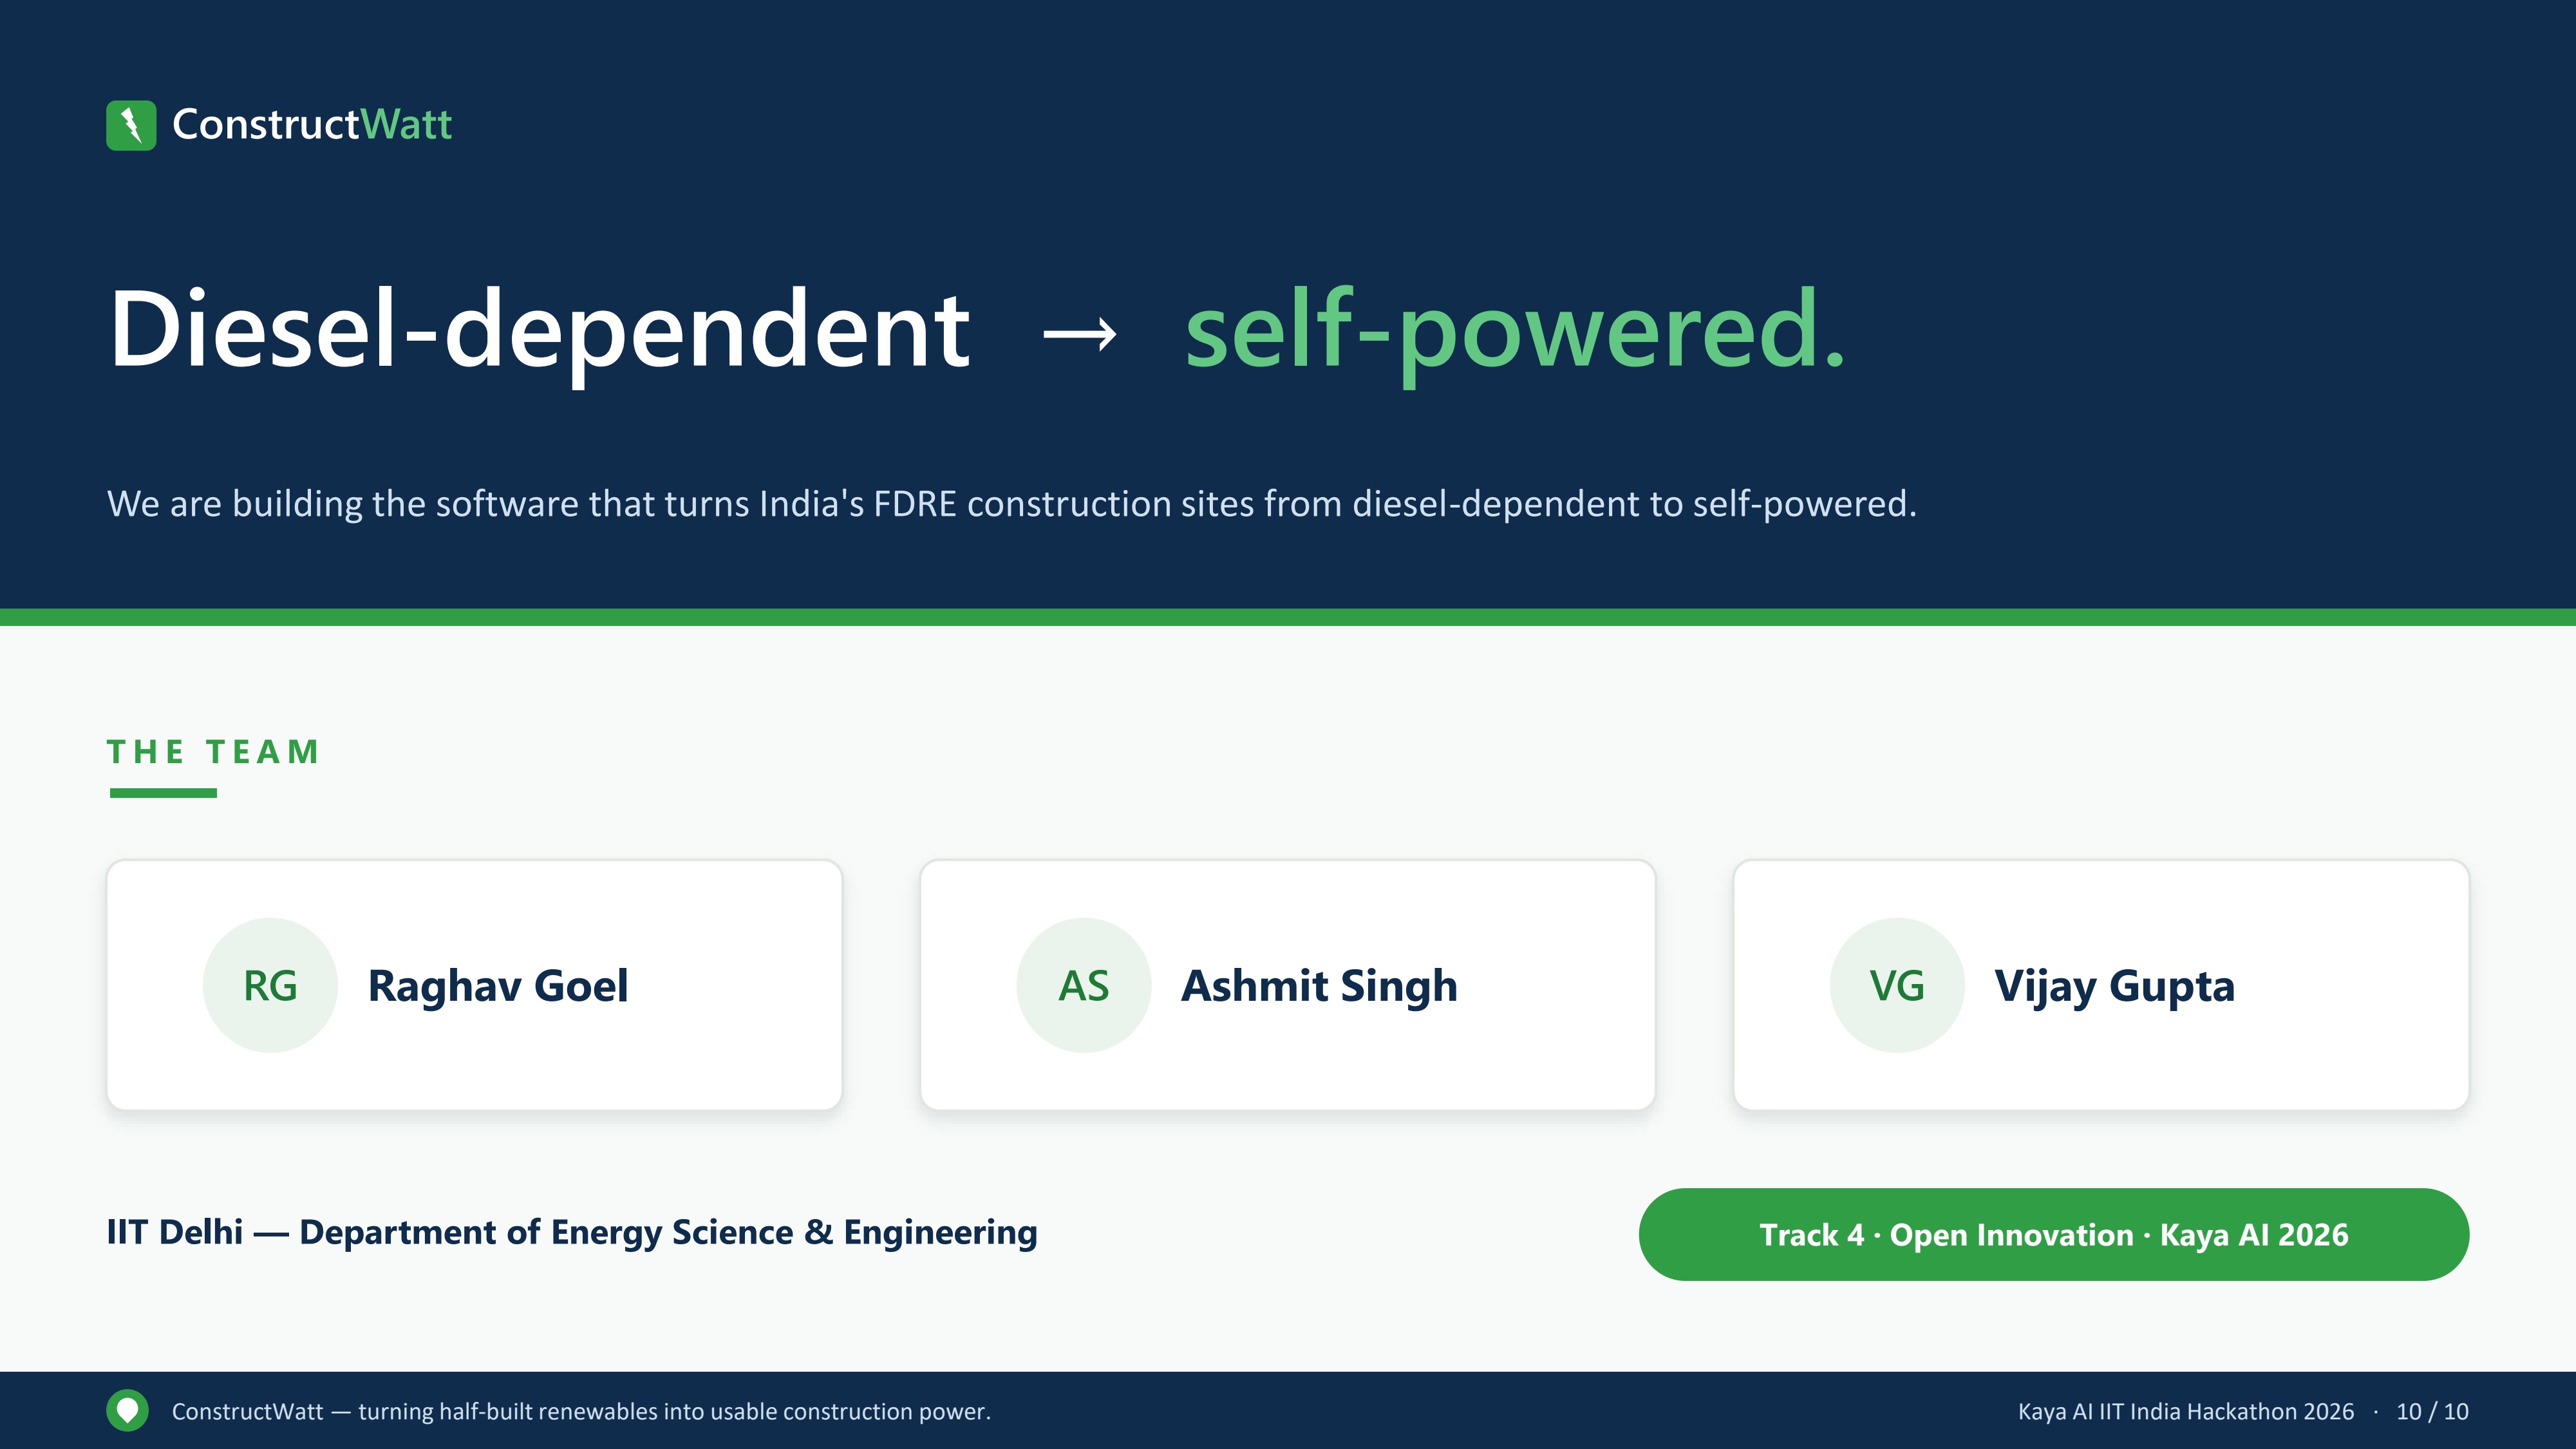
| Team | Raghav Goel · Ashmit Singh · Vijay Gupta |
| Institution | IIT Delhi — Department of Energy Science & Engineering |
| Event | Kaya AI IIT India Hackathon 2026 |
| Track | Track 4 — Open Innovation |
| Stage | Stage 1 submission |
Abstract
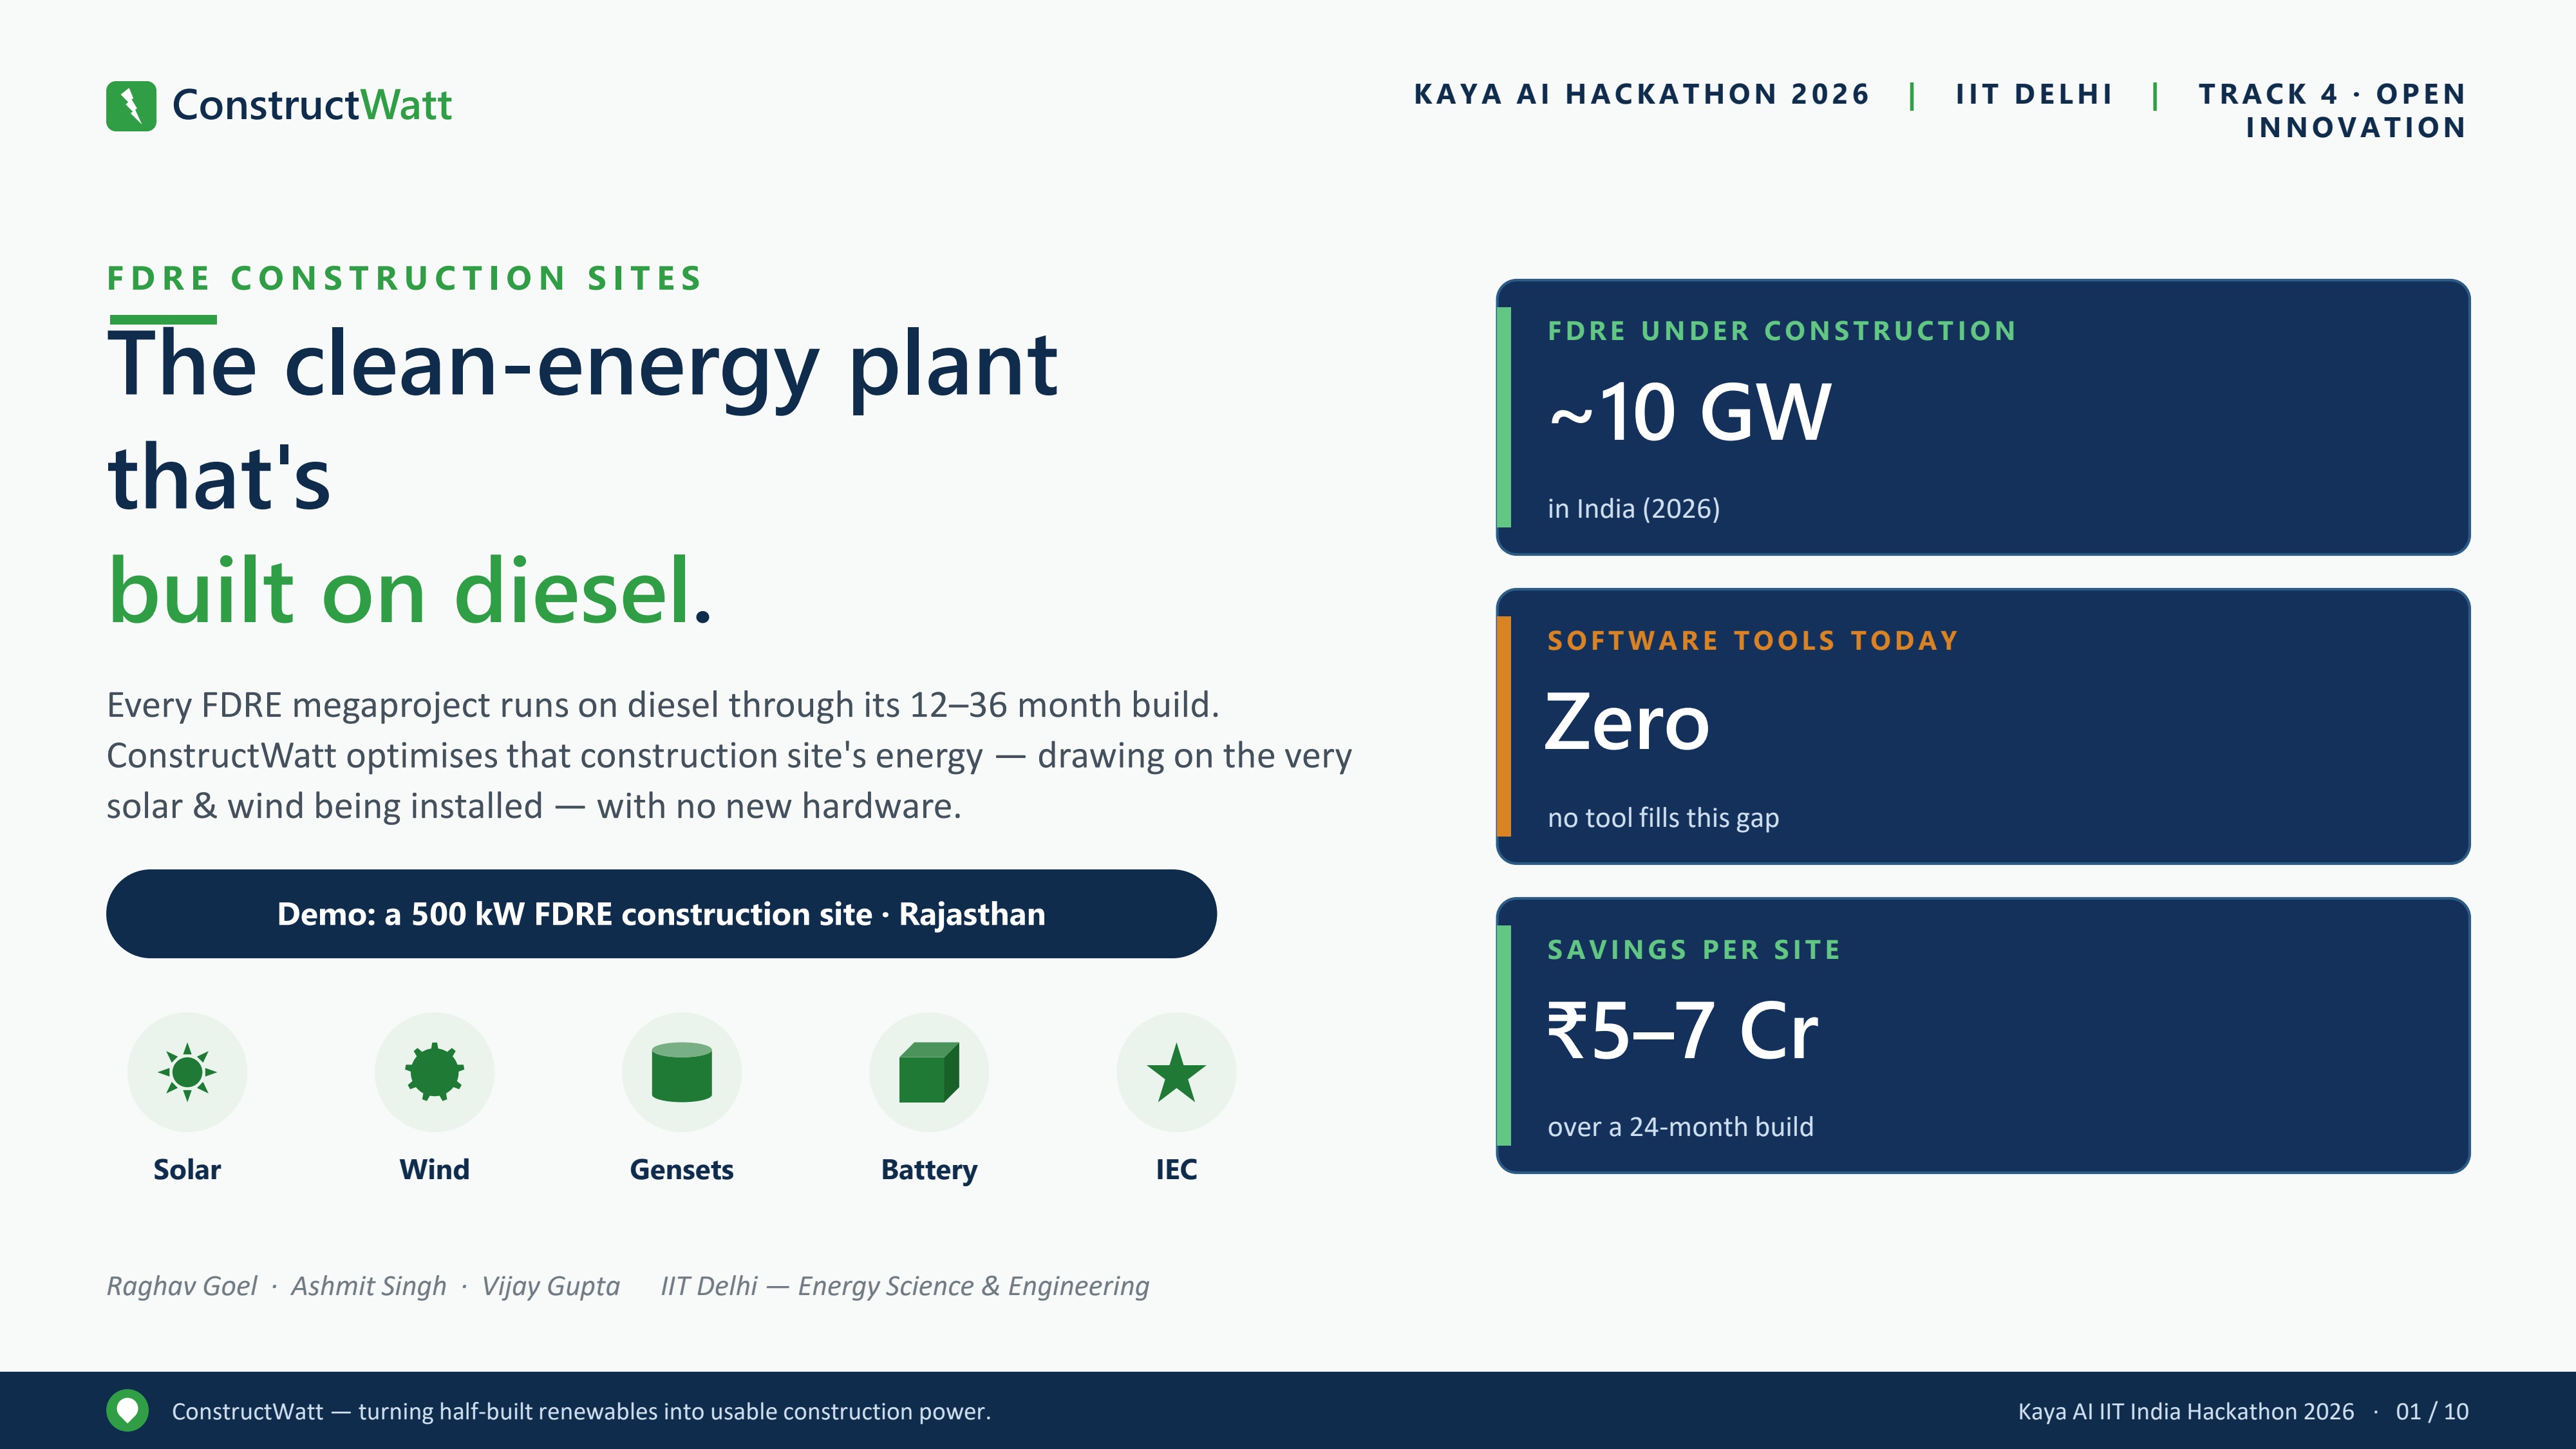
Every Firm and Dispatchable Renewable Energy (FDRE) megaproject in India spends 12–36 months as a construction site that runs entirely on diesel — even as the solar strings and wind turbines that will power it are progressively installed on that same site. ConstructWatt is a five-agent AI pipeline that reads a construction site's live telemetry, decides — every 15 minutes — how much of the partially-commissioned clean capacity can be safely used, and optimises the diesel–renewable dispatch to minimise fuel burn under hard physical and safety constraints. It is a software layer that needs no new hardware, connecting over industrial protocols already present on modern sites, and it transitions from construction-power management to operational energy management at Commercial Operations Date (COD). We estimate a projected 15–25 % reduction in construction diesel per site.
1. Problem Statement
1.1 The diesel paradox
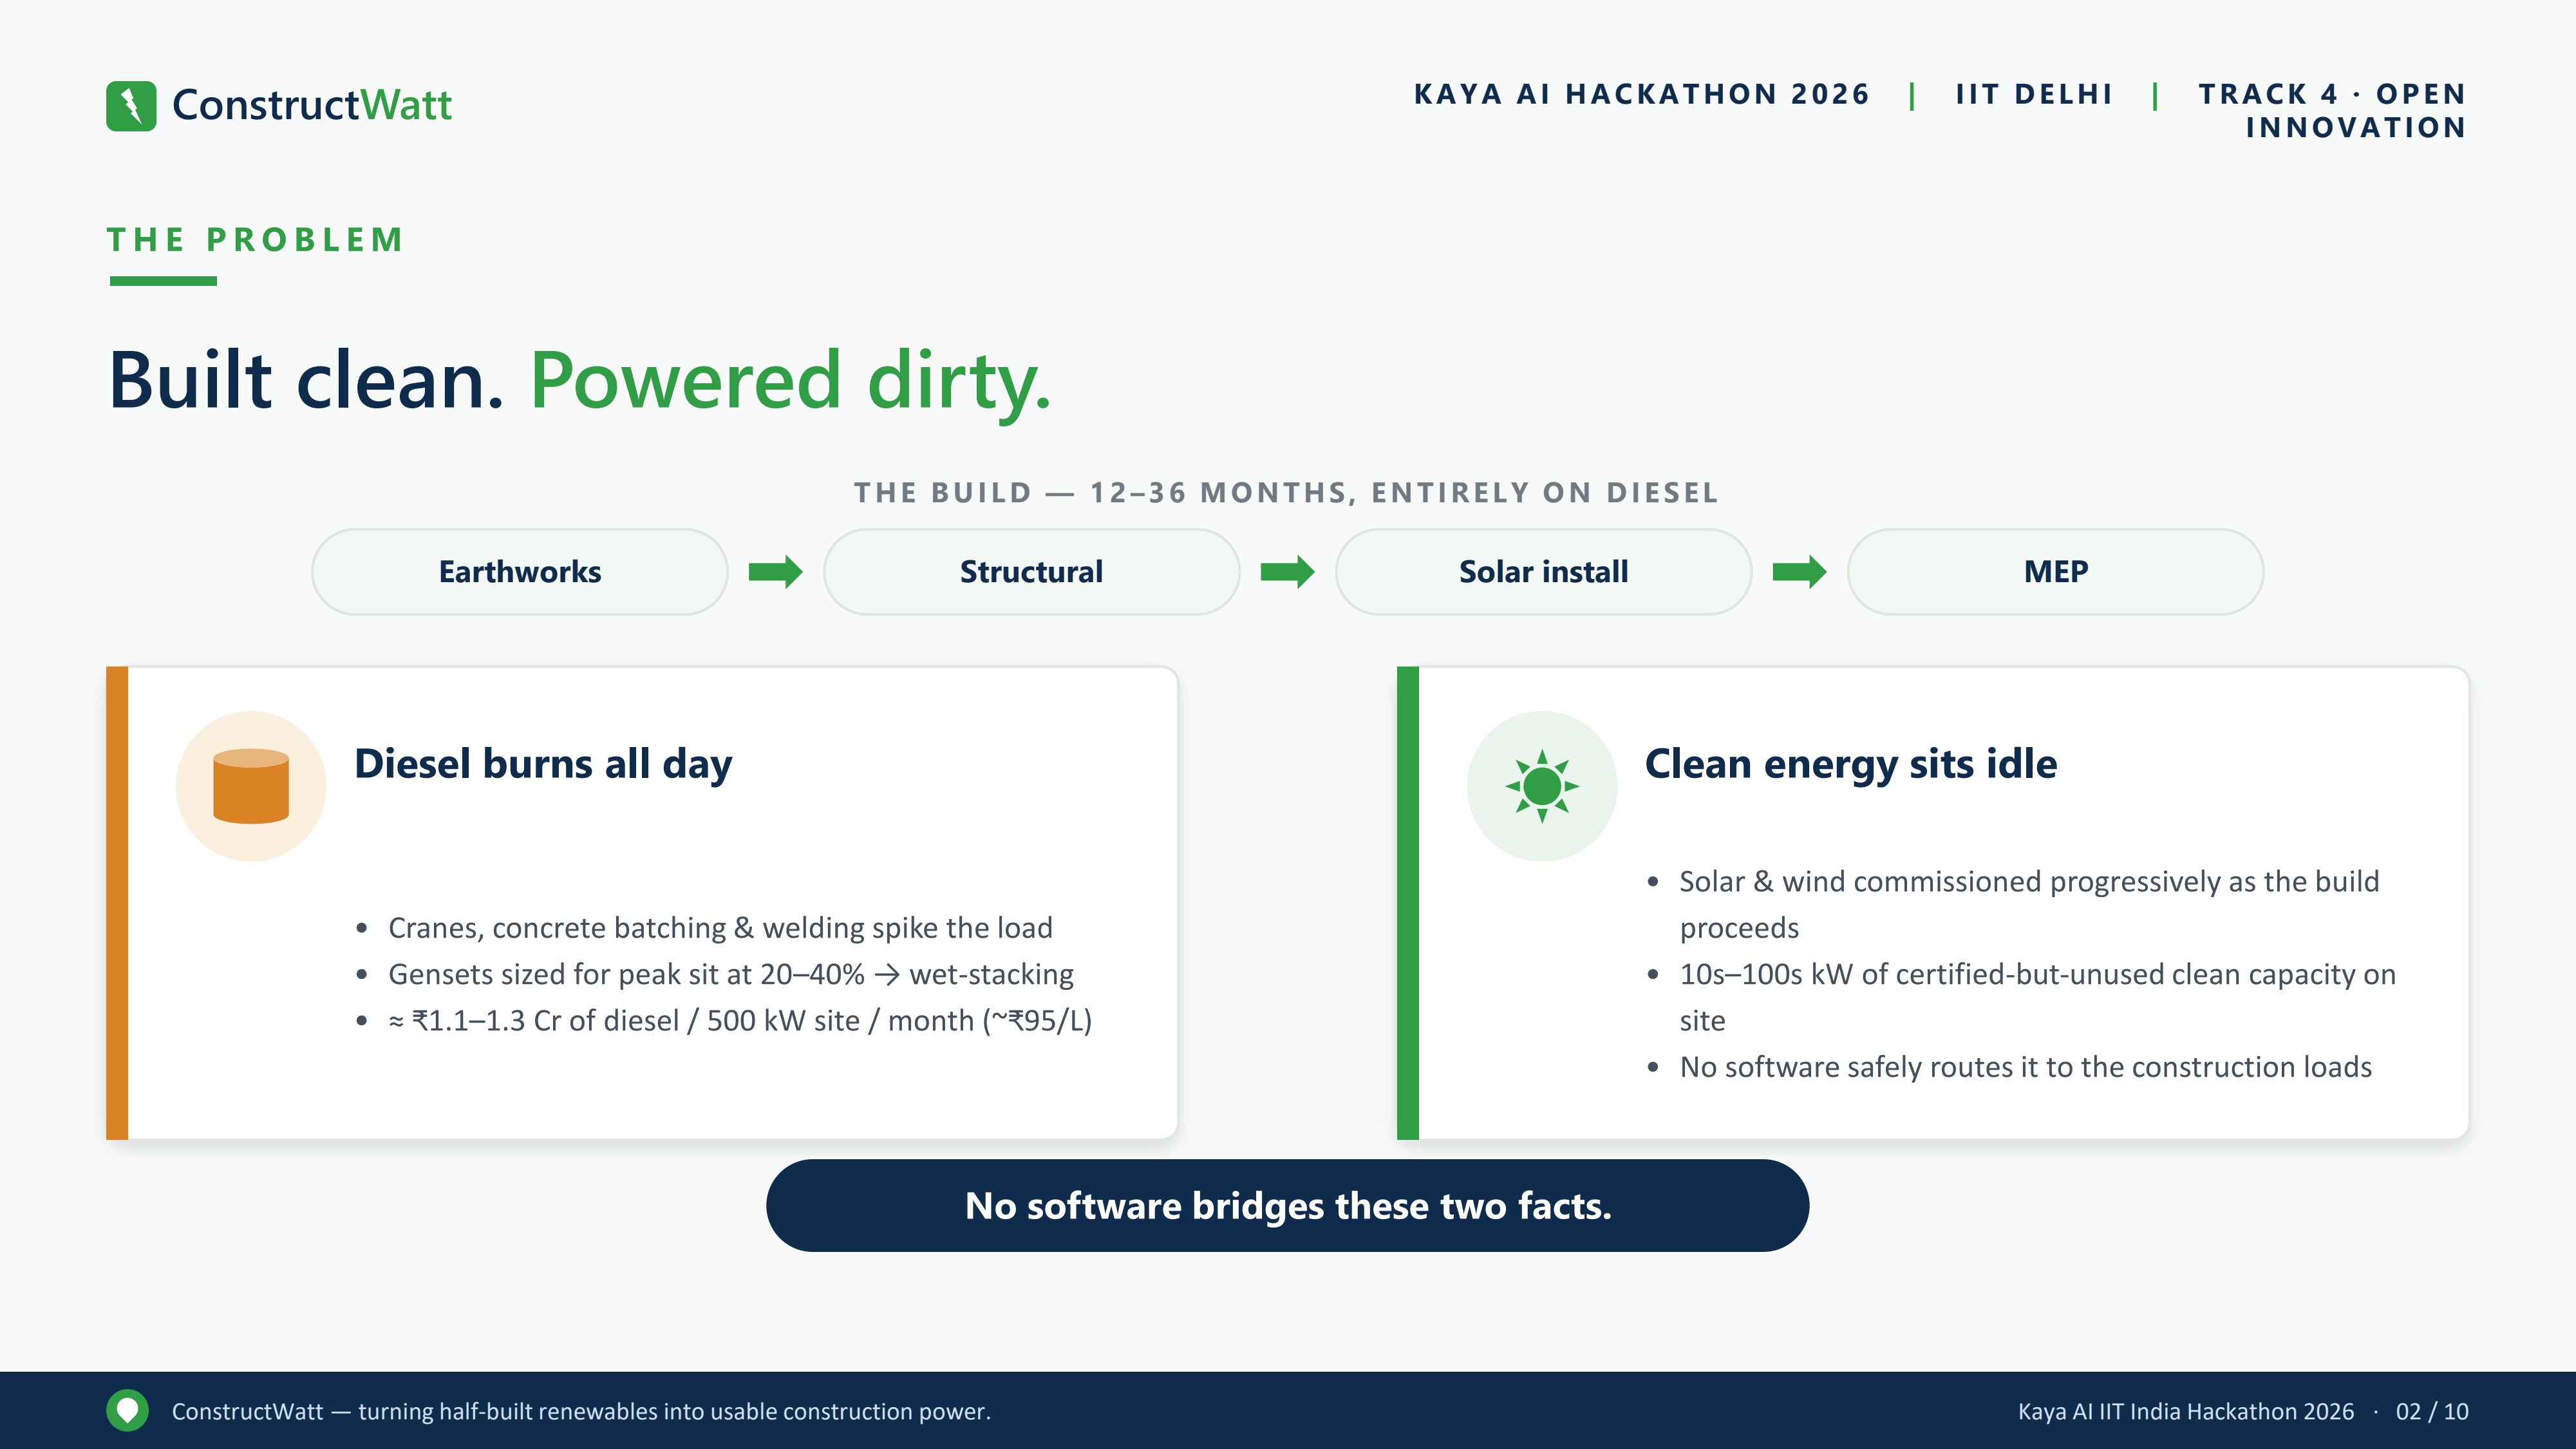
FDRE projects (co-located solar + wind + battery, contracted to deliver firm round-the-clock power) are built over 12–36 months, during which the site is powered almost entirely by diesel gensets. Two compounding inefficiencies arise:
(A) Diesel is burned wastefully. Gensets are sized for worst-case peaks (tower-crane inrush, full concrete pours) but spend most hours at 20–40 % load. Operating below ~50 % load causes wet-stacking — unburned fuel fouls injectors, turbochargers and exhaust — adding roughly 15–20 % to fuel consumption per kWh versus the optimal 75–85 % load band. A ~500 kW site burns on the order of ₹1.1–1.3 Cr of diesel per month (at ~₹95/L).
(B) Clean capacity sits stranded. Solar and wind are commissioned progressively as the build proceeds. At any moment, tens to hundreds of kW of certified-but-unused clean capacity exist on site — generating power that no system routes to construction loads, because managing partially commissioned assets safely is too complex to do by hand.
1.2 The gap no existing tool fills
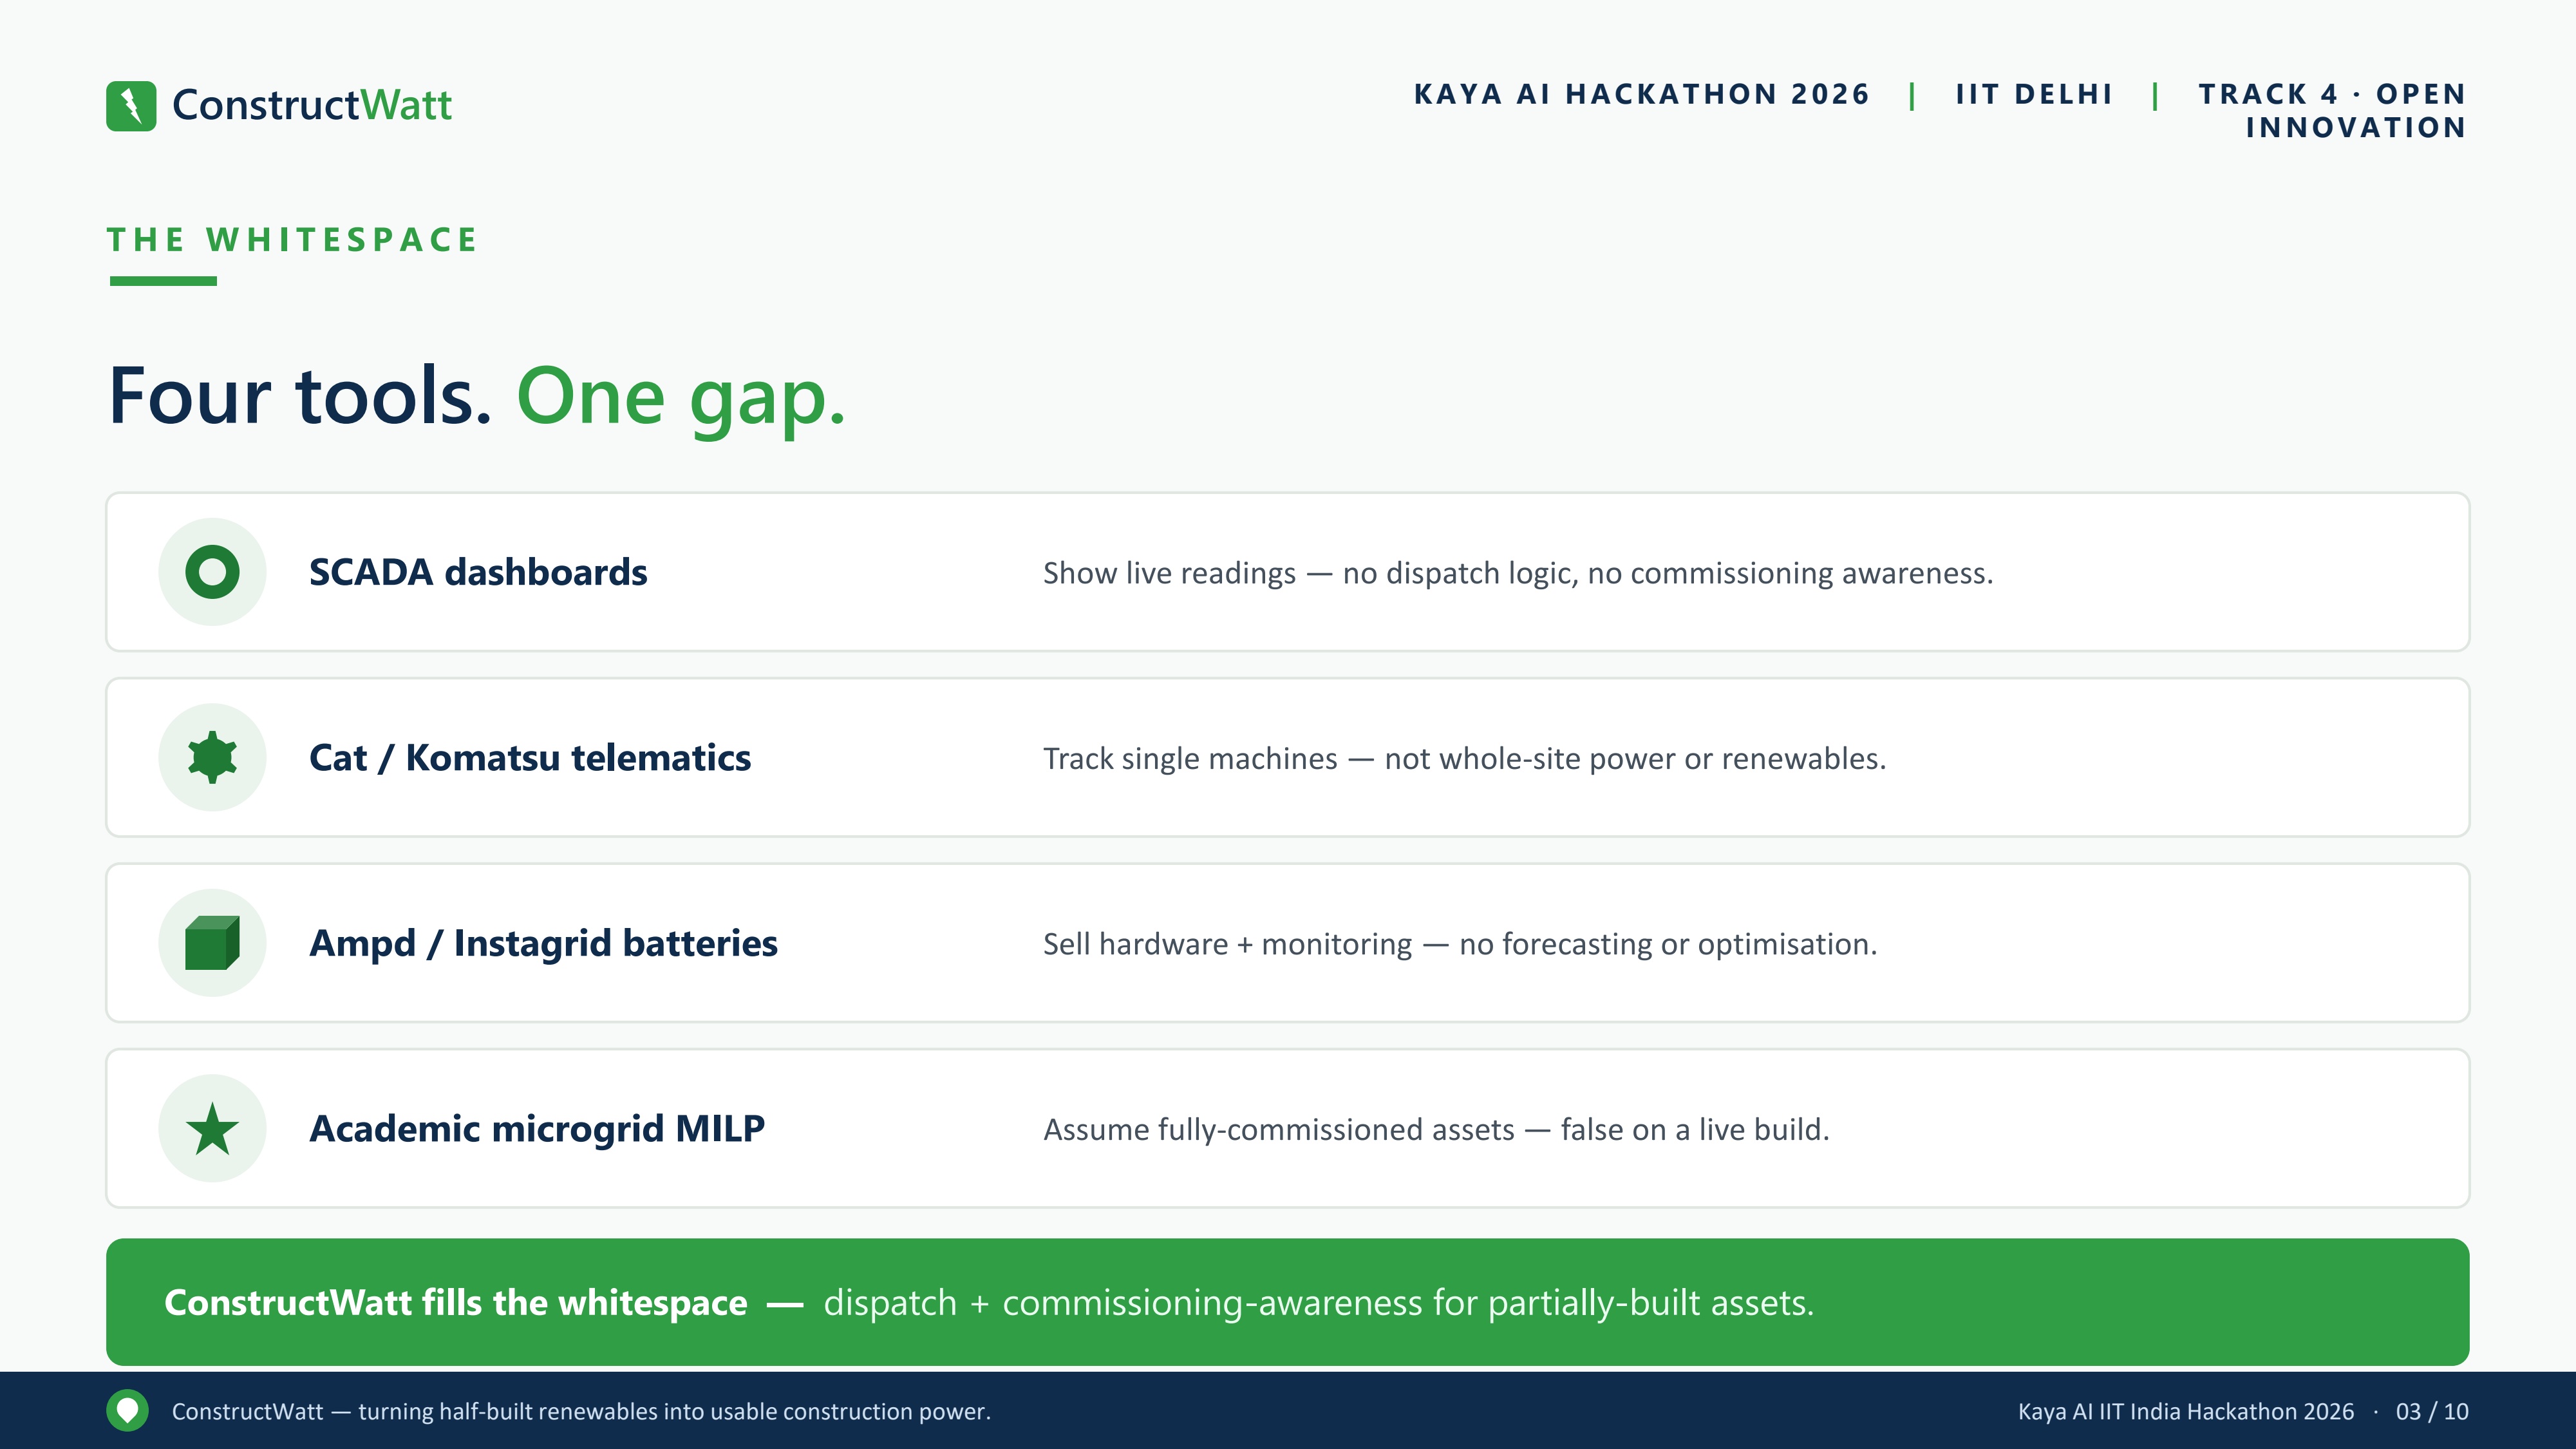
| Tool class | What it does | What it misses |
|---|---|---|
| SCADA dashboards | Show live readings | No dispatch logic, no commissioning awareness |
| Equipment telematics (Cat, Komatsu) | Single-machine tracking | No whole-site power, no renewables |
| Battery/hybrid vendors (Ampd, Instagrid) | Hardware + monitoring | No forecasting or optimisation |
| Academic microgrid MILP/RL | Optimal dispatch | Assume fully commissioned, reliable assets |
A targeted literature and market scan found no tool that applies AI-driven dispatch optimisation to partially-commissioned renewable assets on an active construction site. ConstructWatt fills that whitespace.
1.3 Why it matters now
- ~10 GW of FDRE is under construction in India (≈ 9.7 GW), with 14 GW+ tendered since the Ministry of Power's June-2023 FDRE guidelines (SJVN, NHPC, SECI, NTPC).
- India's first FDRE project (Juniper Green Energy: 259 MWp solar + 280 MW wind + 200 MWh BESS) entered commissioning in 2026.
- FDRE is projected to reach cost parity with new thermal by 2030 (IISD/CSTEP), so this construction pipeline will only grow — and every gigawatt implies ~2 years of construction-phase diesel.
2. Chosen Track — Track 4: Open Innovation
ConstructWatt is submitted to Track 4 (Open Innovation) because it defines and solves a genuinely new problem class — dispatch optimisation for partially-commissioned energy assets — rather than iterating on an existing product category. It sits at the intersection of applied optimisation, physics-based forecasting, industrial IoT, and LLM-driven explainability, and its impact (displacing diesel on clean-energy construction sites) is squarely an open-innovation sustainability play with no incumbent. The novelty is itself the argument: a construction site building clean power should not run on dirty power, and no software today bridges that gap.
3. Proposed Solution — ConstructWatt
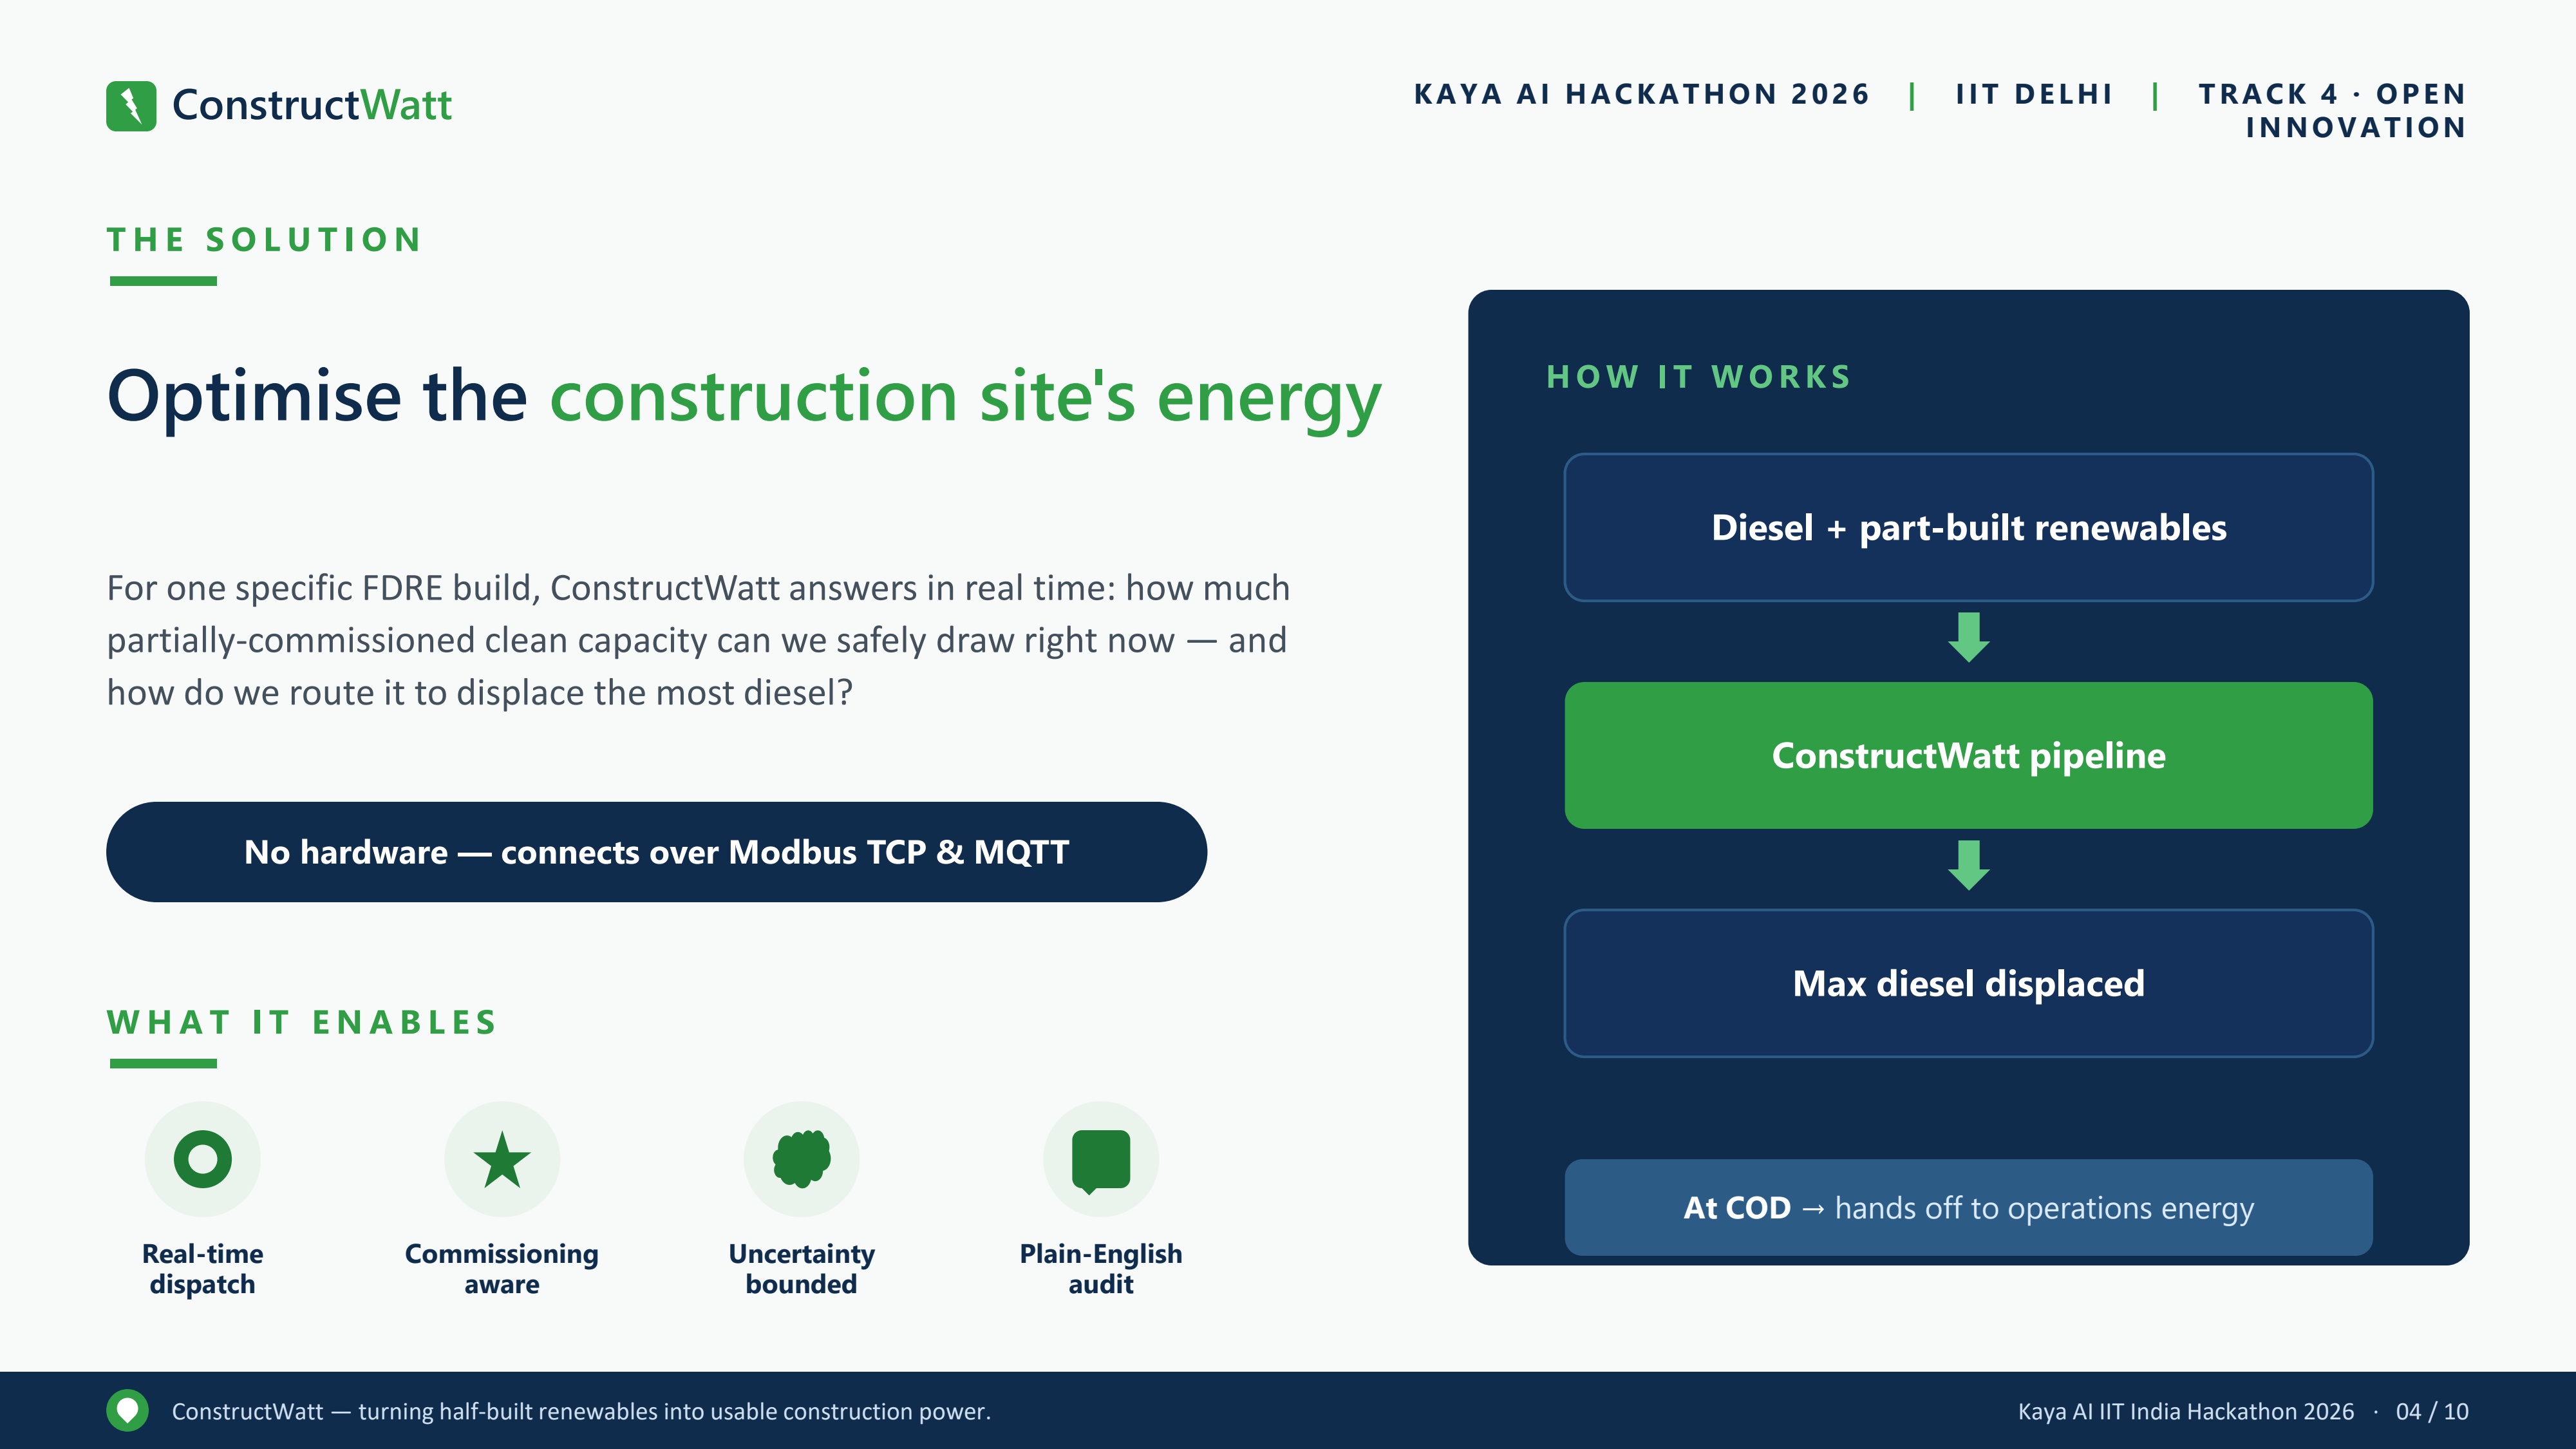
ConstructWatt answers one question in real time:
How much of our partially-built renewable capacity can we safely draw on right now — and how do we route it to displace the most diesel?
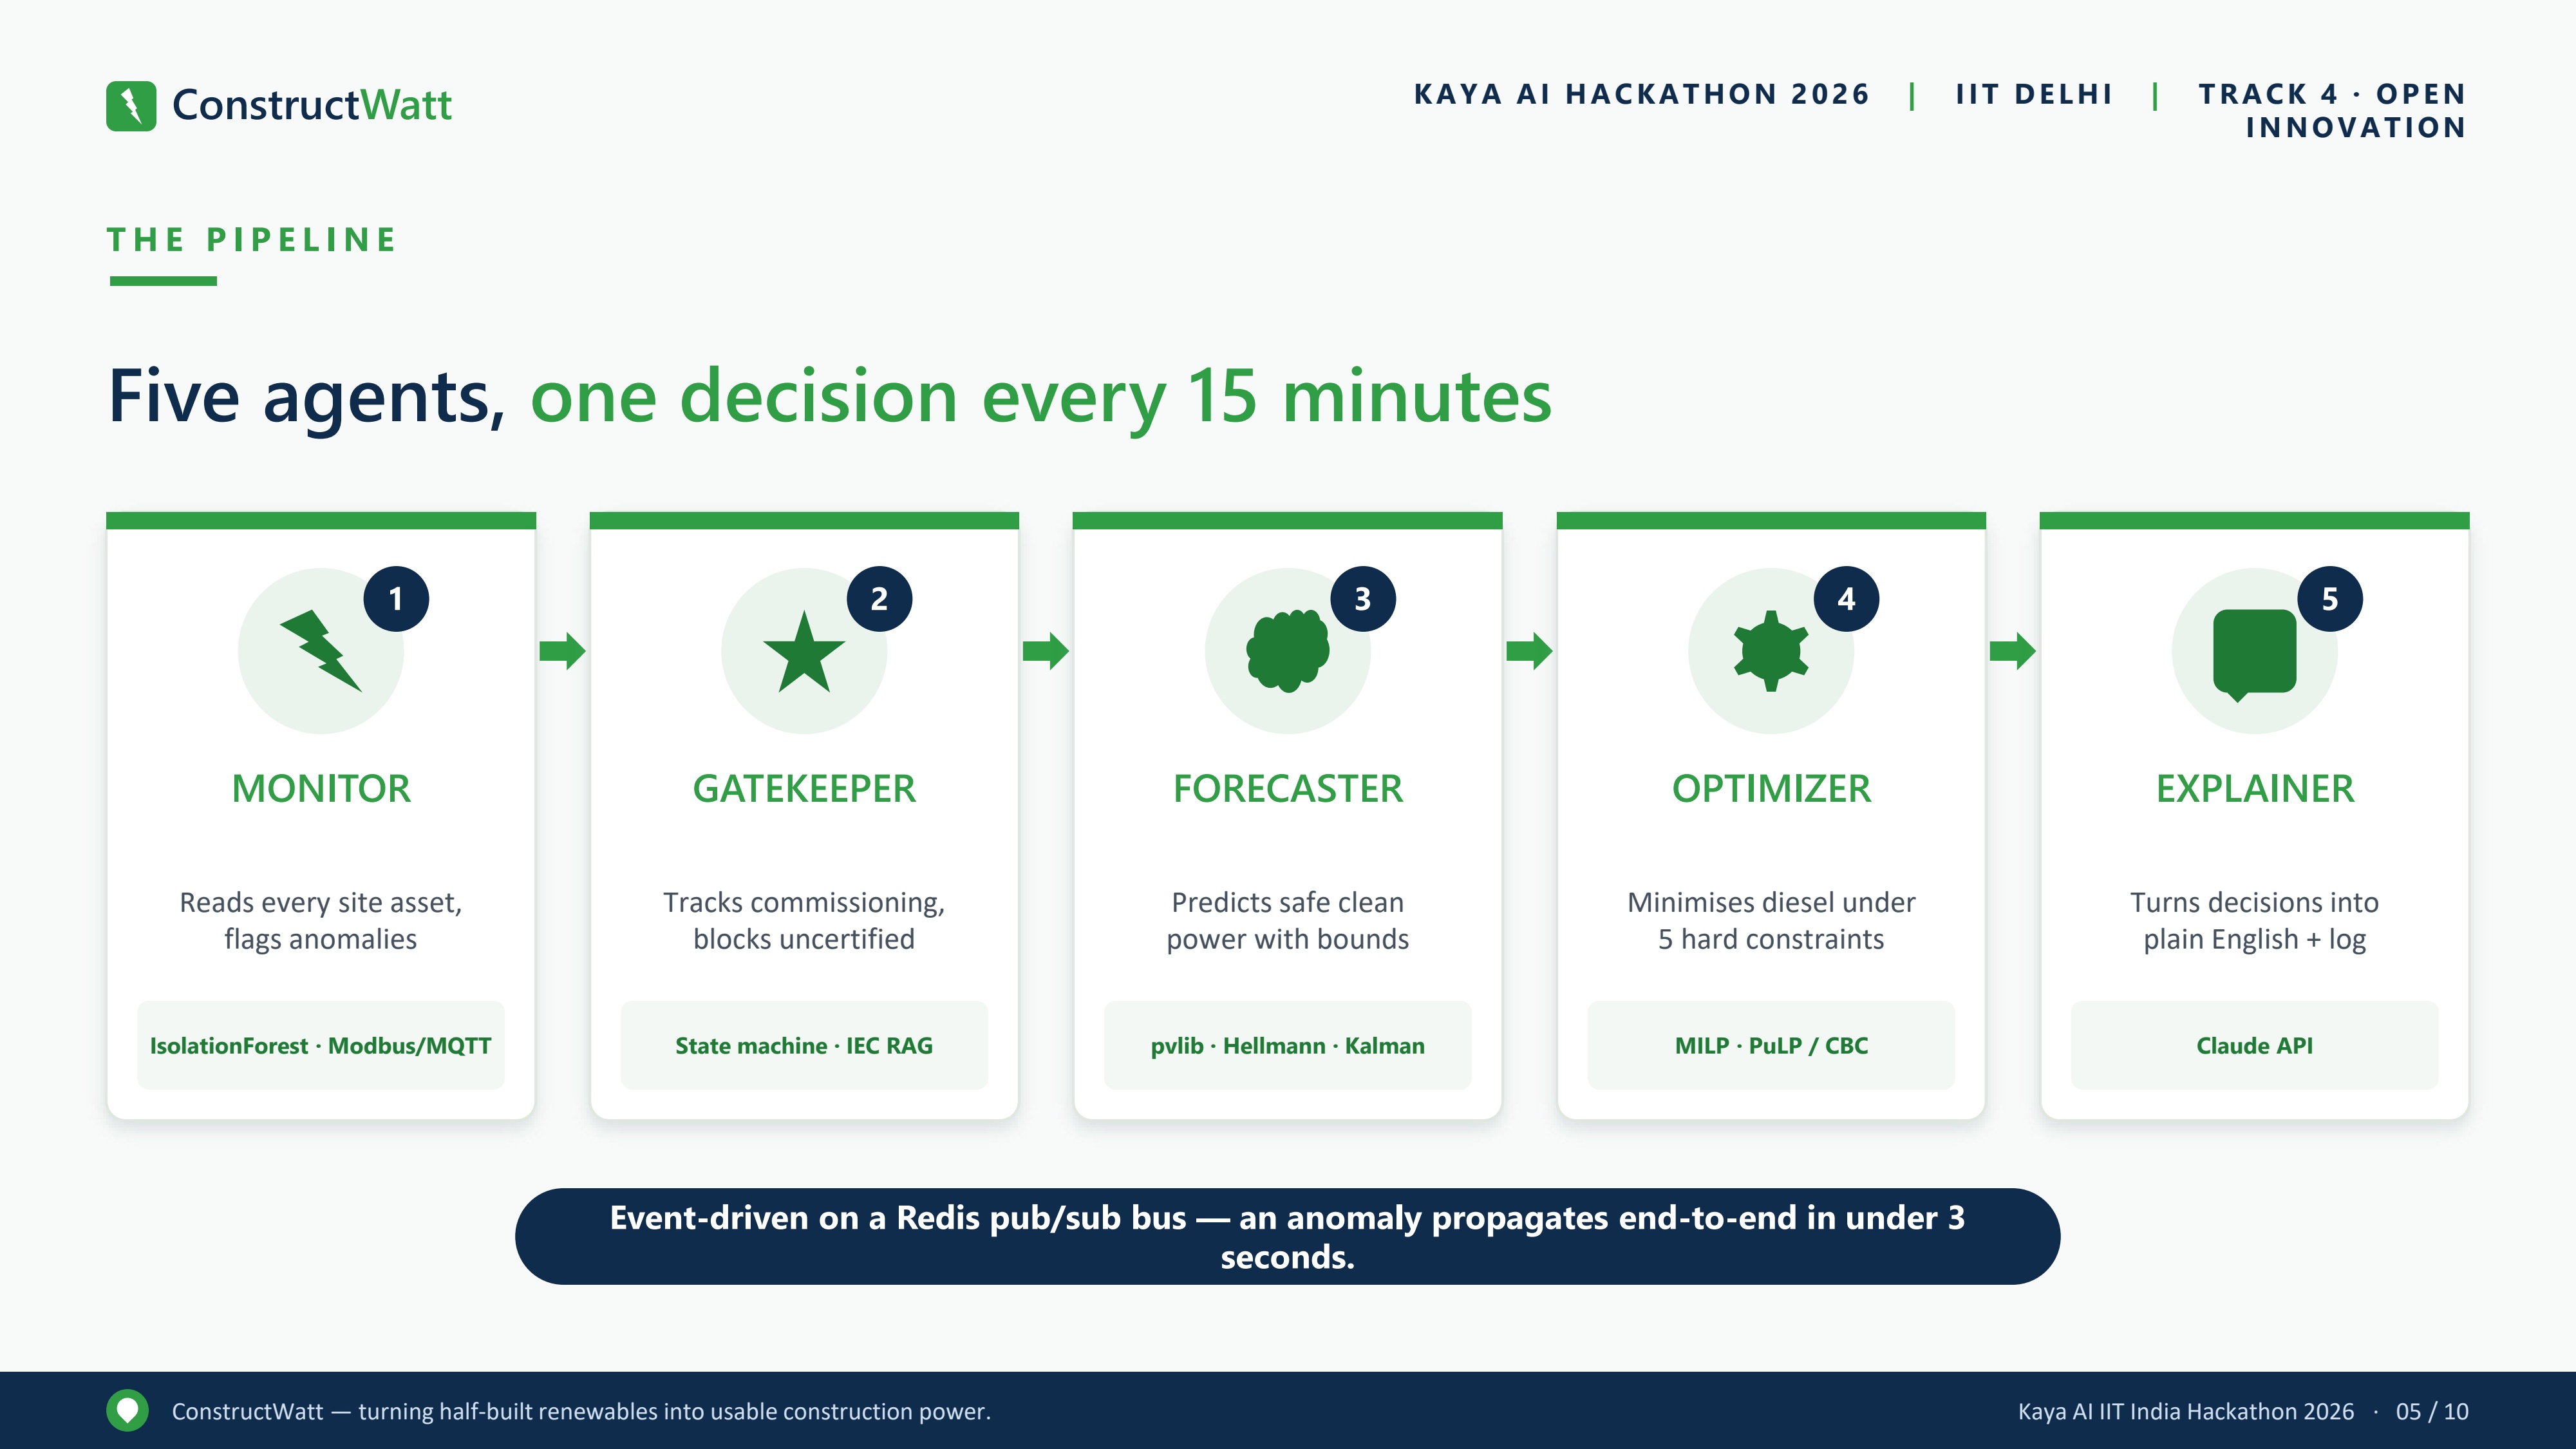
It runs an event-driven, five-agent pipeline on a Redis pub/sub bus, on a fixed 15-minute cycle or immediately on an anomaly (end-to-end propagation in under 3 seconds). No new hardware is required — it connects over Modbus TCP and MQTT, already standard on modern FDRE sites.
3.1 The five agents
| # | Agent | Responsibility | Key technique |
|---|---|---|---|
| 1 | MONITOR | Read every asset each cycle; flag anomalies | Isolation Forest on physics residuals · Modbus/MQTT |
| 2 | GATEKEEPER | Commissioning state machine + non-negotiable safety gate | State machine · RAG over IEC 62446 / IEC 61400 |
| 3 | FORECASTER | Predict safely usable clean power with uncertainty bounds | pvlib · Hellmann · Monte Carlo · Kalman fusion |
| 4 | OPTIMIZER | Minimise diesel cost under 5 hard constraints | MILP (PuLP + CBC) |
| 5 | EXPLAINER | Translate every decision to plain English; audit log; COD close-out | Claude (Anthropic API) |
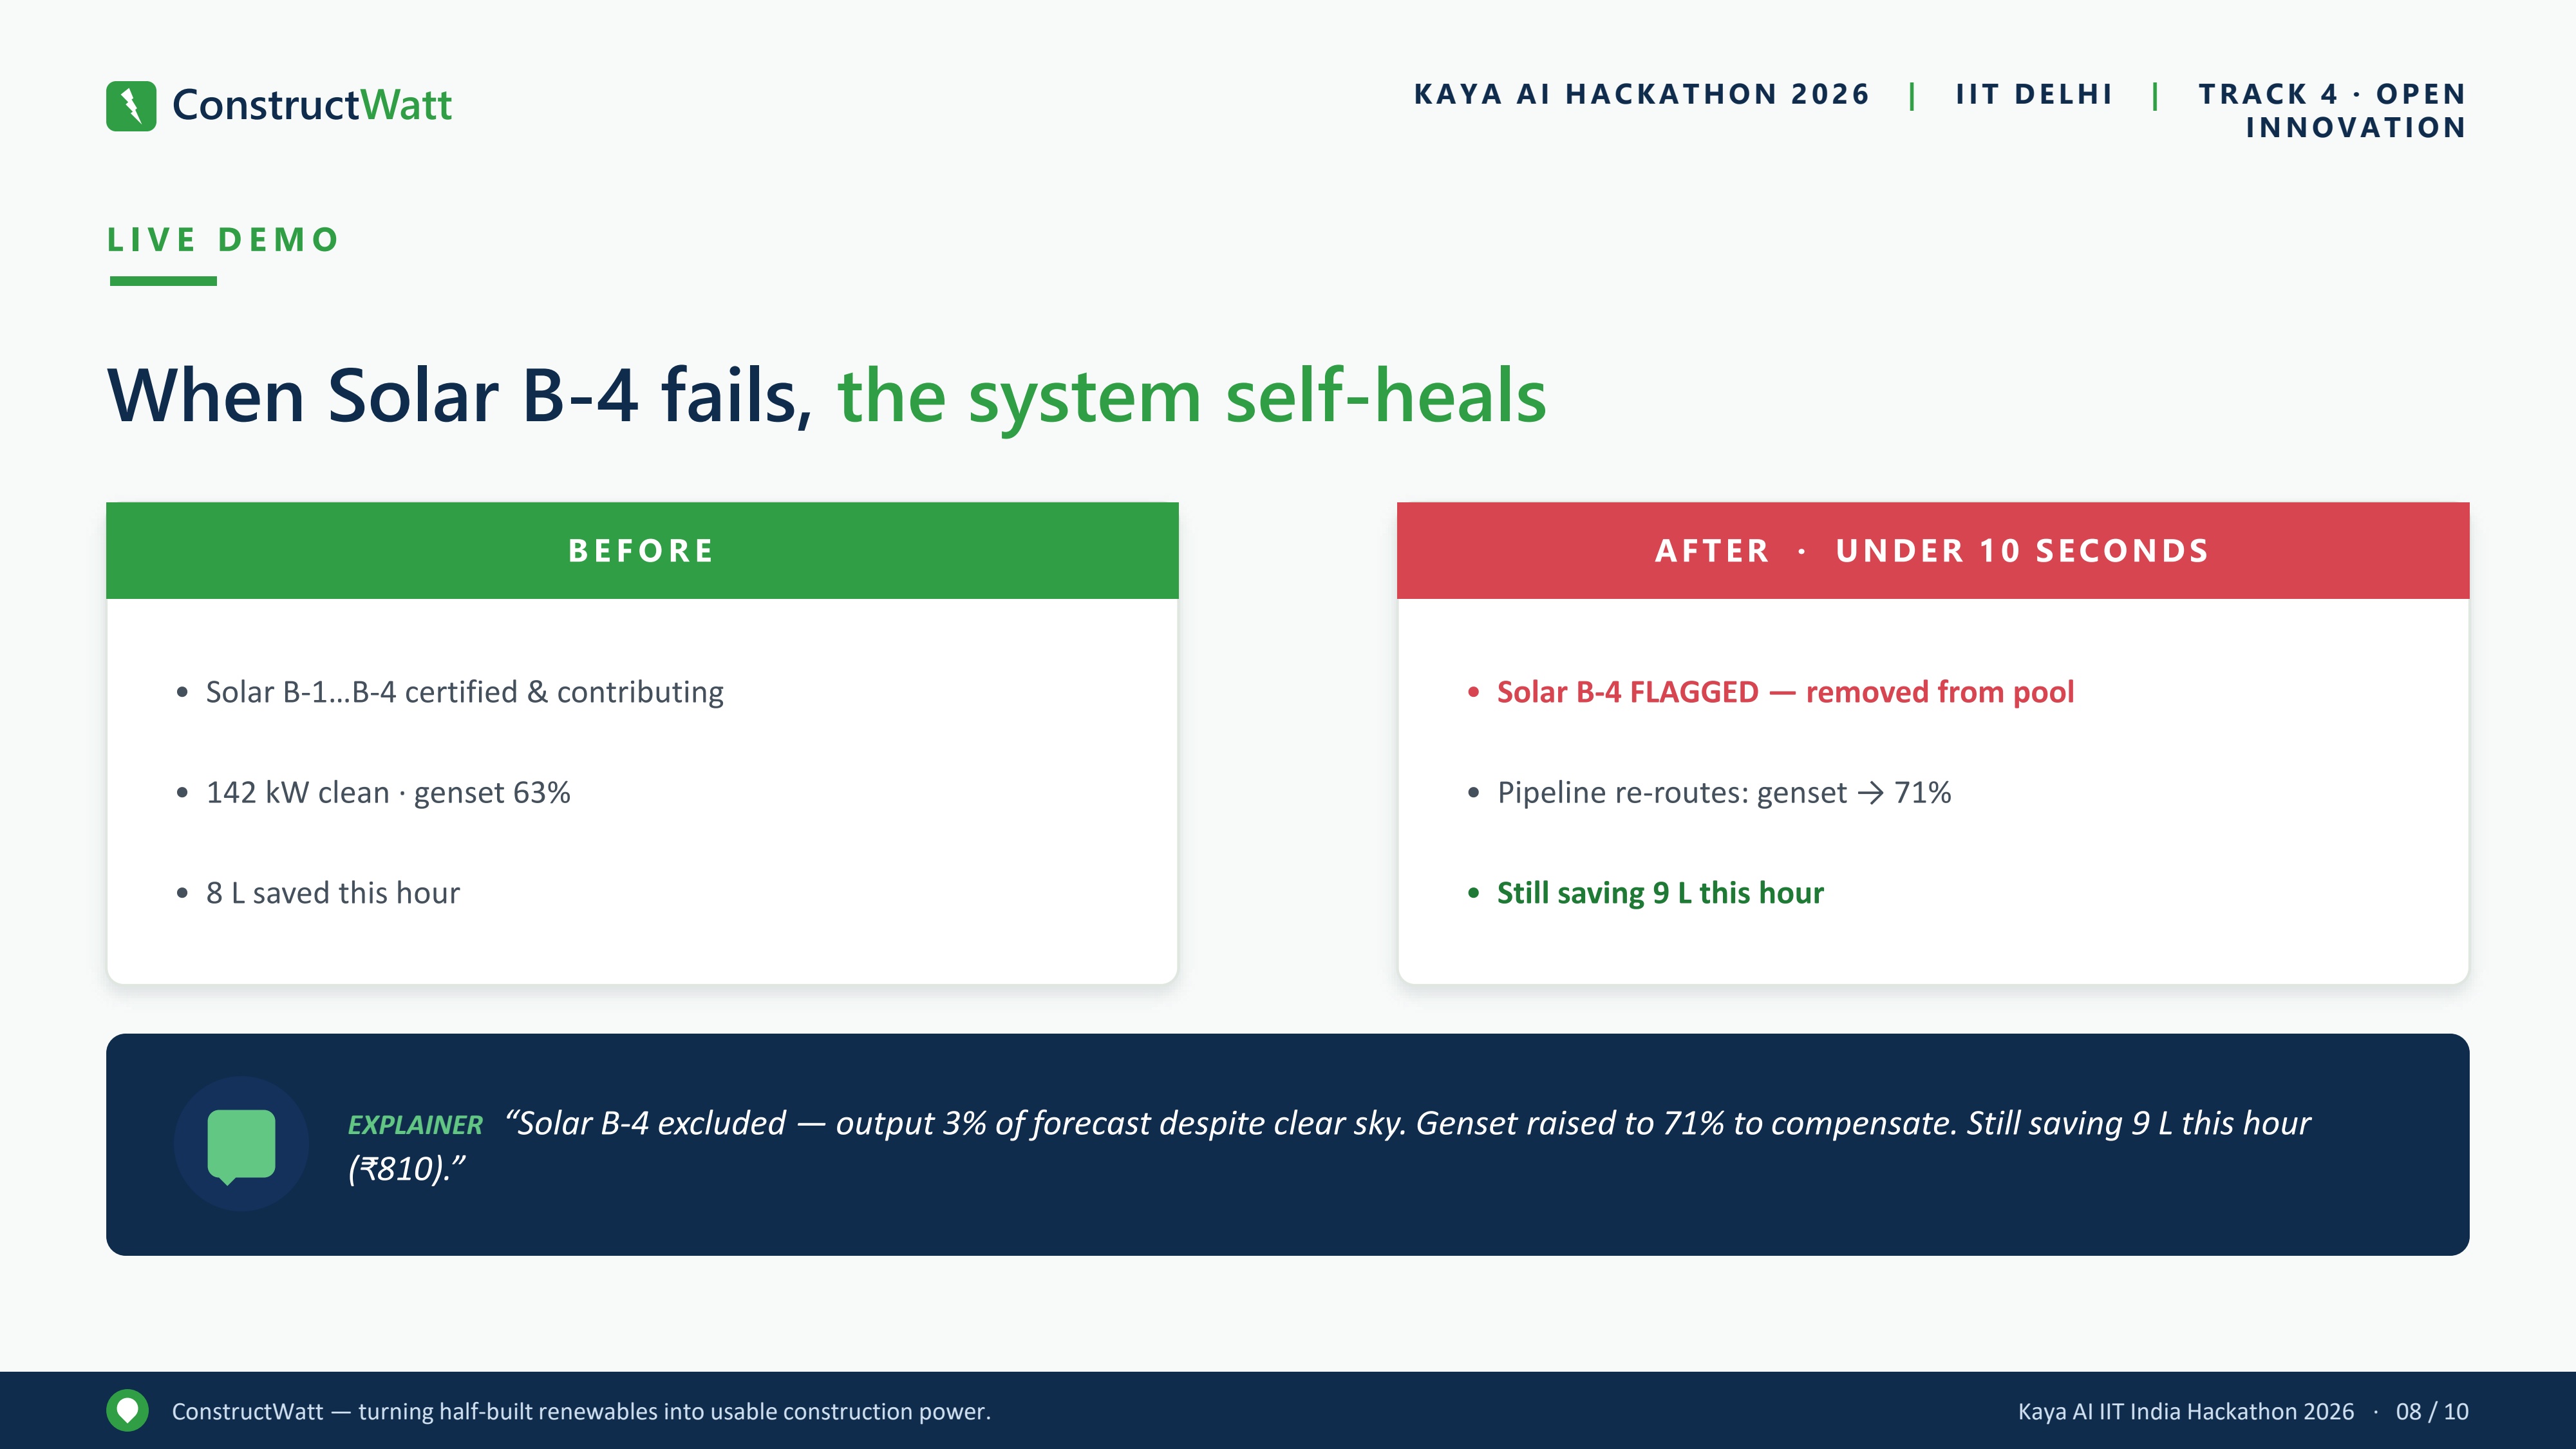
Safety gate (GATEKEEPER). Only assets in state CERTIFIED with zero recent anomaly flags enter the
power pool. A Pulse anomaly propagates a FLAGGED state within seconds; software can never override the
gate — only a site engineer can physically re-certify. Confidence weights scale capacity by
commissioning age (0–7 days → 0.75; 7–30 → 0.90; > 30 → 1.00).
$$ \text{NOT-INSTALLED} \rightarrow \text{INSTALLED} \rightarrow \text{TESTED} \rightarrow \text{CERTIFIED} \;\leftrightarrow\; \text{FLAGGED} $$
4. Technical Approach
4.1 FORECASTER — physics with quantified uncertainty
Solar (per string), via pvlib: plane-of-array irradiance from GHI, then
$$ P_{\text{dc}} = \text{POA} \times n_{\text{panel}} \times A \times \eta \times f_{\text{derate}} \times \bigl(1 + \gamma\,(T_{\text{cell}} - 25)\bigr), $$
with $n=40$, $A=1.65\,\text{m}^2$, $\eta=0.21$, $f_{\text{derate}}=0.85$, $\gamma=-0.004/^{\circ}\text{C}$, followed by the inverter efficiency curve and the GATEKEEPER confidence weight per string.
Wind (per turbine): hub-height extrapolation via the Hellmann exponent, then a power-curve lookup:
$$ v_{\text{hub}} = v_{10}\left(\frac{80}{10}\right)^{0.143}, \qquad P_{\text{wind}} = \text{PowerCurve}(v_{\text{hub}}). $$
Uncertainty. A Monte-Carlo ensemble ($N=50$, additive Gaussian noise $\sigma = 0.08\times$ expected per asset) yields the distribution from which we take
$$ P_{20},\; P_{50},\; P_{80} \;=\; \text{20th},\ \text{50th},\ \text{80th percentiles.} $$
A Kalman filter fuses the physics prior with live MONITOR readings (measurement weight 0.6 when within 15 % of forecast). The OPTIMIZER uses the conservative $P_{20}$ as its renewable cap — a construction power outage during a crane lift is a real safety hazard, so we intentionally leave clean energy unused 80 % of the time and relax the bound only as forecast accuracy improves.
4.2 OPTIMIZER — the construction-specific MILP
Decision variables per timestep $t$: renewable draw $P_{\text{ren}}(t)$, genset output $P_{\text{gen}}(t)$, genset on/off $\delta(t)\in{0,1}$, startup $\delta_{\text{start}}(t)\in{0,1}$, and (if present) battery charge/discharge and state of charge.
Objective — minimise diesel cost:
$$ \min \sum_{t}\Bigl[\, c_d \cdot P_{\text{gen}}(t)\cdot \text{SFC}(\lambda_t)\cdot \Delta t \;+\; c_{\text{start}}\cdot \delta_{\text{start}}(t) \,\Bigr] $$
where the specific-fuel-consumption curve and load factor are
$$ \text{SFC}(\lambda) = 0.40 - 0.05\,\lambda + 0.12\,(\lambda - 0.75)^2, \qquad \lambda_t = \frac{P_{\text{gen}}(t)}{P_{\text{rated}}}. $$
Subject to (all five constraints are load-bearing):
$$ \begin{aligned} \text{(C1)}\quad & P_{\text{ren}}(t) + P_{\text{gen}}(t) + P_{\text{bat}}^{d}(t) \;\ge\; L(t) && \text{(load always met)}\ \text{(C2)}\quad & P_{\text{ren}}(t) \;\le\; P_{\text{safe}}^{P20}(t) && \text{(FORECASTER conservative cap)}\ \text{(C3)}\quad & P_{\text{gen}}(t) \;\ge\; 0.50\,P_{\text{rated}}\,\delta(t) && \text{(wet-stacking floor)}\ \text{(C4)}\quad & P_{\text{gen}}(t) \;\le\; P_{\text{rated}}\,\delta(t) && \text{(genset upper bound)}\ \text{(C5)}\quad & P_{\text{gen}}(t) \;\ge\; 0.25\,P_{\text{rated}}\,p_{\text{inrush}}(t) && \text{(crane-inrush reserve)} \end{aligned} $$
$$ p_{\text{inrush}}(t) = \begin{cases} 0.80 & \text{hour} \in {6,7,13,14} \ 0.10 & \text{otherwise} \end{cases} $$
Solved with PuLP + CBC over a 96-step (24 h, $\Delta t = 0.25$ h) horizon in milliseconds. If the program is infeasible, the system returns an all-diesel fallback with a warning flag — it never crashes and never leaves the load unmet.
What makes C2, C3, C5 novel. Standard microgrid MILPs cap renewables at nameplate, omit a minimum genset load, and use a static N-1 reserve. ConstructWatt caps at the statistical $P_{20}$ of partially-commissioned assets, enforces the wet-stacking floor (real engine-damage physics on isolated sites), and sizes spinning reserve by the time-of-day probability of crane inrush (starting current is 5–8× running). These three are absent from every published microgrid MILP we surveyed.
4.3 Architecture
[Weather API + IoT sensors]
        │  Modbus TCP / MQTT
        ▼
   MONITOR ──▶ GATEKEEPER ──▶ FORECASTER ──▶ OPTIMIZER ──▶ EXPLAINER
        │           (Redis pub/sub bus — event-driven)            │
        ▼                                                          ▼
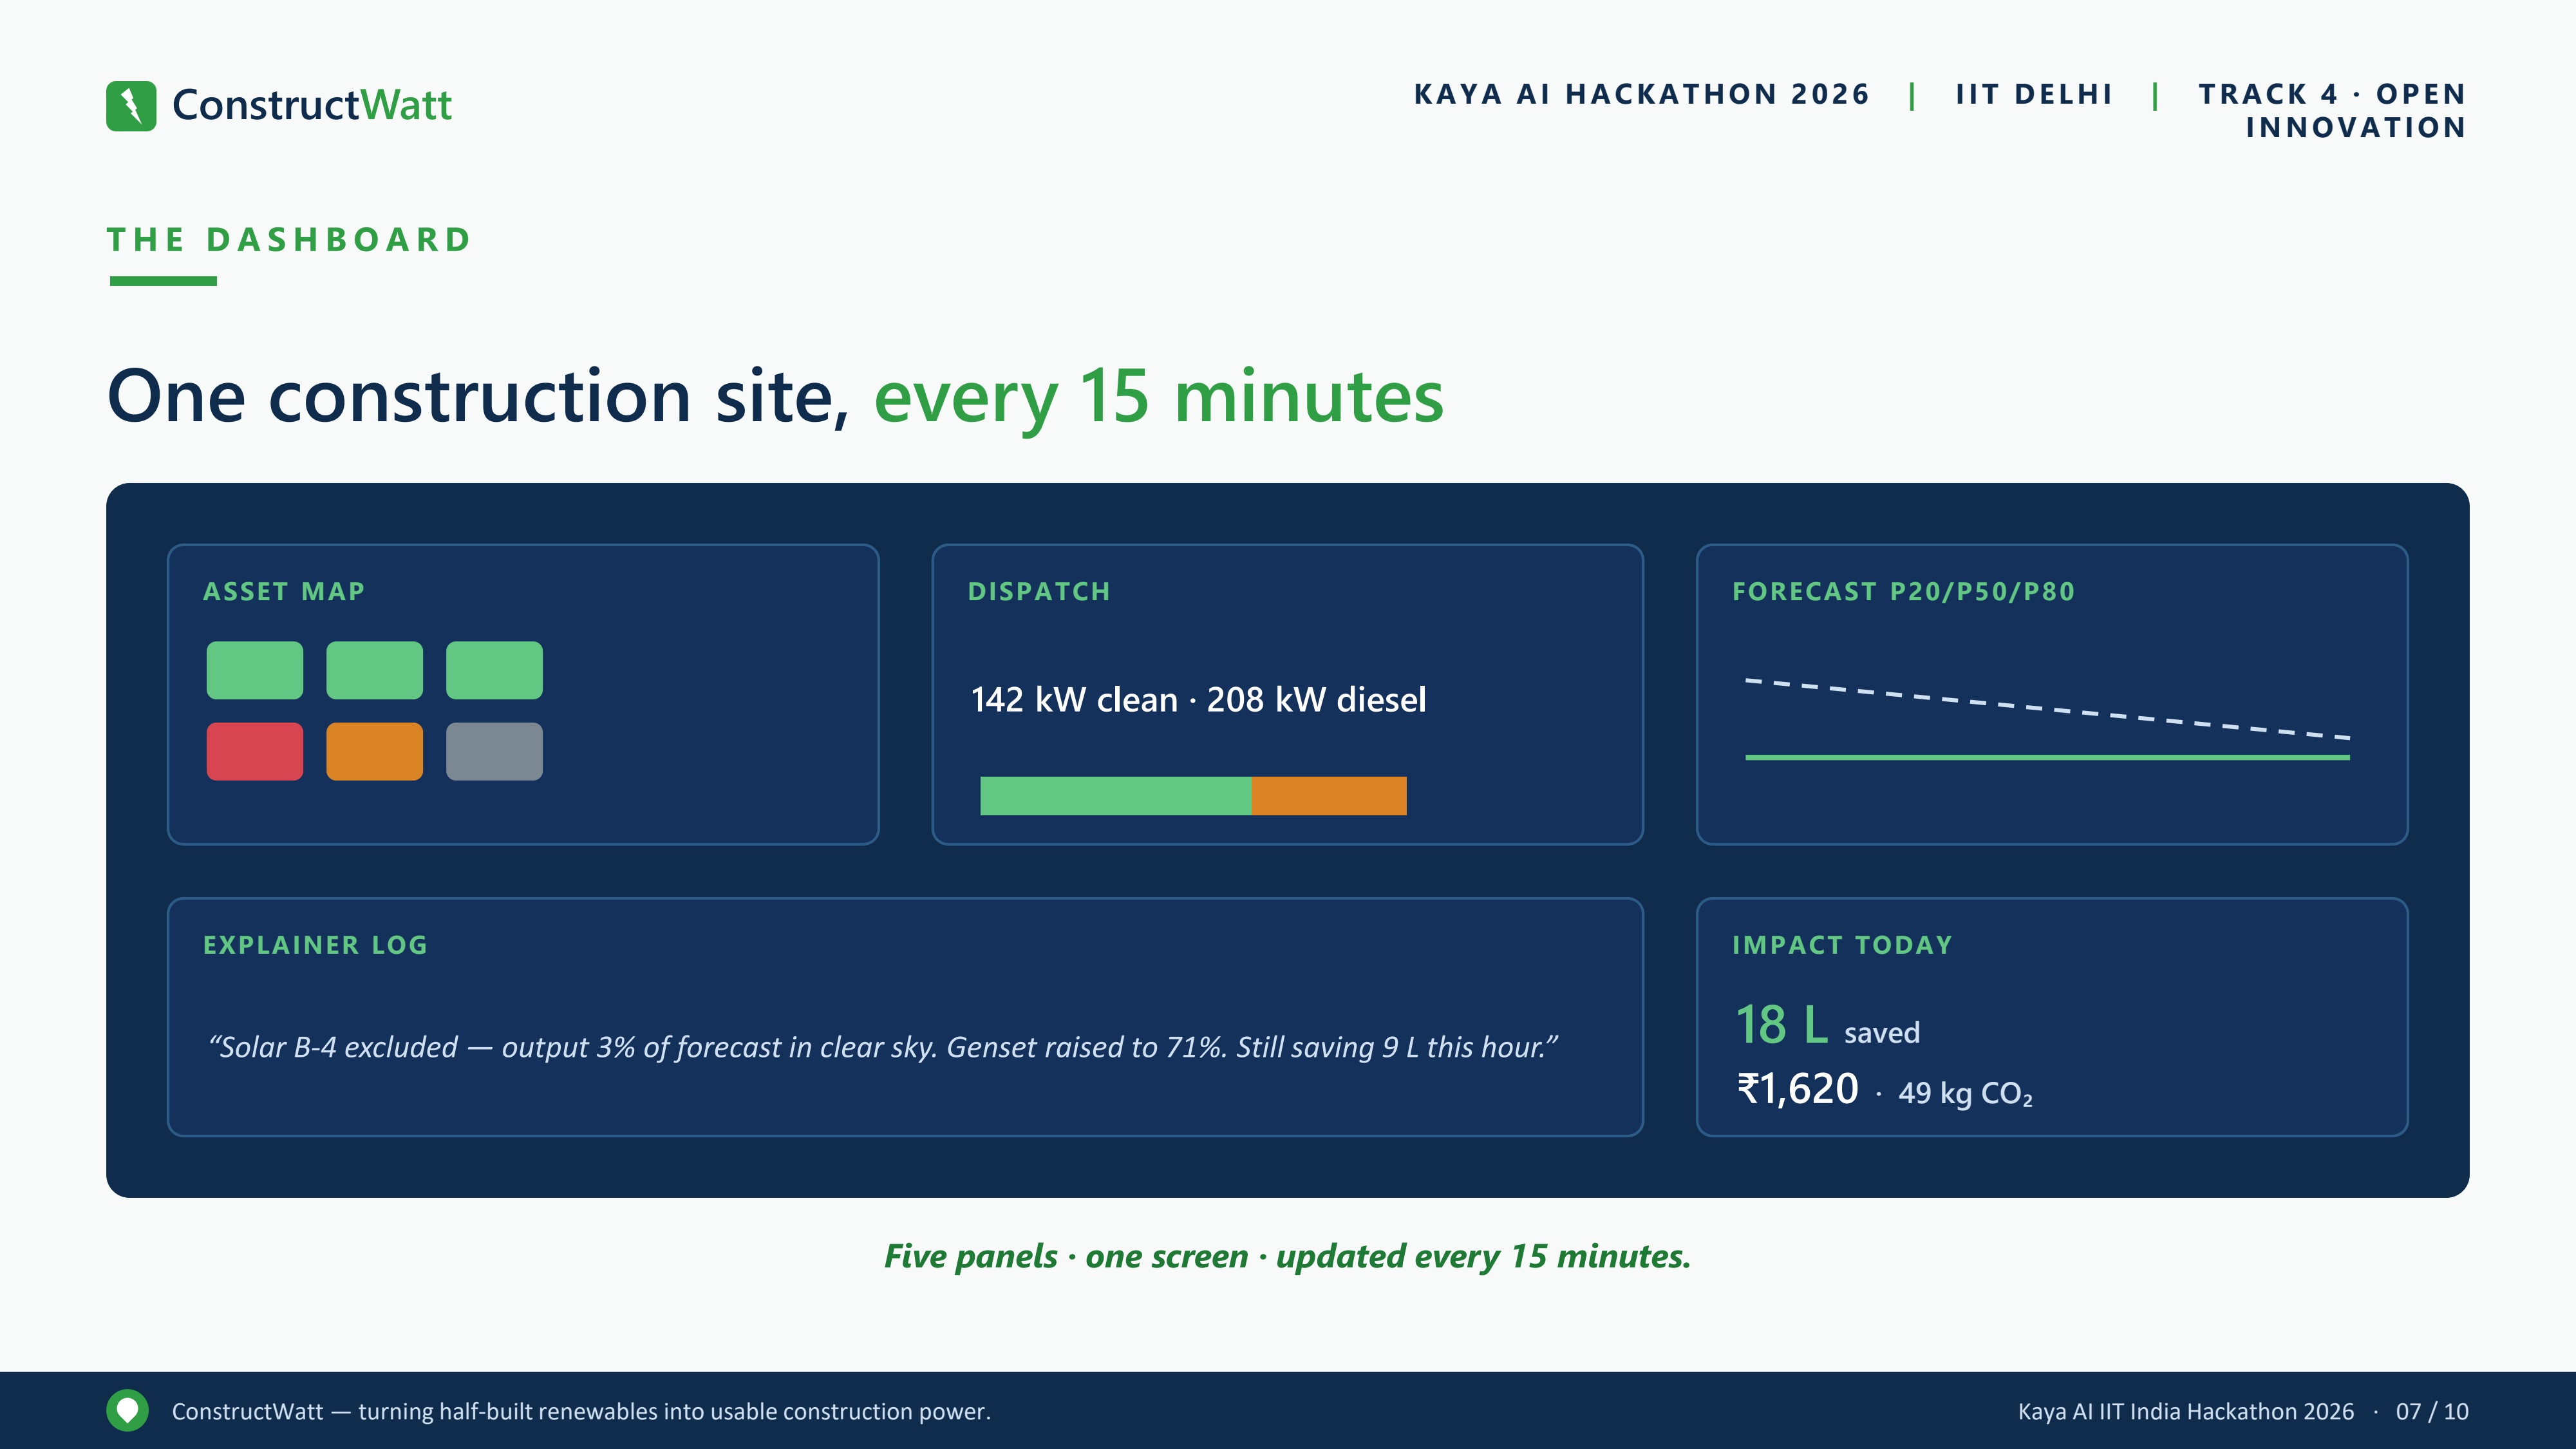
              Live dashboard (5 panels)  +  audit log
Stack: FastAPI + Redis · pvlib · filterpy (Kalman) · PuLP/CBC · scikit-learn · Claude API ·
React + Recharts frontend · Open-Meteo weather (free, no key). For Stage 1, telemetry is produced by a
synthetic generator using Rajasthan GHI profiles and Weibull wind; commissioning state is seeded from JSON.
5. Impact
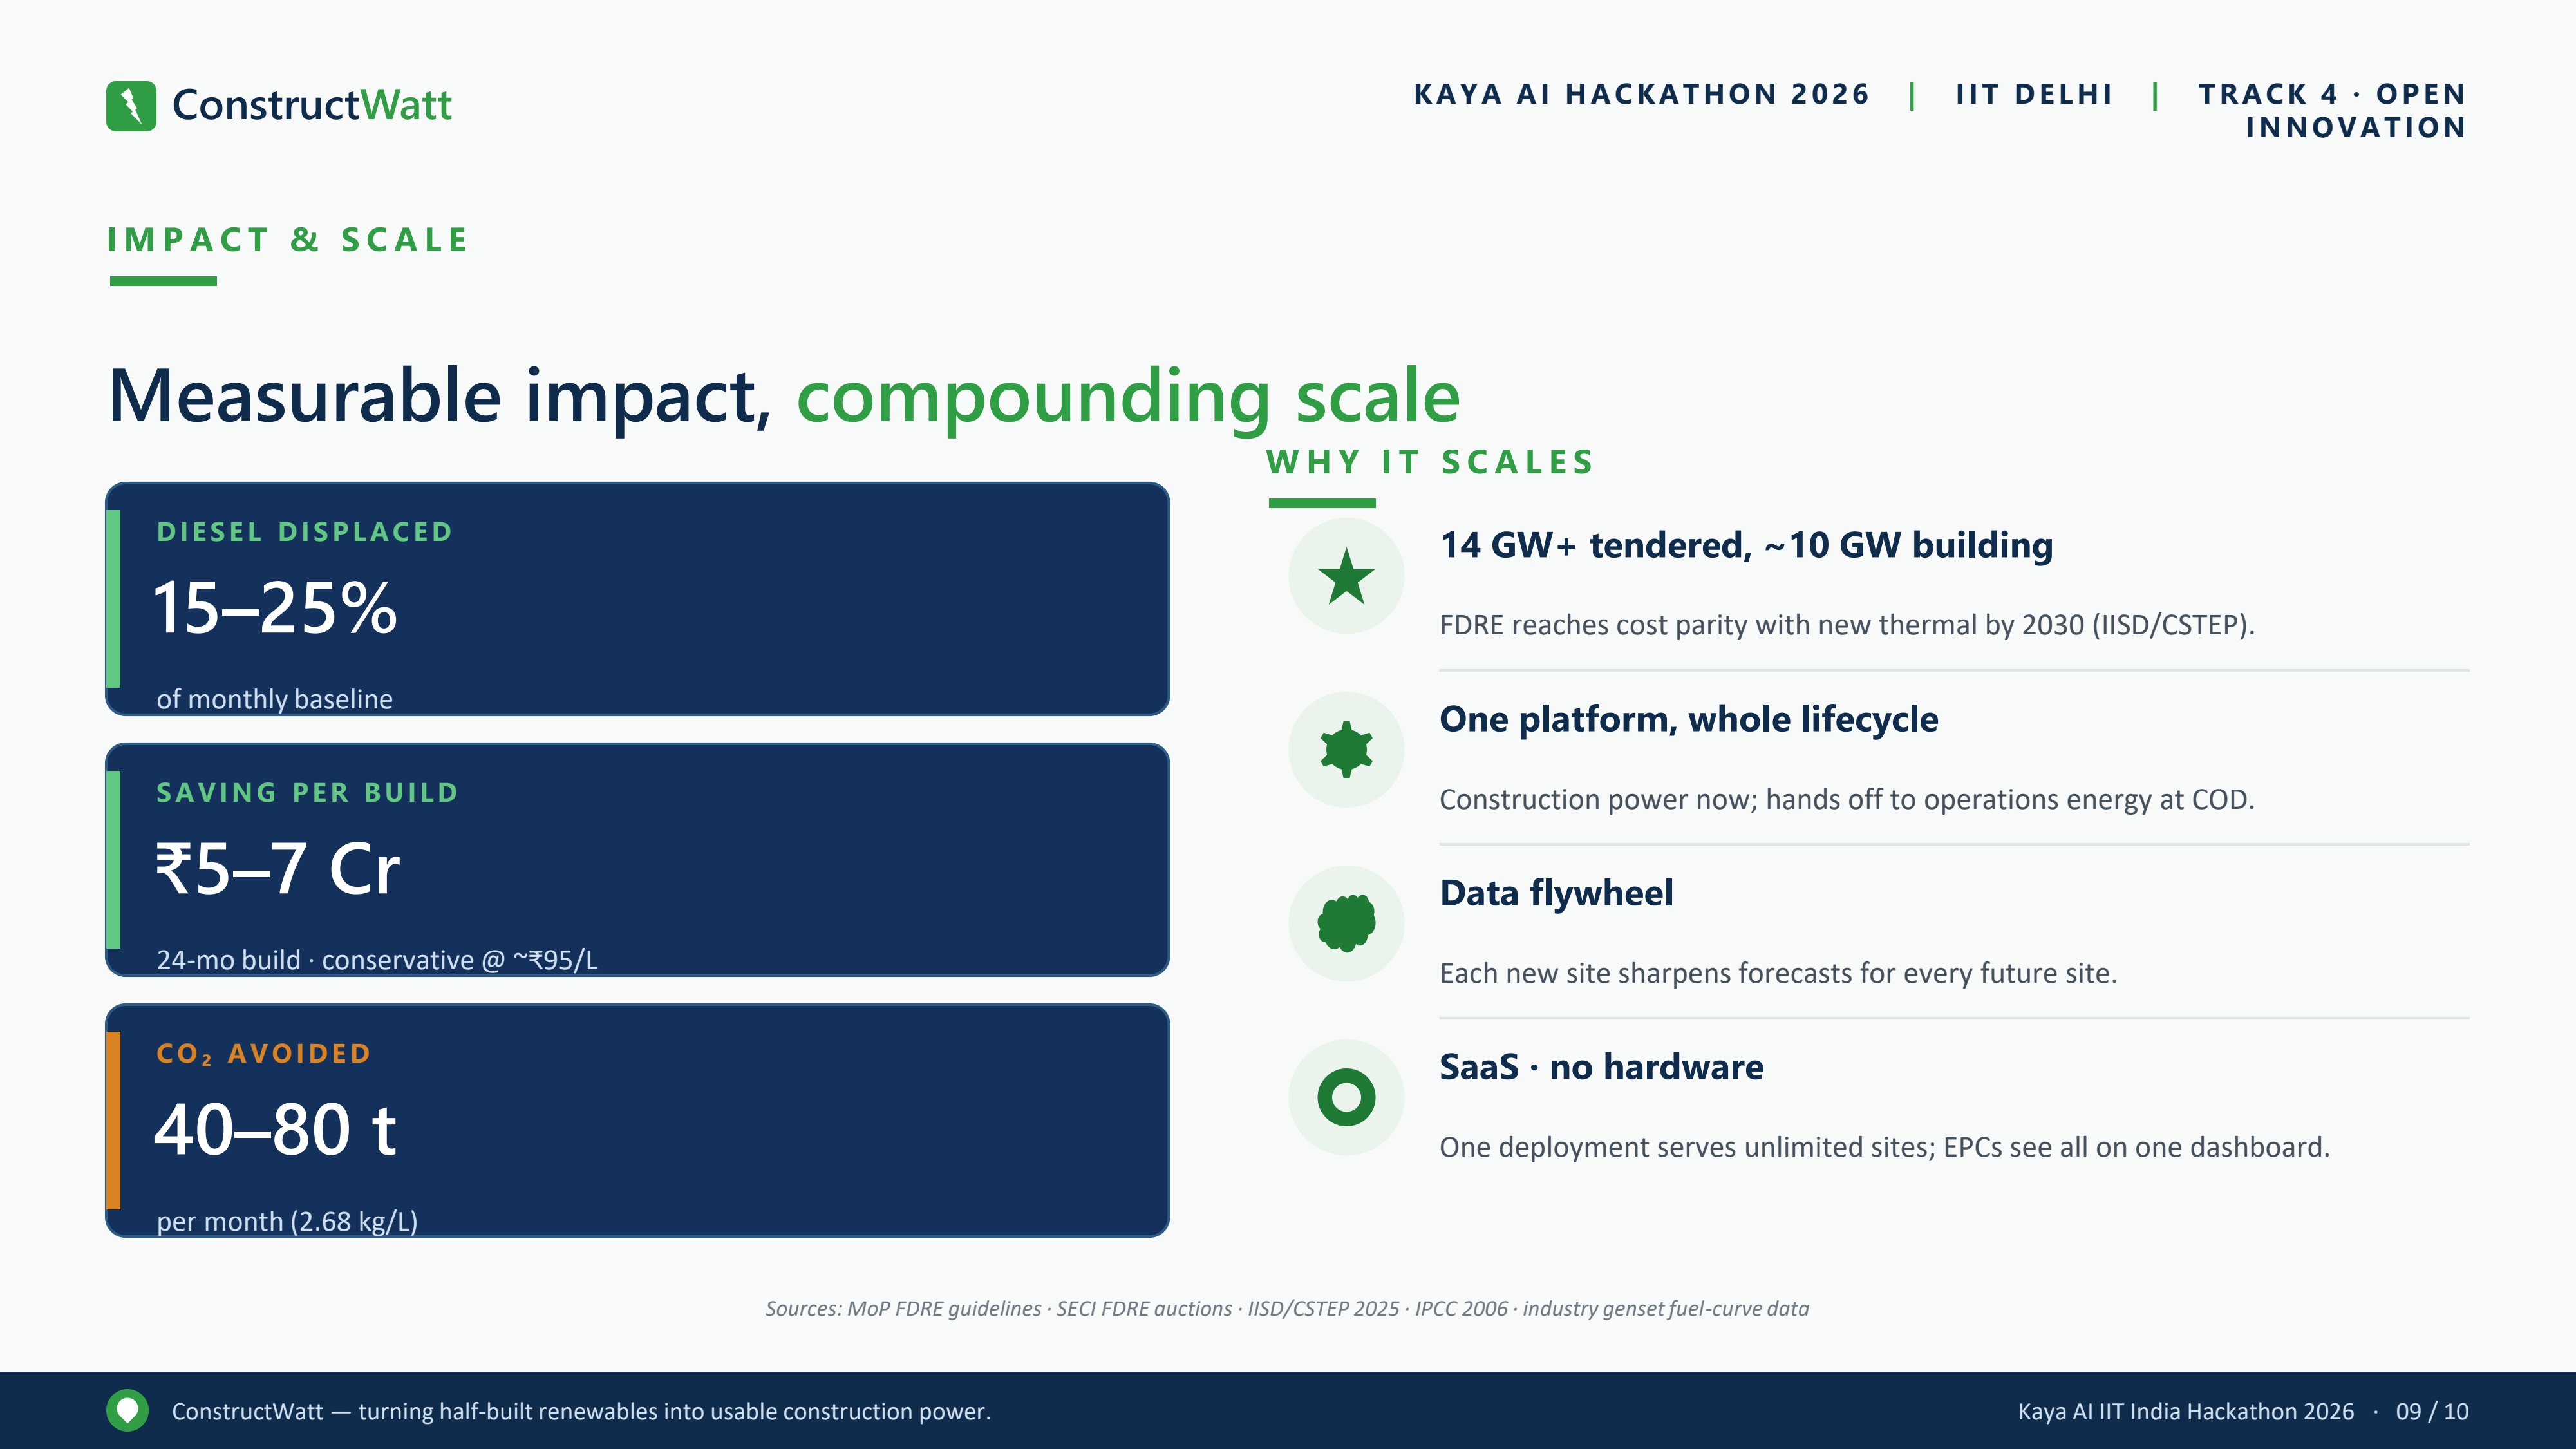
Per 500 kW site over a 24-month build (projected targets, not yet measured):
| Metric | Projected value | Basis |
|---|---|---|
| Diesel displaced | 15–25 % of monthly baseline | Share of hours renewables safely cover load |
| Cost saving | ₹5–7 Cr over the build | Displaced litres × ~₹95/L (conservative) |
| CO₂ avoided | 40–80 t / month | Displaced litres × 2.68 kg/L (IPCC 2006) |
Scalability. The SaaS layer serves unlimited sites from one deployment; a data flywheel means each new site sharpens forecasts for all future sites; and at COD the same platform hands off from construction-power management to operational energy management — one platform across the asset lifecycle.
6. Feasibility & Roadmap
- Stage 1 (this submission): working five-agent pipeline, MILP verified against hand-computed physics, synthetic-telemetry demo, live 5-panel dashboard with a scripted anomaly self-heal.
- Phase 2: RAG over real commissioning PDFs (IEC 62446 / 61400) via ChromaDB; live Open-Meteo feed; battery co-optimisation.
- Phase 3: multi-site portfolio view for EPCs; Bayesian site-calibration; COD transition reporting.
7. Team
Raghav Goel · Ashmit Singh · Vijay Gupta
IIT Delhi — Department of Energy Science & Engineering.
References
- Ministry of Power, Govt. of India — FDRE Guidelines (June 2023).
- pv-magazine India (Apr 2026) — India's first FDRE project (Juniper Green Energy) enters commissioning.
- IISD / CSTEP (2025) — Budgeting for Net Zero: Powering India's Reliable Clean Energy Future (FDRE cost parity by 2030).
- Energy-Storage.News — India FDRE tenders (SJVN, NHPC, SECI, NTPC), 14 GW+.
- IPCC (2006) — Guidelines for National GHG Inventories, Vol. 2 (Energy) — diesel CO₂ factor 2.68 kg/L.
- IEC 62446 (grid-connected PV commissioning) · IEC 61400 (wind turbine design & commissioning).
- Statista (2020) — India construction & mining diesel consumption (~3.5 billion L/yr).
Built With
- anthropic-claude
- cbc-solver
- chromadb
- docker
- fastapi
- filterpy
- modbus-tcp
- mqtt
- numpy
- open-meteo
- pandas
- postgresql
- pulp
- pvlib
- python
- react
- recharts
- redis
- scikit-learn
- uvicorn
