Inspiration
Rowdy Datathon 2022!!
What it does
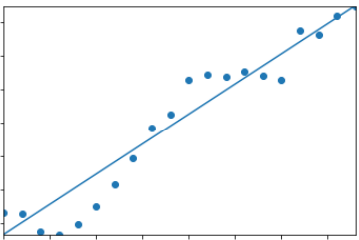
Takes in the truncated 1969-1986 natality dataset, counts up all the underweight babies for each year, plot them, then draws the linear regression for them.
How we built it
The linear regression model is found by checking every pair of m and k such that the line y = mx + k has the least total error between all points.
Challenges we ran into
Importing the data, understanding the data, working with pyplot and panda, drawing from y = mx + k while accounting for the offset, finding the min and max for m, fixing the overflow on the total error calculation caused by the offset, fixing the alignment issue on total error calculation from the offset.
Accomplishments that we're proud of
Making a result within 3 hours by myself.
What we learned
How to use spyder, how to plot, how to import big data, to learn and understand the math before implementing an algorithm.
What's next for Consistency of Birth Analysis Test
Fix the many issues and clean the code.
Built With
- python
- spyder

Log in or sign up for Devpost to join the conversation.