-
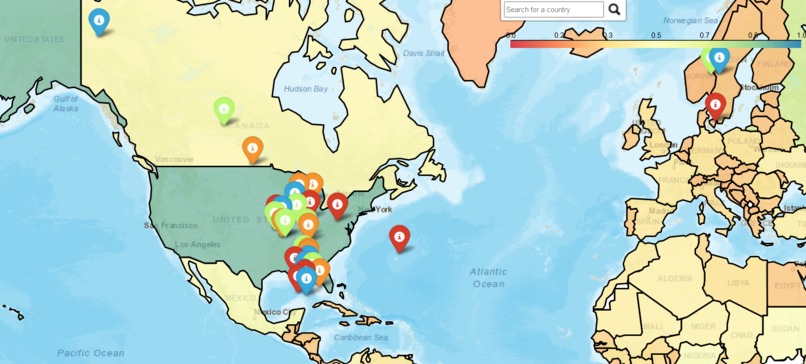
Set of pins representing Conoco-Phillips sustainability projects
-
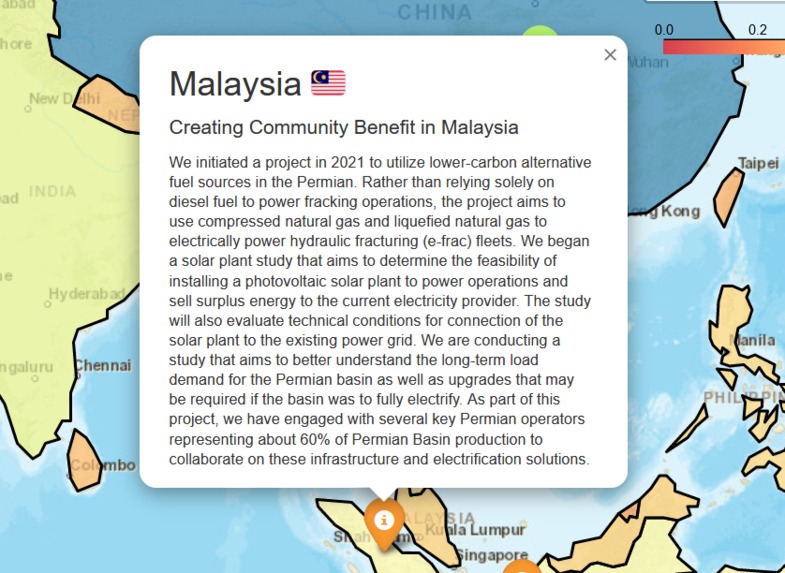
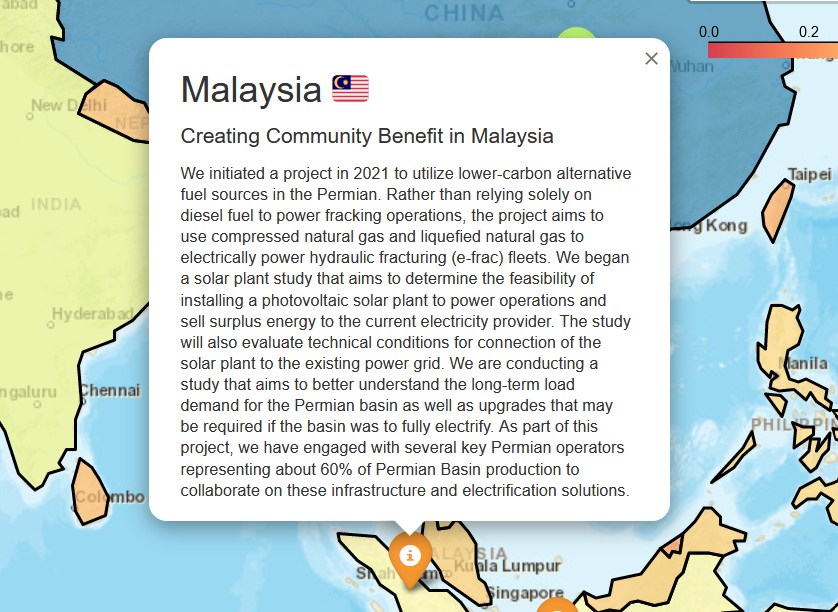
Description of Sustainability projects and where they are primarily located
-
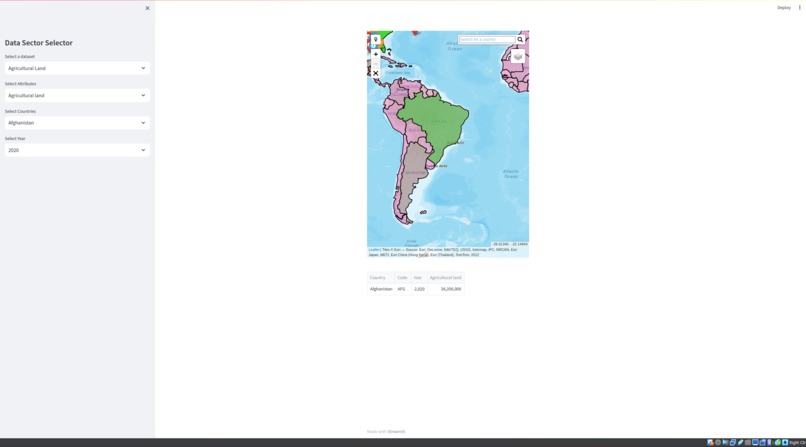
The program running in streamlit

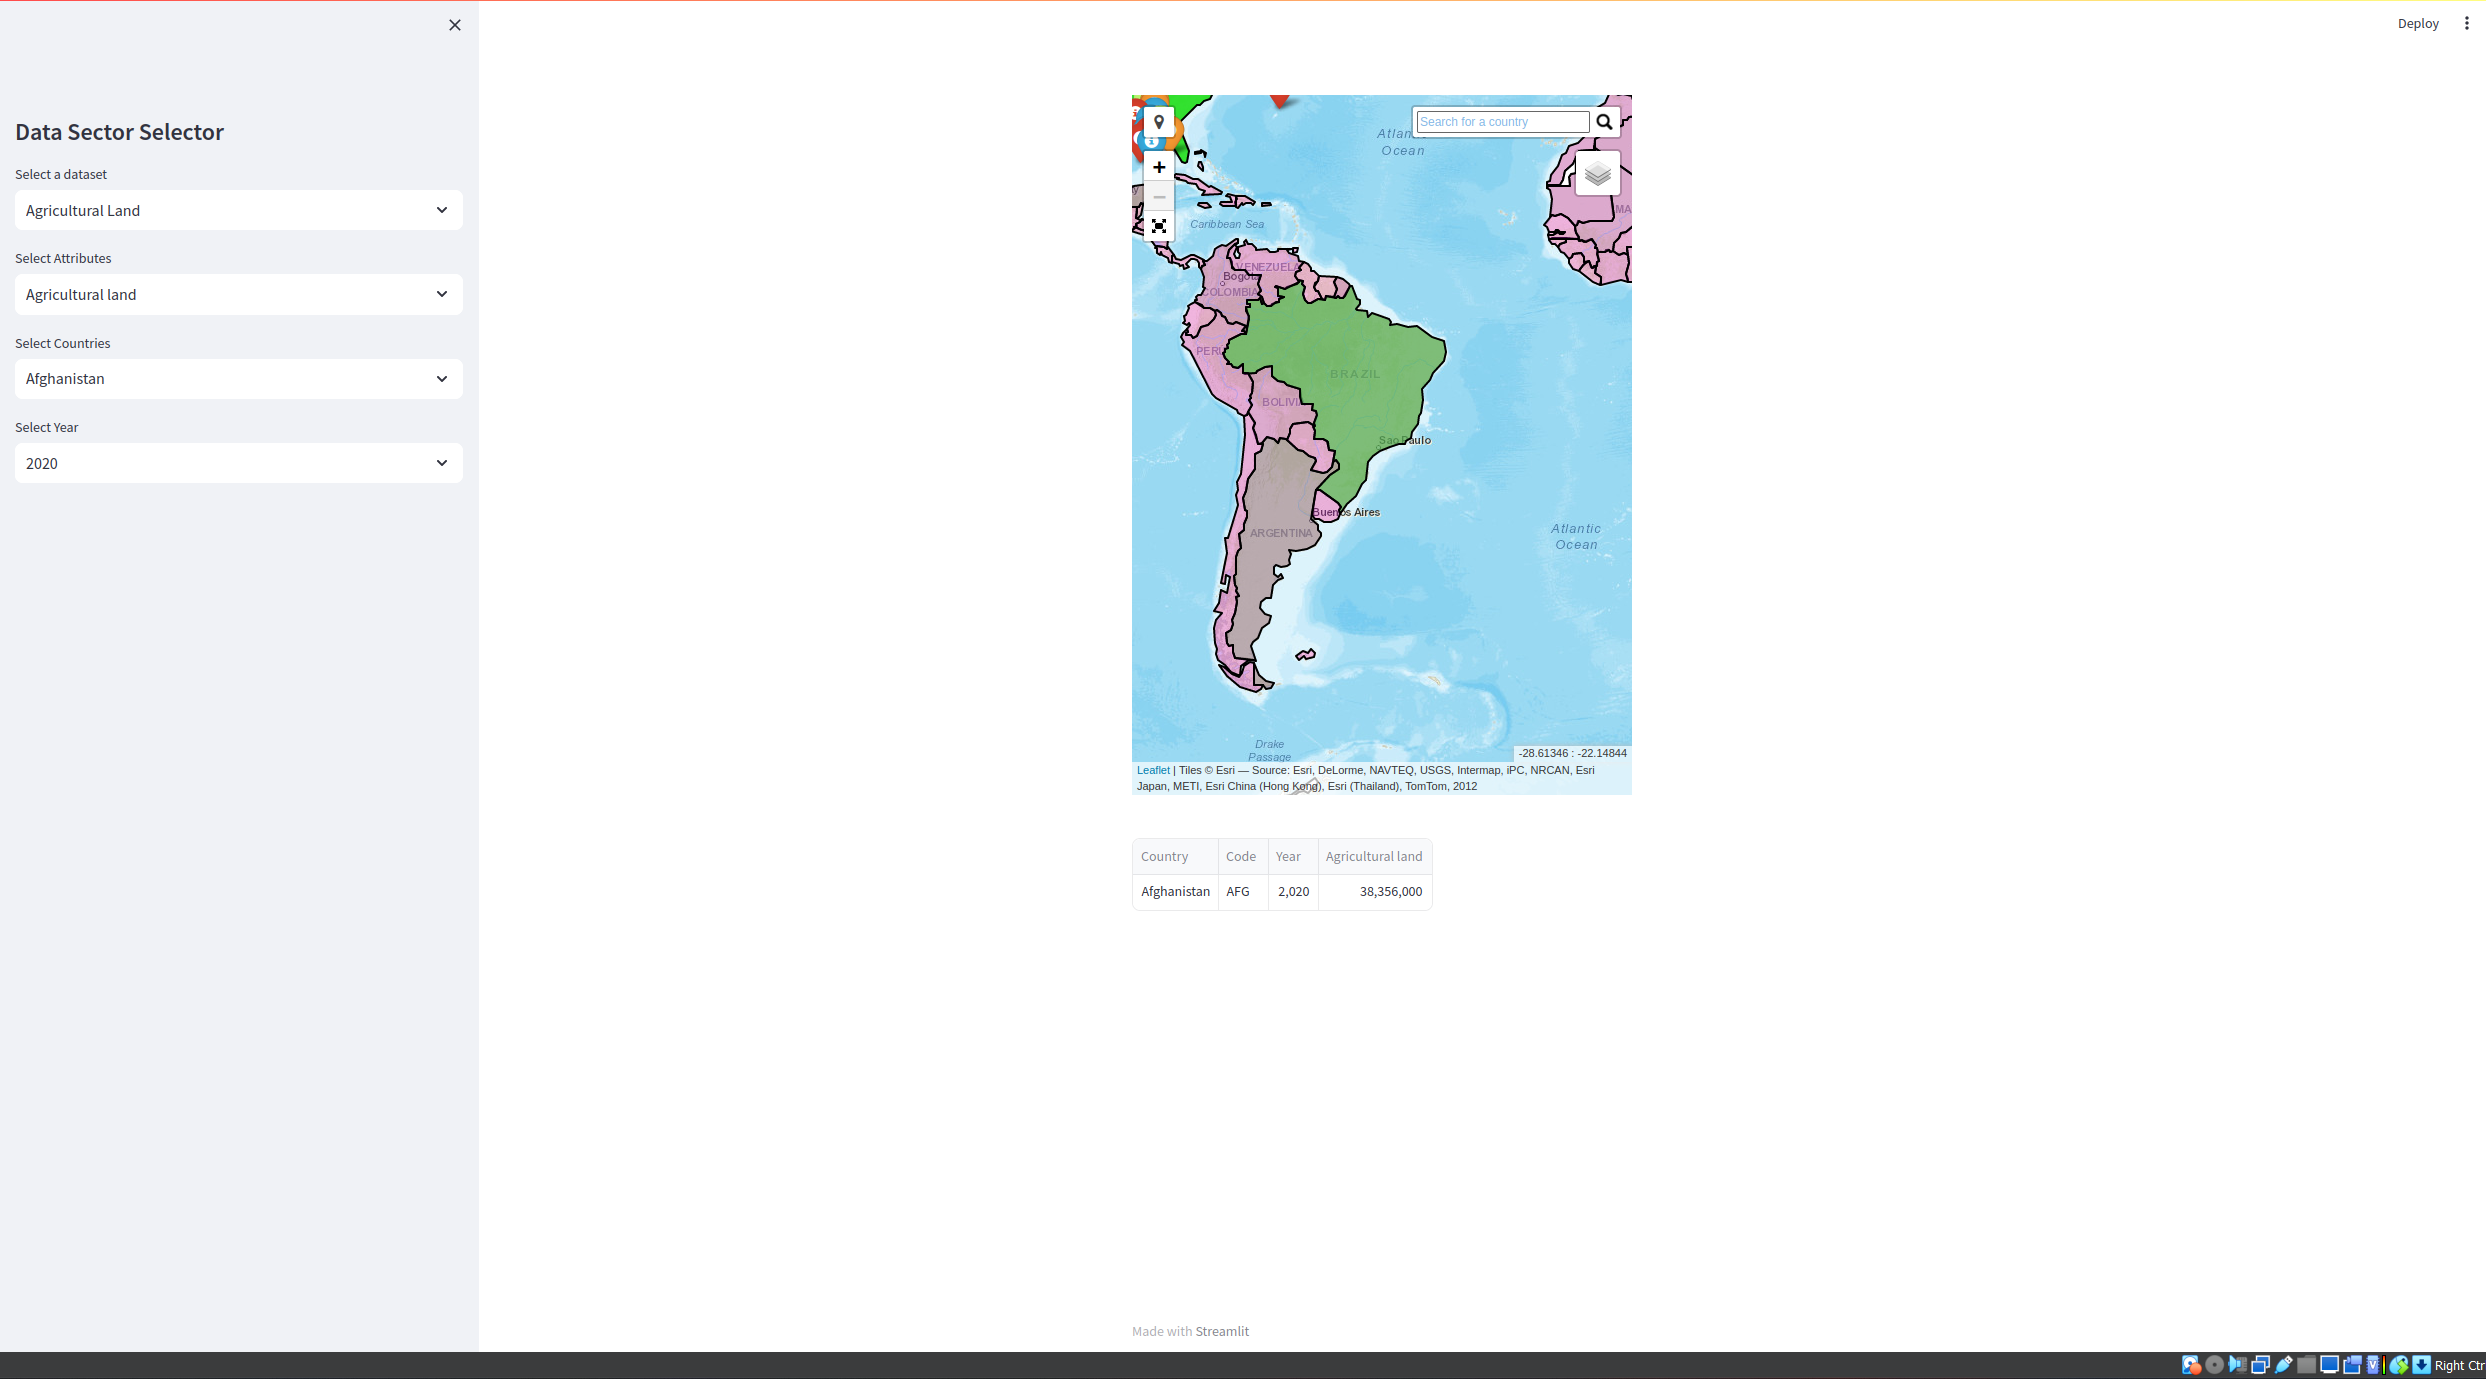
Inspiration
We saw that Conoco-Phillips was engaged in a wide variety of sustainability-focused efforts, and decided it would be helpful if there was a way to easily track where sustainability efforts were being performed and the state that the area is in, so that resources can be mobilized quickly and effectively
What it does
It is a user-friendly display to easily parse expansive sets of data points relating to environmental sustainability over time and show areas that need improvement. It presents this data as both colored areas corresponding to continents and countries, and as various gauges and bars.
How we built it
In general, the development was a two-pronged converging mission once the datasets were found. On the back-end, Umar used Python and database libraries to quickly develop an extensive database. On the front-end, Zach used the Folium python package to create a dynamic and interactive map. Both then worked to parse and filter data to convey the plethora of data points in a manageable format through streamlit, as well as hosting it on there. Kyle provided ideas and feedback, in addition to formatting certain datapoints into a friendlier format.
Challenges we ran into
Originally, we tried making the map a 3D model, but due to it being made in HTML, we found limitations that prevented us from integrating what we wanted to integrate. Additionally, due to the variety of the data sets and how they were formatted, we regularly ran into issues regarding formatting and the sheer quantity of data.
Accomplishments that we're proud of
It would be a lie to say that we aren't proud of having anything at all. More seriously, we're proud to have created a system that can feasibly scale with the amount of data we've collected while also presenting it in a way many users can understand.
What we learned
Between all three of us, we're proud to have learned more about Python and database management. Umar learned to always bring a sweater to a hackathon, and that sometimes it's good to start from a clean slate to get a fresh perspective. Zach learned the importance of teamwork, responsibility, and good sleeping habits. Kyle learned how to use plugins for his IDE, in addition to learning about just how much Python can do and how much he'll be expected to do in a professional environment.
What's next for Conoco-Phillips Interactive Sustainability Map
In addition to regular quality of life improvements, we would like to integrate more datasets that we didn't have time for, as well as provide the ability for uers to add their own datasets. We would also like to add ChatGPT and AI integration to recommend actions to take for areas that are not sustainable.
Log in or sign up for Devpost to join the conversation.