-
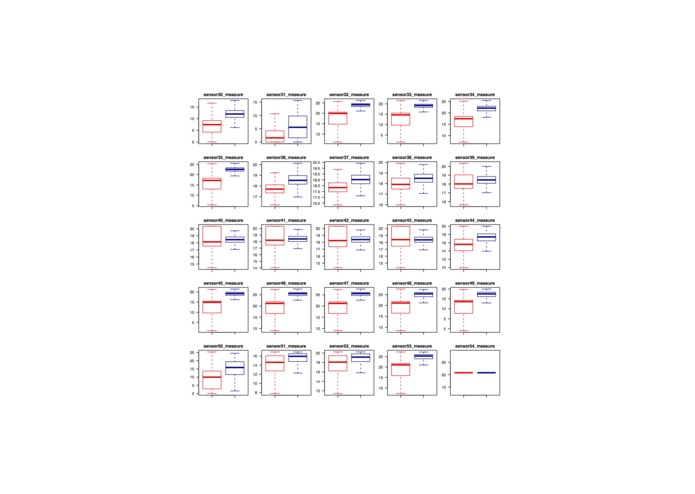
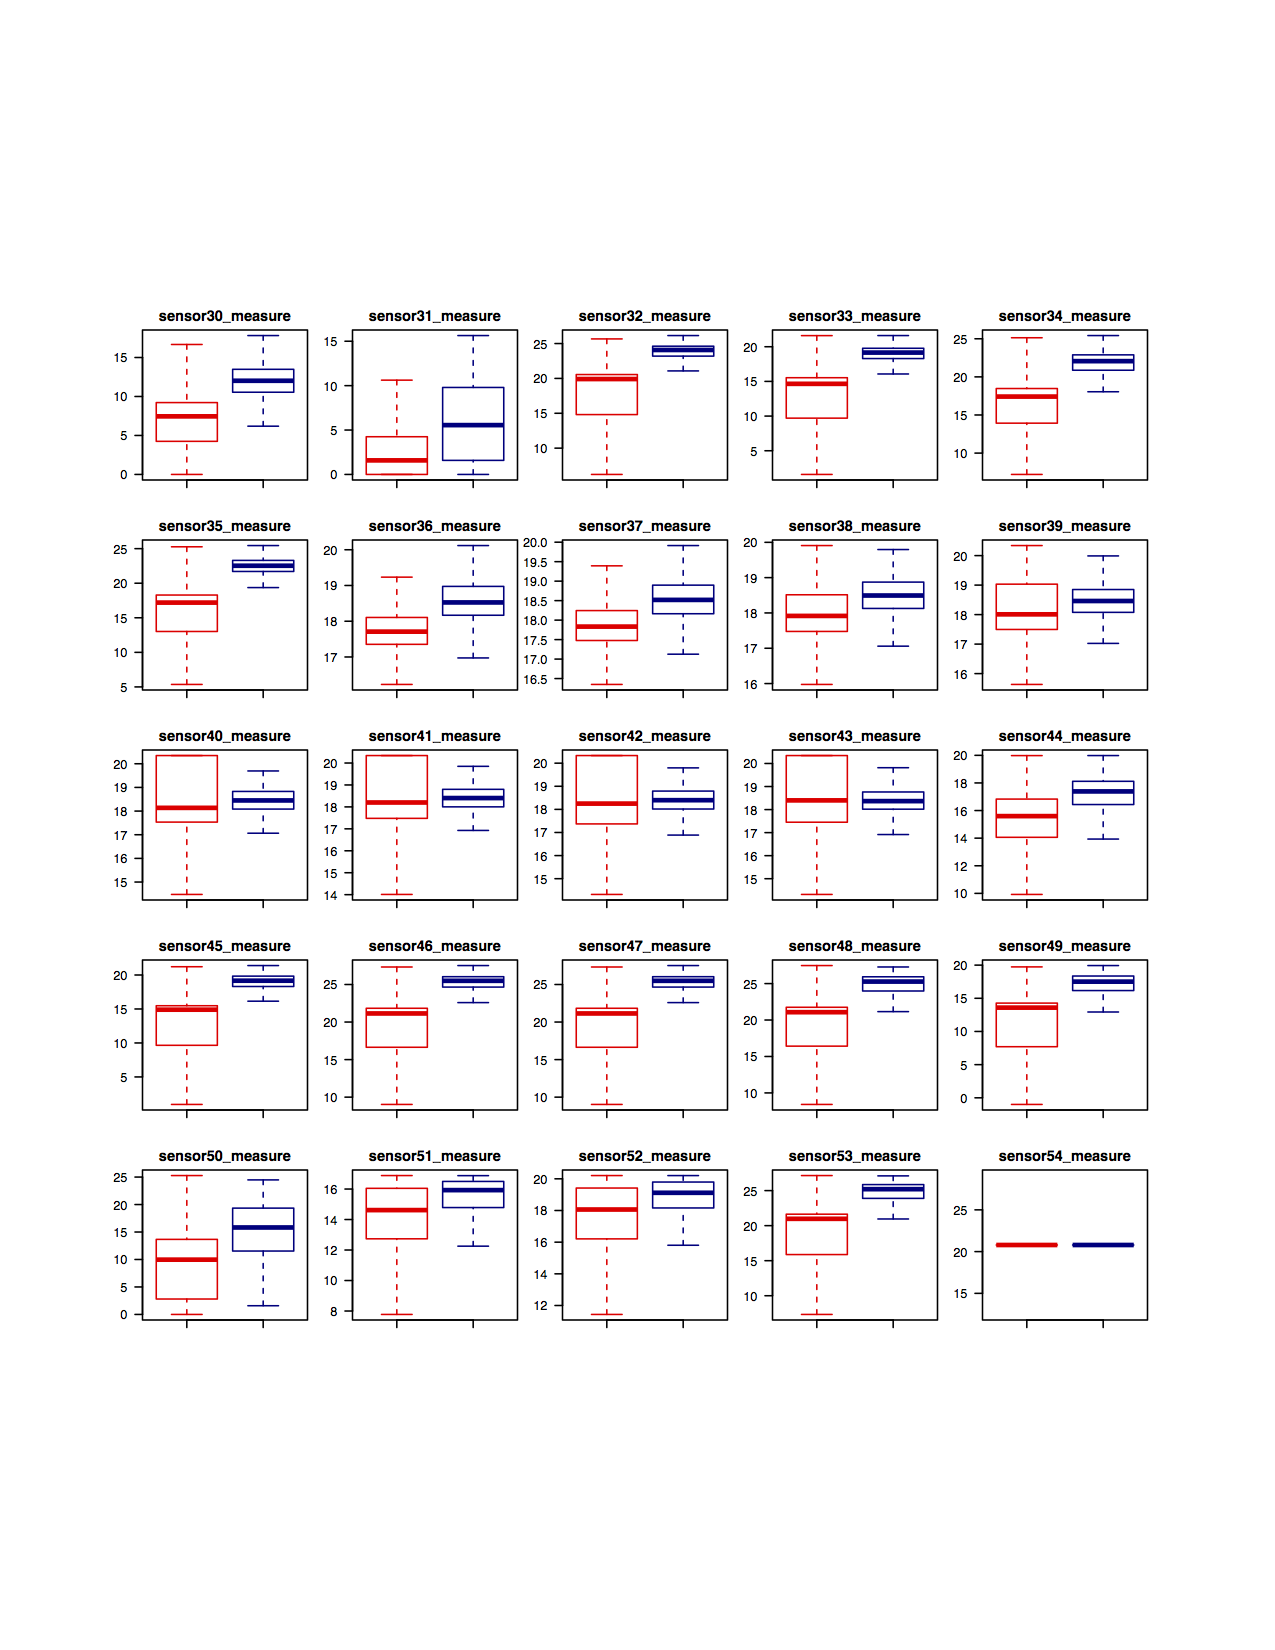
part of the test display
Inspiration
In the raw data,there is bunch of zero ,which may be important. And whole training data set category to failure and success 2 groups.
What it does
I class the None and number by target label,then perform test to see whether this pairs has significant different.
How I built it
use logic test and loop to category, slightly shift the whole population in order to show zero in the plot.Because the maximum is much larger than zero,I just take log to make it possible to show on the same axis.
Challenges I ran into
As a new statistics student ,this size of the data is my first time to touch. The way that this data display is by frequency which I never process before. Majority of my code I learnt from class is the first time to use it in the real world.
Accomplishments that I'm proud of
During 24 hours I can put all small parts of my code together and run successfully. And I start to have new understanding about how to find feature. I guess this is the very beginning and crucial step for marching learning.
What I learned
I learned how to process data like zero and na. And how to find feature.
What's next for Conoco Phillips
Base the thing I've learnt,I may not perform more analysis.I think I should conclude a more simple result and test on test data set,to know whether the feature I found is aa good one.

Log in or sign up for Devpost to join the conversation.