-
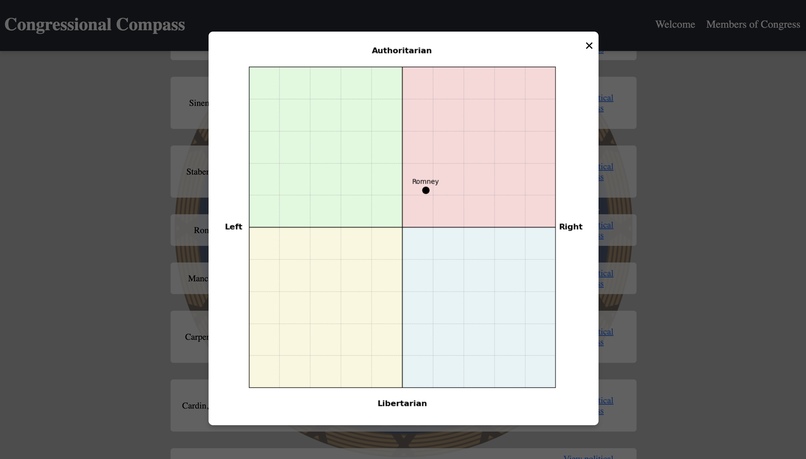
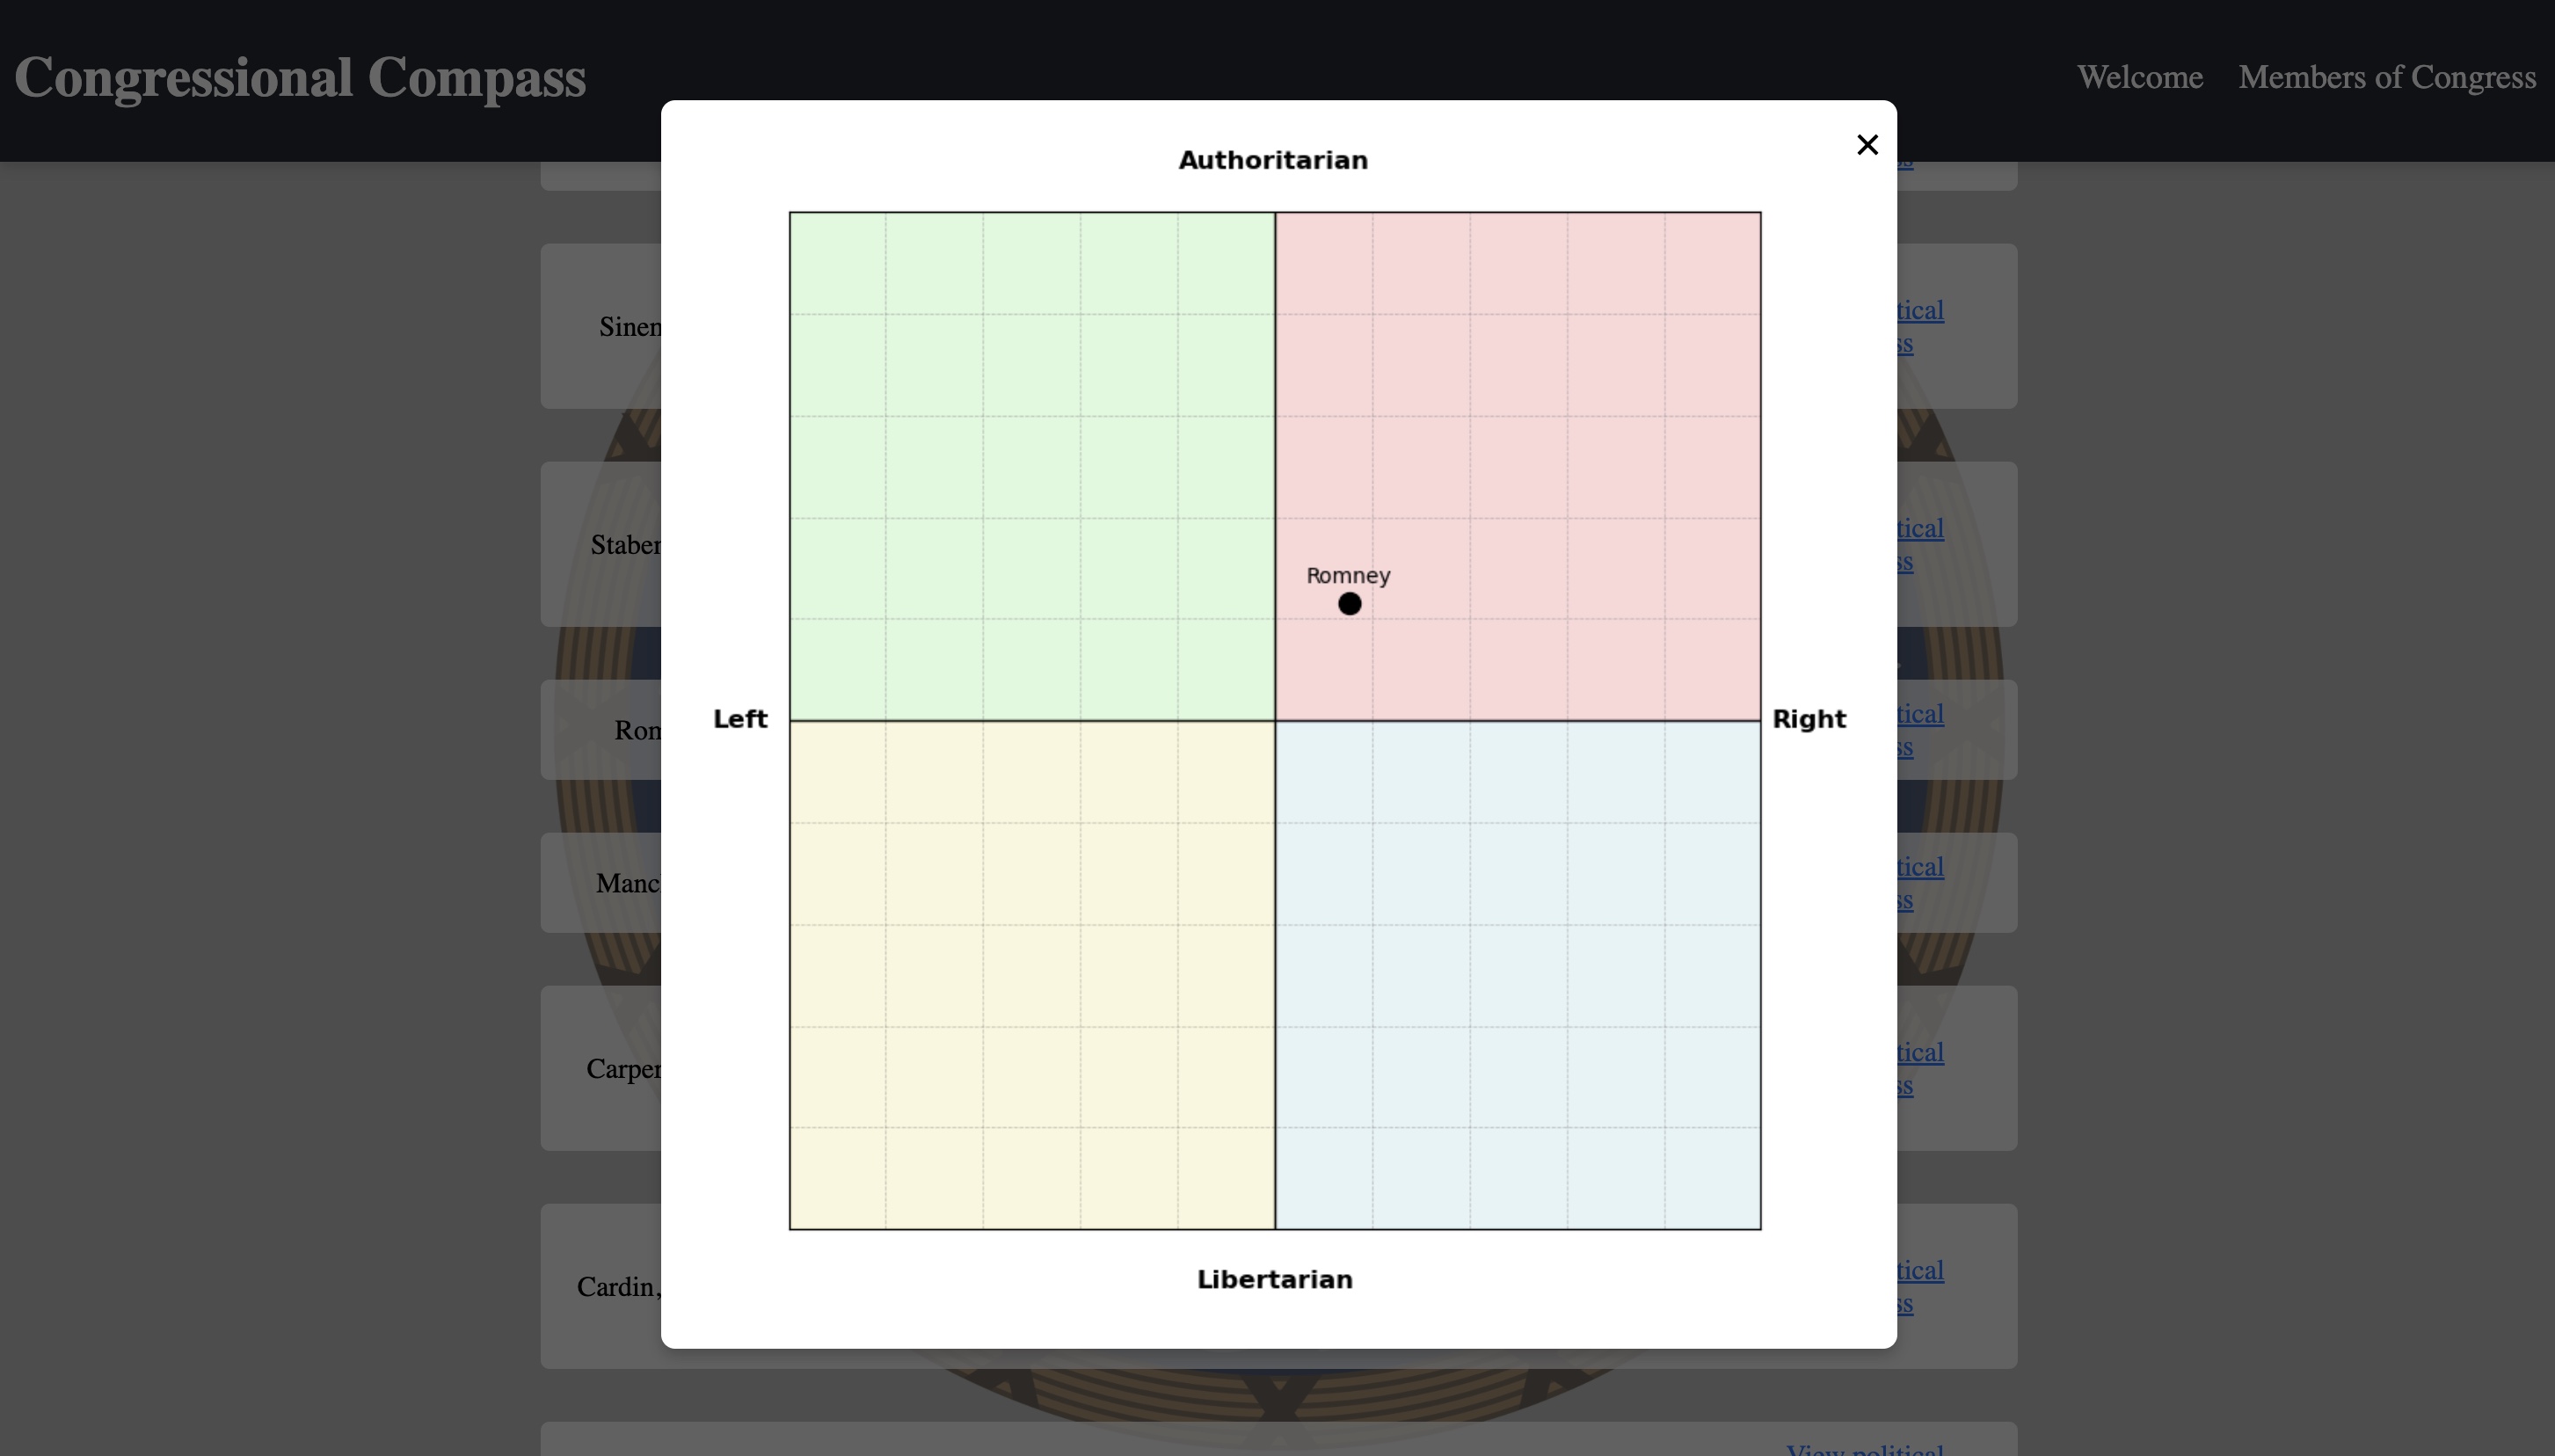
Example of generated political compass for Mitt Romney
-

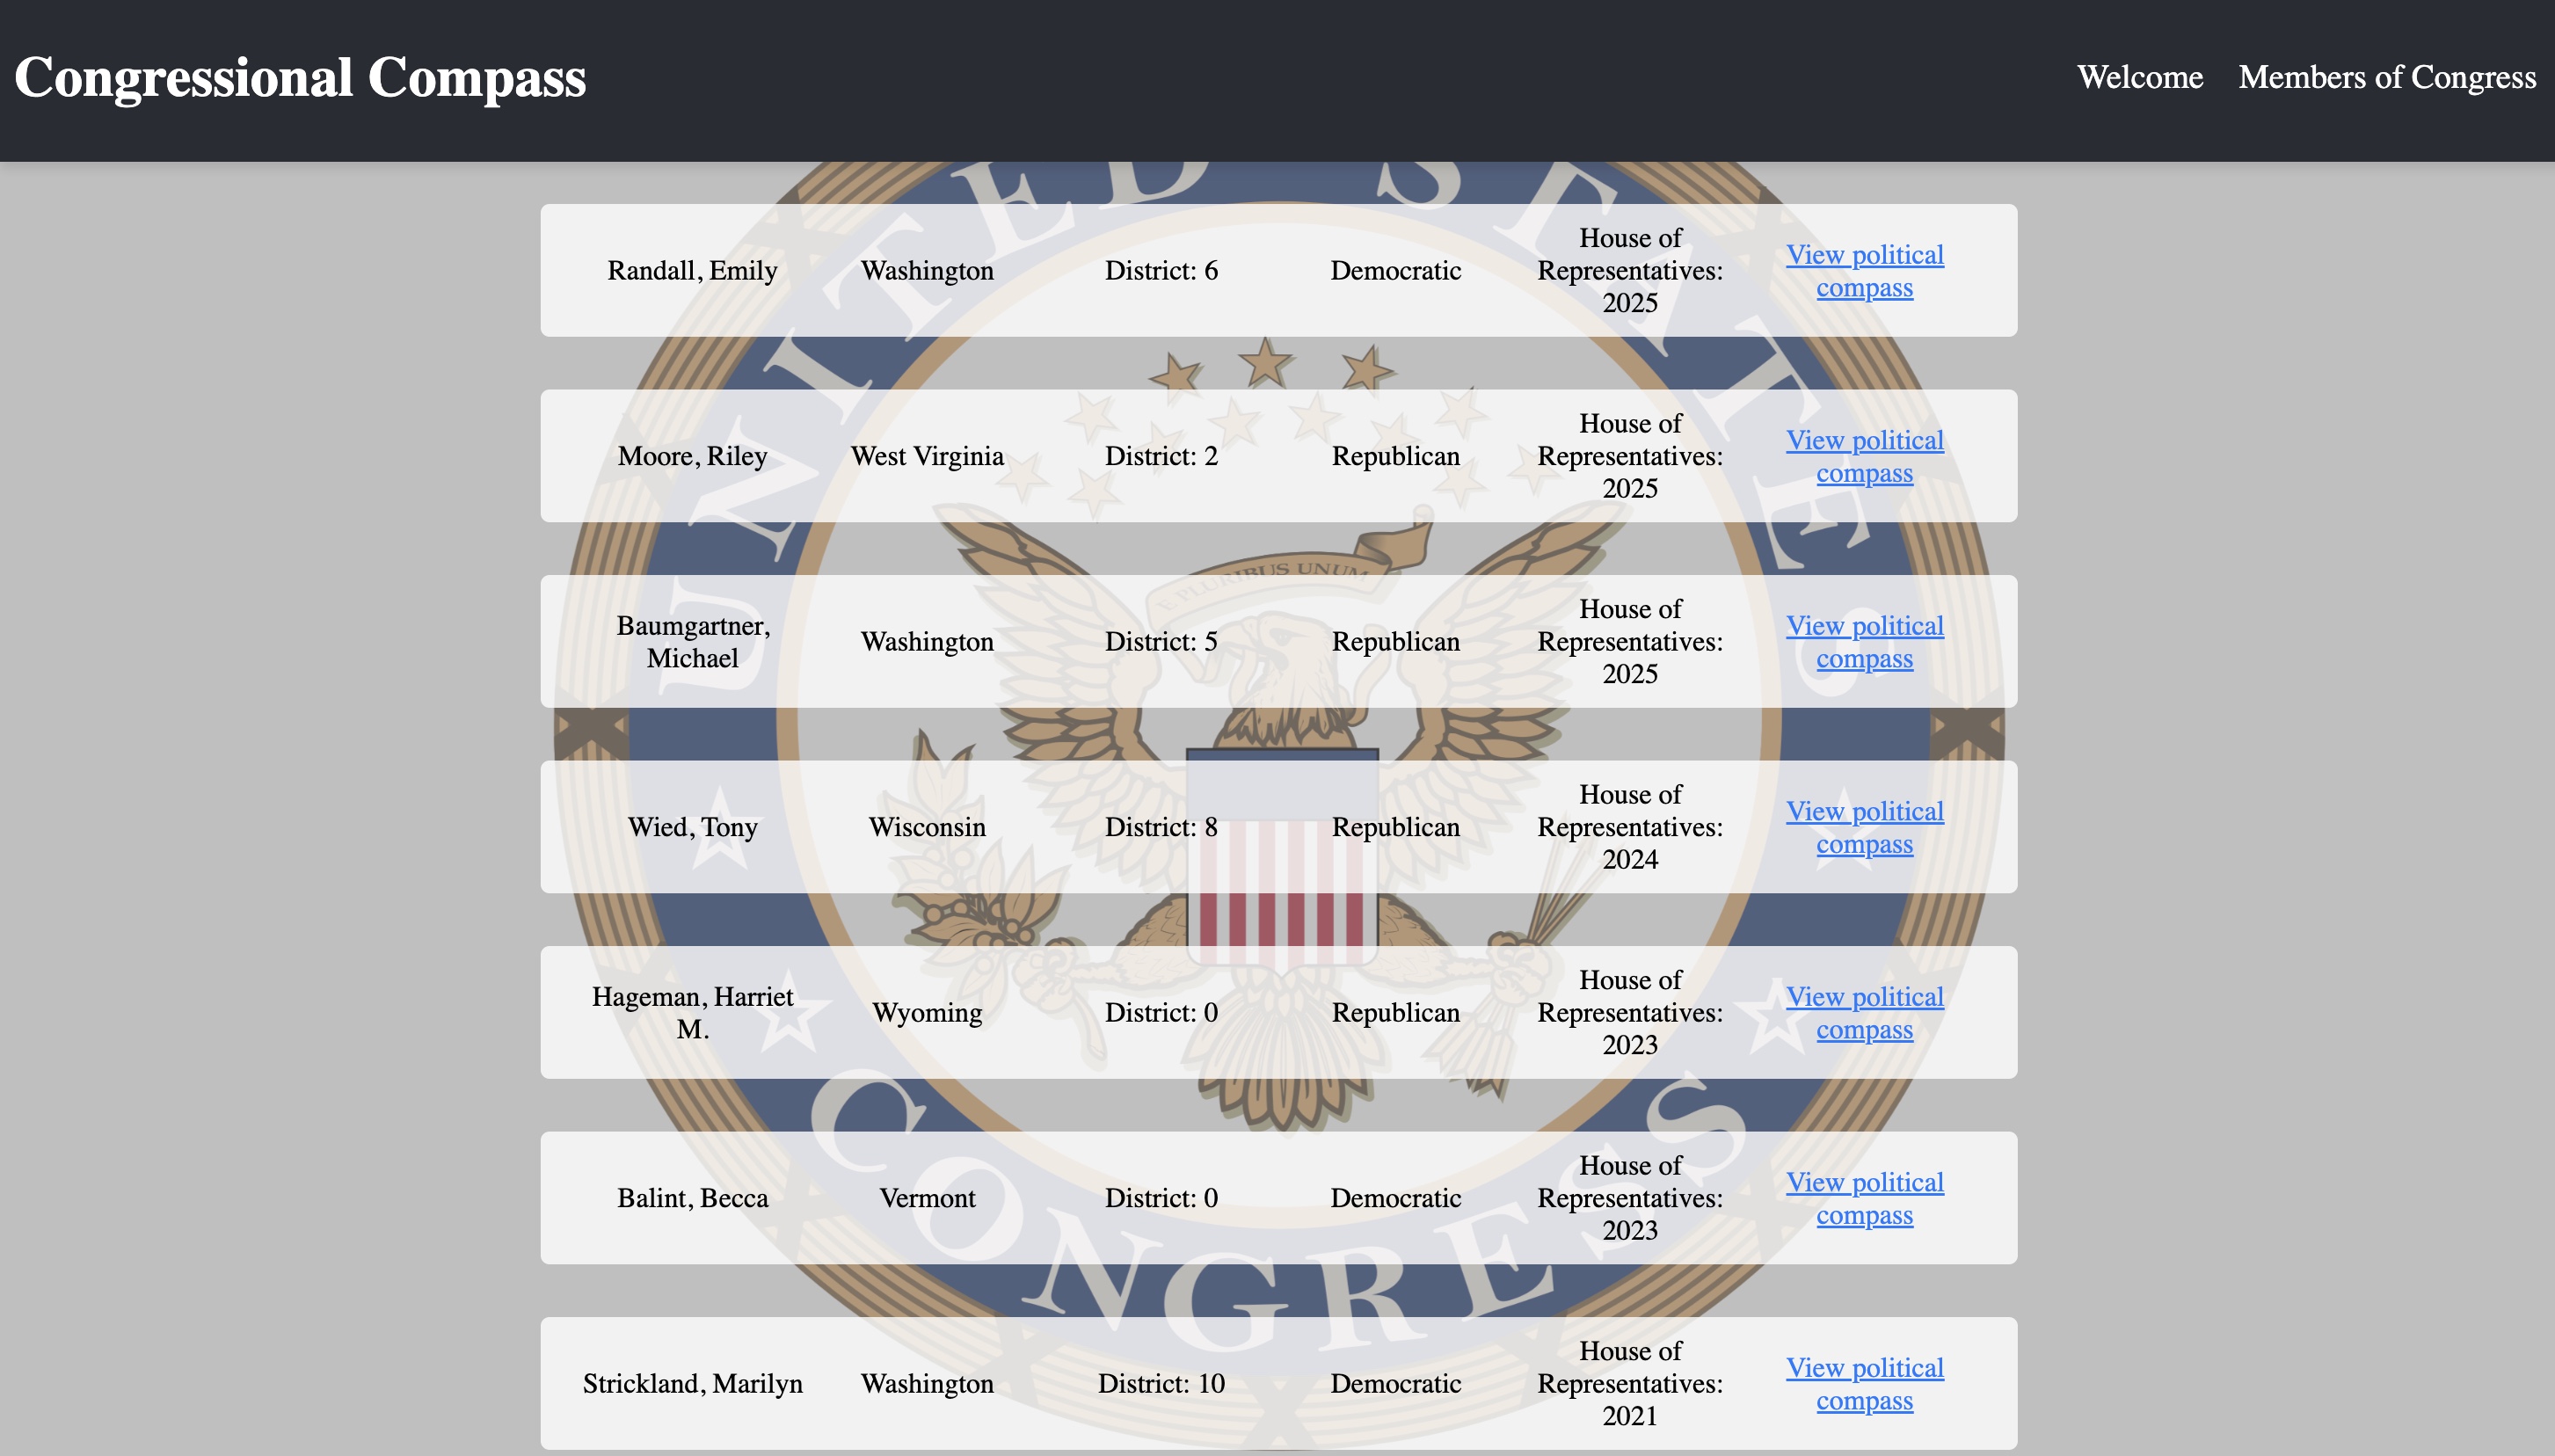
View of members of congress page.
-
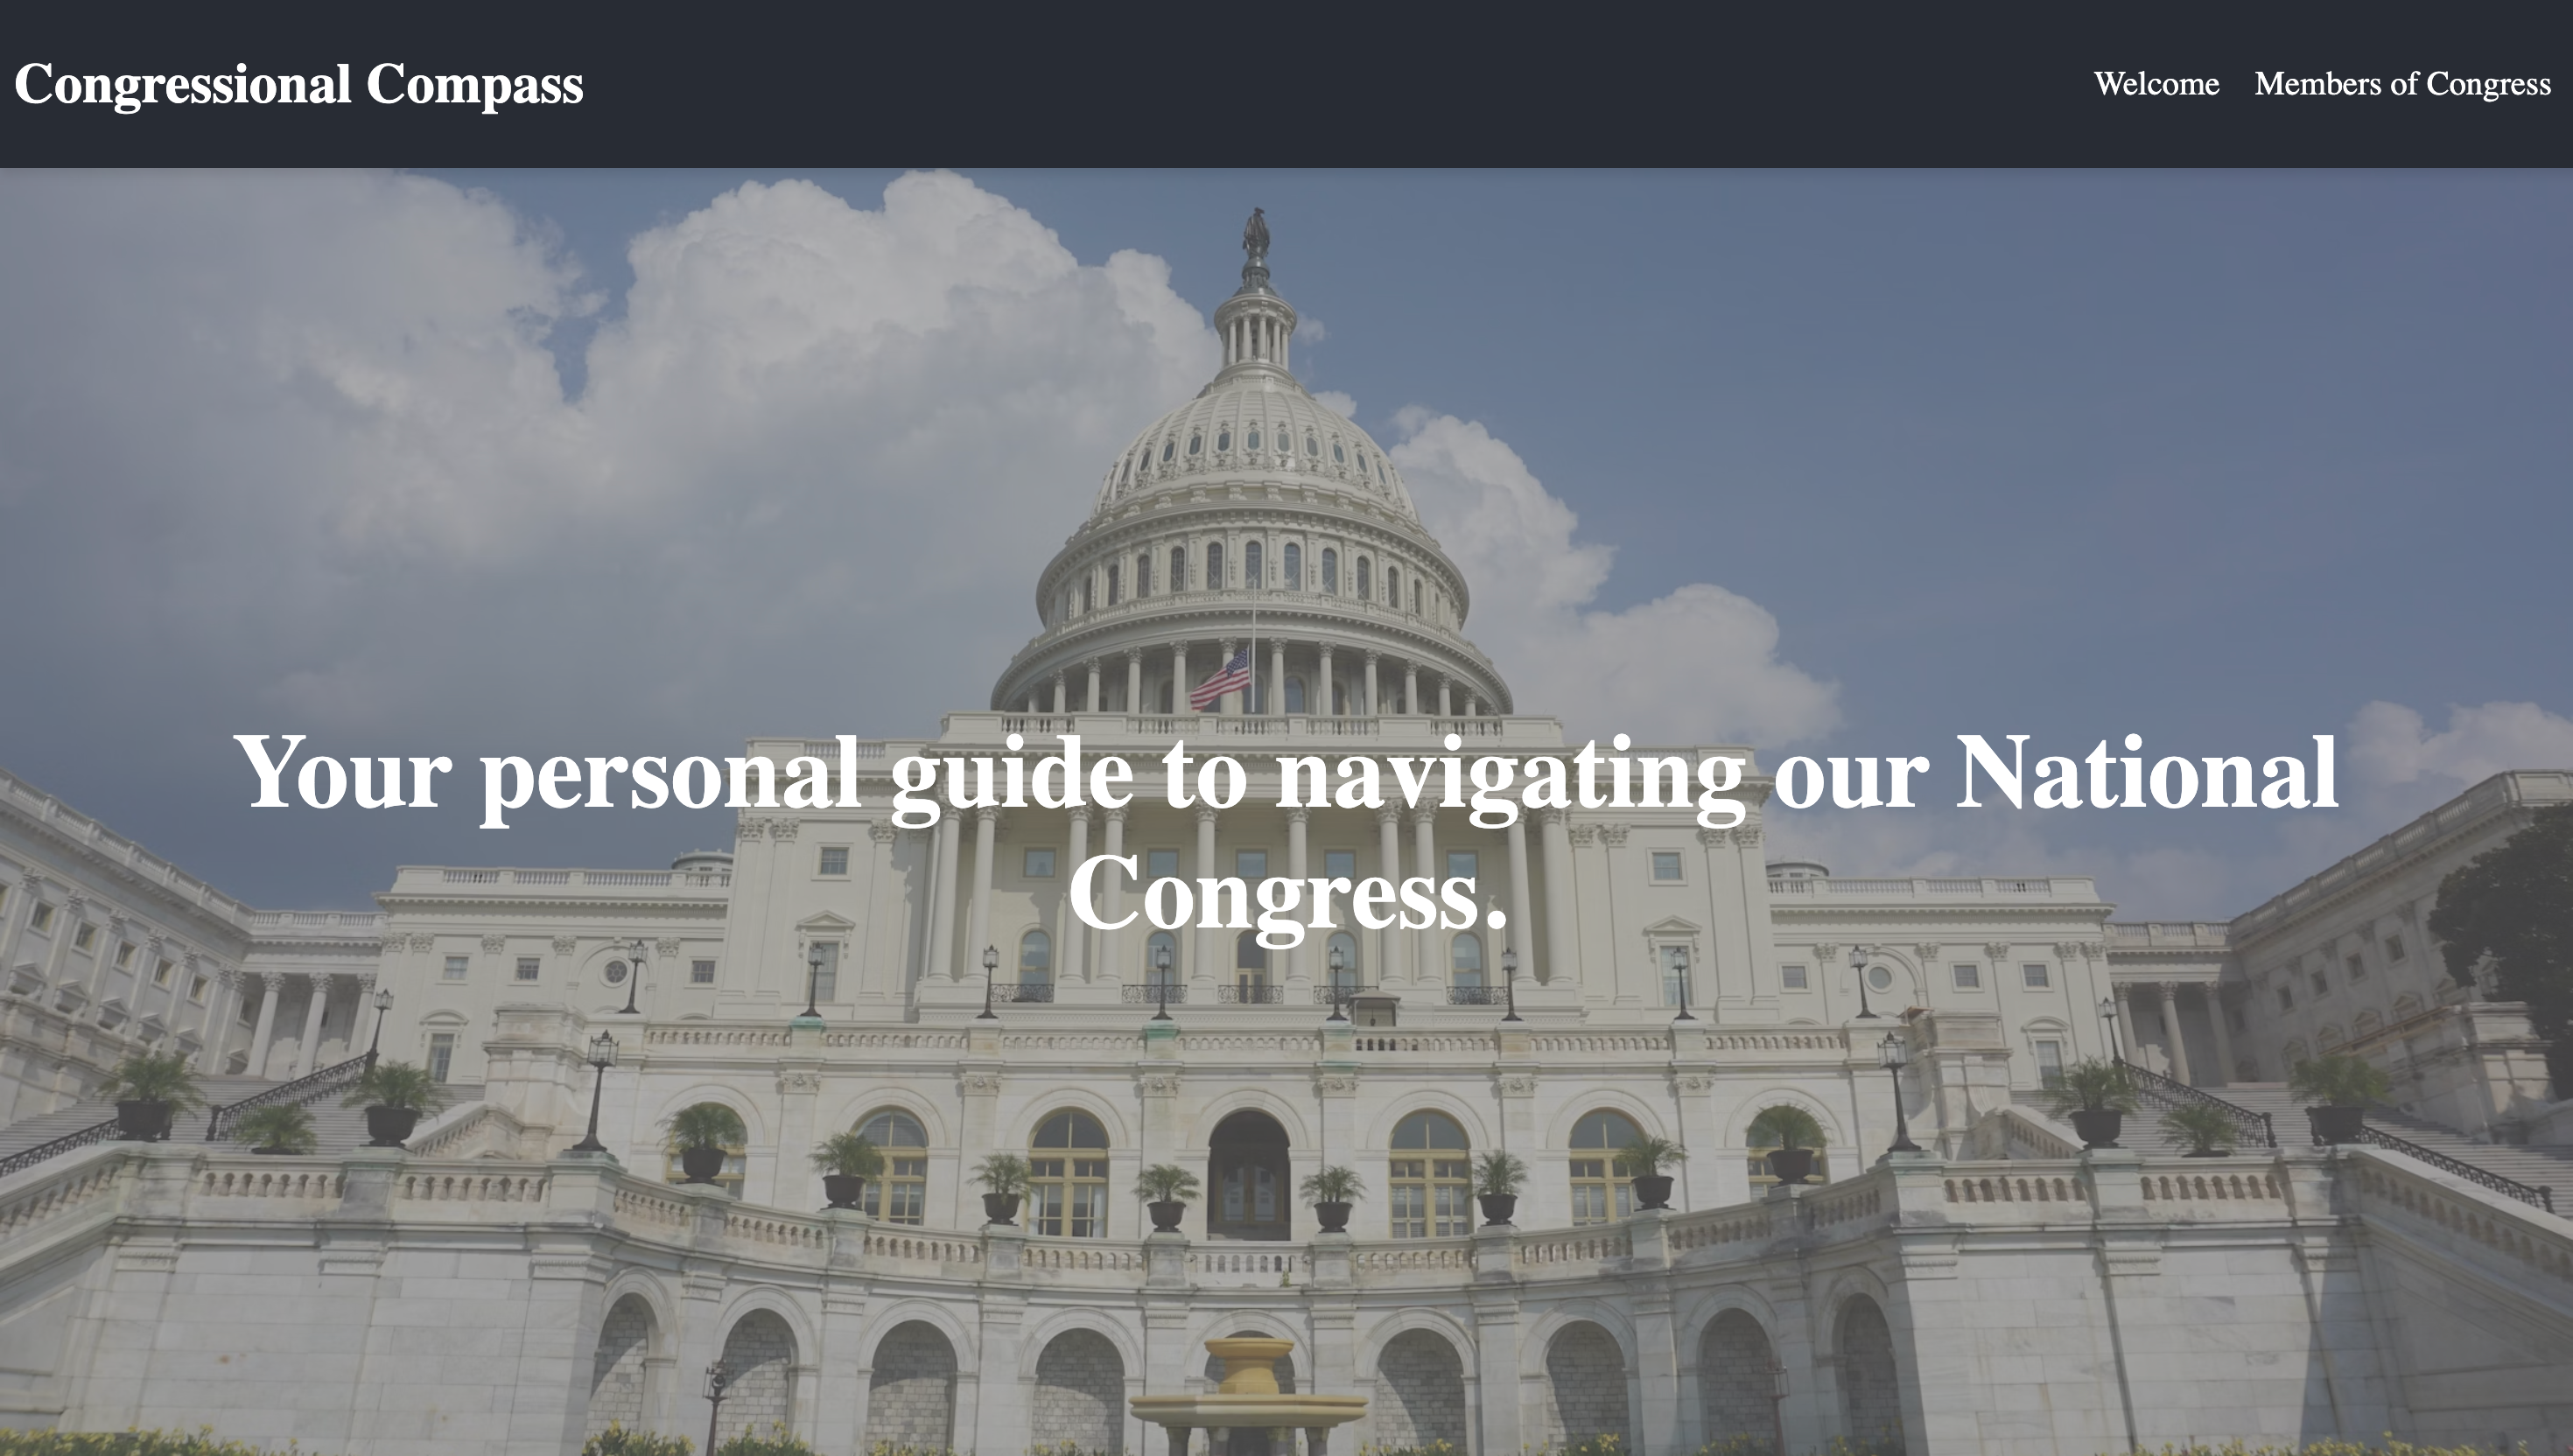
Landing page.
Hackathon Project: Understanding Political Polarization and Congressional Voting
Inspiration
Political polarization has become increasingly obvious and divisive in recent years. It's more than just a difference of opinion—it's a barrier to meaningful discourse. Real understanding of politics is often not widespread. Instead of thoughtful discussion and informed arguments, many people resort to emotional appeals or blindly accept information that aligns with their personal beliefs or agendas. This results in a society where the general public is disconnected from the actual workings of their government.
A question we often ask ourselves is: How many bills that passed Congress last year can you name? The reality is, most people don't have a solid grasp of how their representatives vote or the types of policies that are being enacted. This gap in knowledge fuels division and undermines the democratic process. We wanted to bridge this gap by providing tools that help people better understand how their representatives vote and where they stand on the political spectrum. Our project aimed to make political data more accessible, transparent, and engaging.
What We Learned
During the course of this project, we gained valuable insights into the legislative process. We quickly realized that passing a bill is far from simple—it's a long and complex journey. Most bills introduced in Congress don't even make it out of committee. Understanding this process was eye-opening and helped us refine the way we wanted to present the data.
We also learned how to work with TypeScript to develop a website, which was a steep learning curve. While we had prior experience with other languages, TypeScript's syntax and structure were new to us. We spent considerable time getting comfortable with it, and by the end of the project, we were able to use it to develop a functional and interactive frontend.
Additionally, we gained a deeper understanding of the types of bills that make it through Congress. This allowed us to focus our analysis on key data points, such as roll-call votes, amendments, and committee memberships, which helped us visualize political trends.
How We Built Our Project
Our first step was to gather data from the Congress.gov API. This gave us access to a wealth of information, including roll-call votes, amendments, committees, and more. Once we had the data, we brainstormed ways to interpret and display it effectively. We wanted to ensure that the website was intuitive and that the visuals were not only informative but engaging.
On the frontend, we took a step-by-step approach. We started small, building one page at a time, before adding navigation to make the site more user-friendly. Our design process involved a lot of planning to ensure that each page served a purpose and helped users navigate the site with ease. We also left room for future integration with Flask, allowing us to extend the project with more backend features later.
To enhance the user experience, we incorporated language models to provide context for the bills. This allowed us to help users understand what the bills were about and also quantify our metrics for placing representatives on a political compass.
Challenges We Faced
The first challenge was understanding the legislative process. Although it may seem like common knowledge, the intricate steps that a bill must go through to become law were more complex than we initially thought. This required a significant amount of time and effort to comprehend and factor into our project.
Another challenge we faced was dealing with the limitations of the Congress.gov API. While it was a great resource, we encountered several errors in the data—some entries were missing, and others contradicted the official records. This made it difficult to ensure the accuracy of our analysis. For example, when trying to track votes from subcommittees to the floor, we found that many votes were either not listed or only described as "passed by voice vote." This lack of detail hindered our ability to perform in-depth analyses.
The volume of data was also overwhelming. Bills themselves, excluding amendments, were often lengthy and complex, making both collection and analysis a time-consuming process. We needed to sift through large amounts of text to extract the most relevant information, which proved to be a challenge in itself.
Learning TypeScript was another hurdle. It was a completely different paradigm compared to the languages we were used to, and we spent a lot of time familiarizing ourselves with its syntax and structure. Despite the learning curve, we were ultimately able to use TypeScript effectively to build the website and reconcile the backend calculations with the frontend visuals.
Conclusion
This hackathon experience was incredibly rewarding. Not only did we learn about the intricate process that shapes our laws, but we also gained technical skills in TypeScript, web development, and data analysis. While we originally intended to dive deeper into subcommittee data, vote analysis, and statistical modeling, we ran out of time. However, we are proud of the progress we made in developing a locally hosted website that allows users to explore congressional data in an interactive and meaningful way.
This project highlighted the need for a more informed public and demonstrated how technology can play a crucial role in enhancing political transparency. We hope our work can serve as a stepping stone toward making politics more understandable and accessible to everyone.
Built With
- jupyter
- python
- transformers
- typescript


Log in or sign up for Devpost to join the conversation.