Inspiration Congressional data is public, but it's scattered across dozens of government websites and nearly impossible to explore intuitively. We wanted to answer a simple question: what does the network of power in Congress actually look like? Who co-sponsors bills together? Where do party lines blur? Where does the money flow?
We were inspired by force-directed graph visualizations in network science — the idea that if you model relationships as physical forces, the structure of the network reveals itself. Legislators who work together cluster together. Bills that attract bipartisan support sit between party groups. Outliers stand alone. We wanted to make that visible in 3D, and then layer AI on top to explain why the graph looks the way it does.
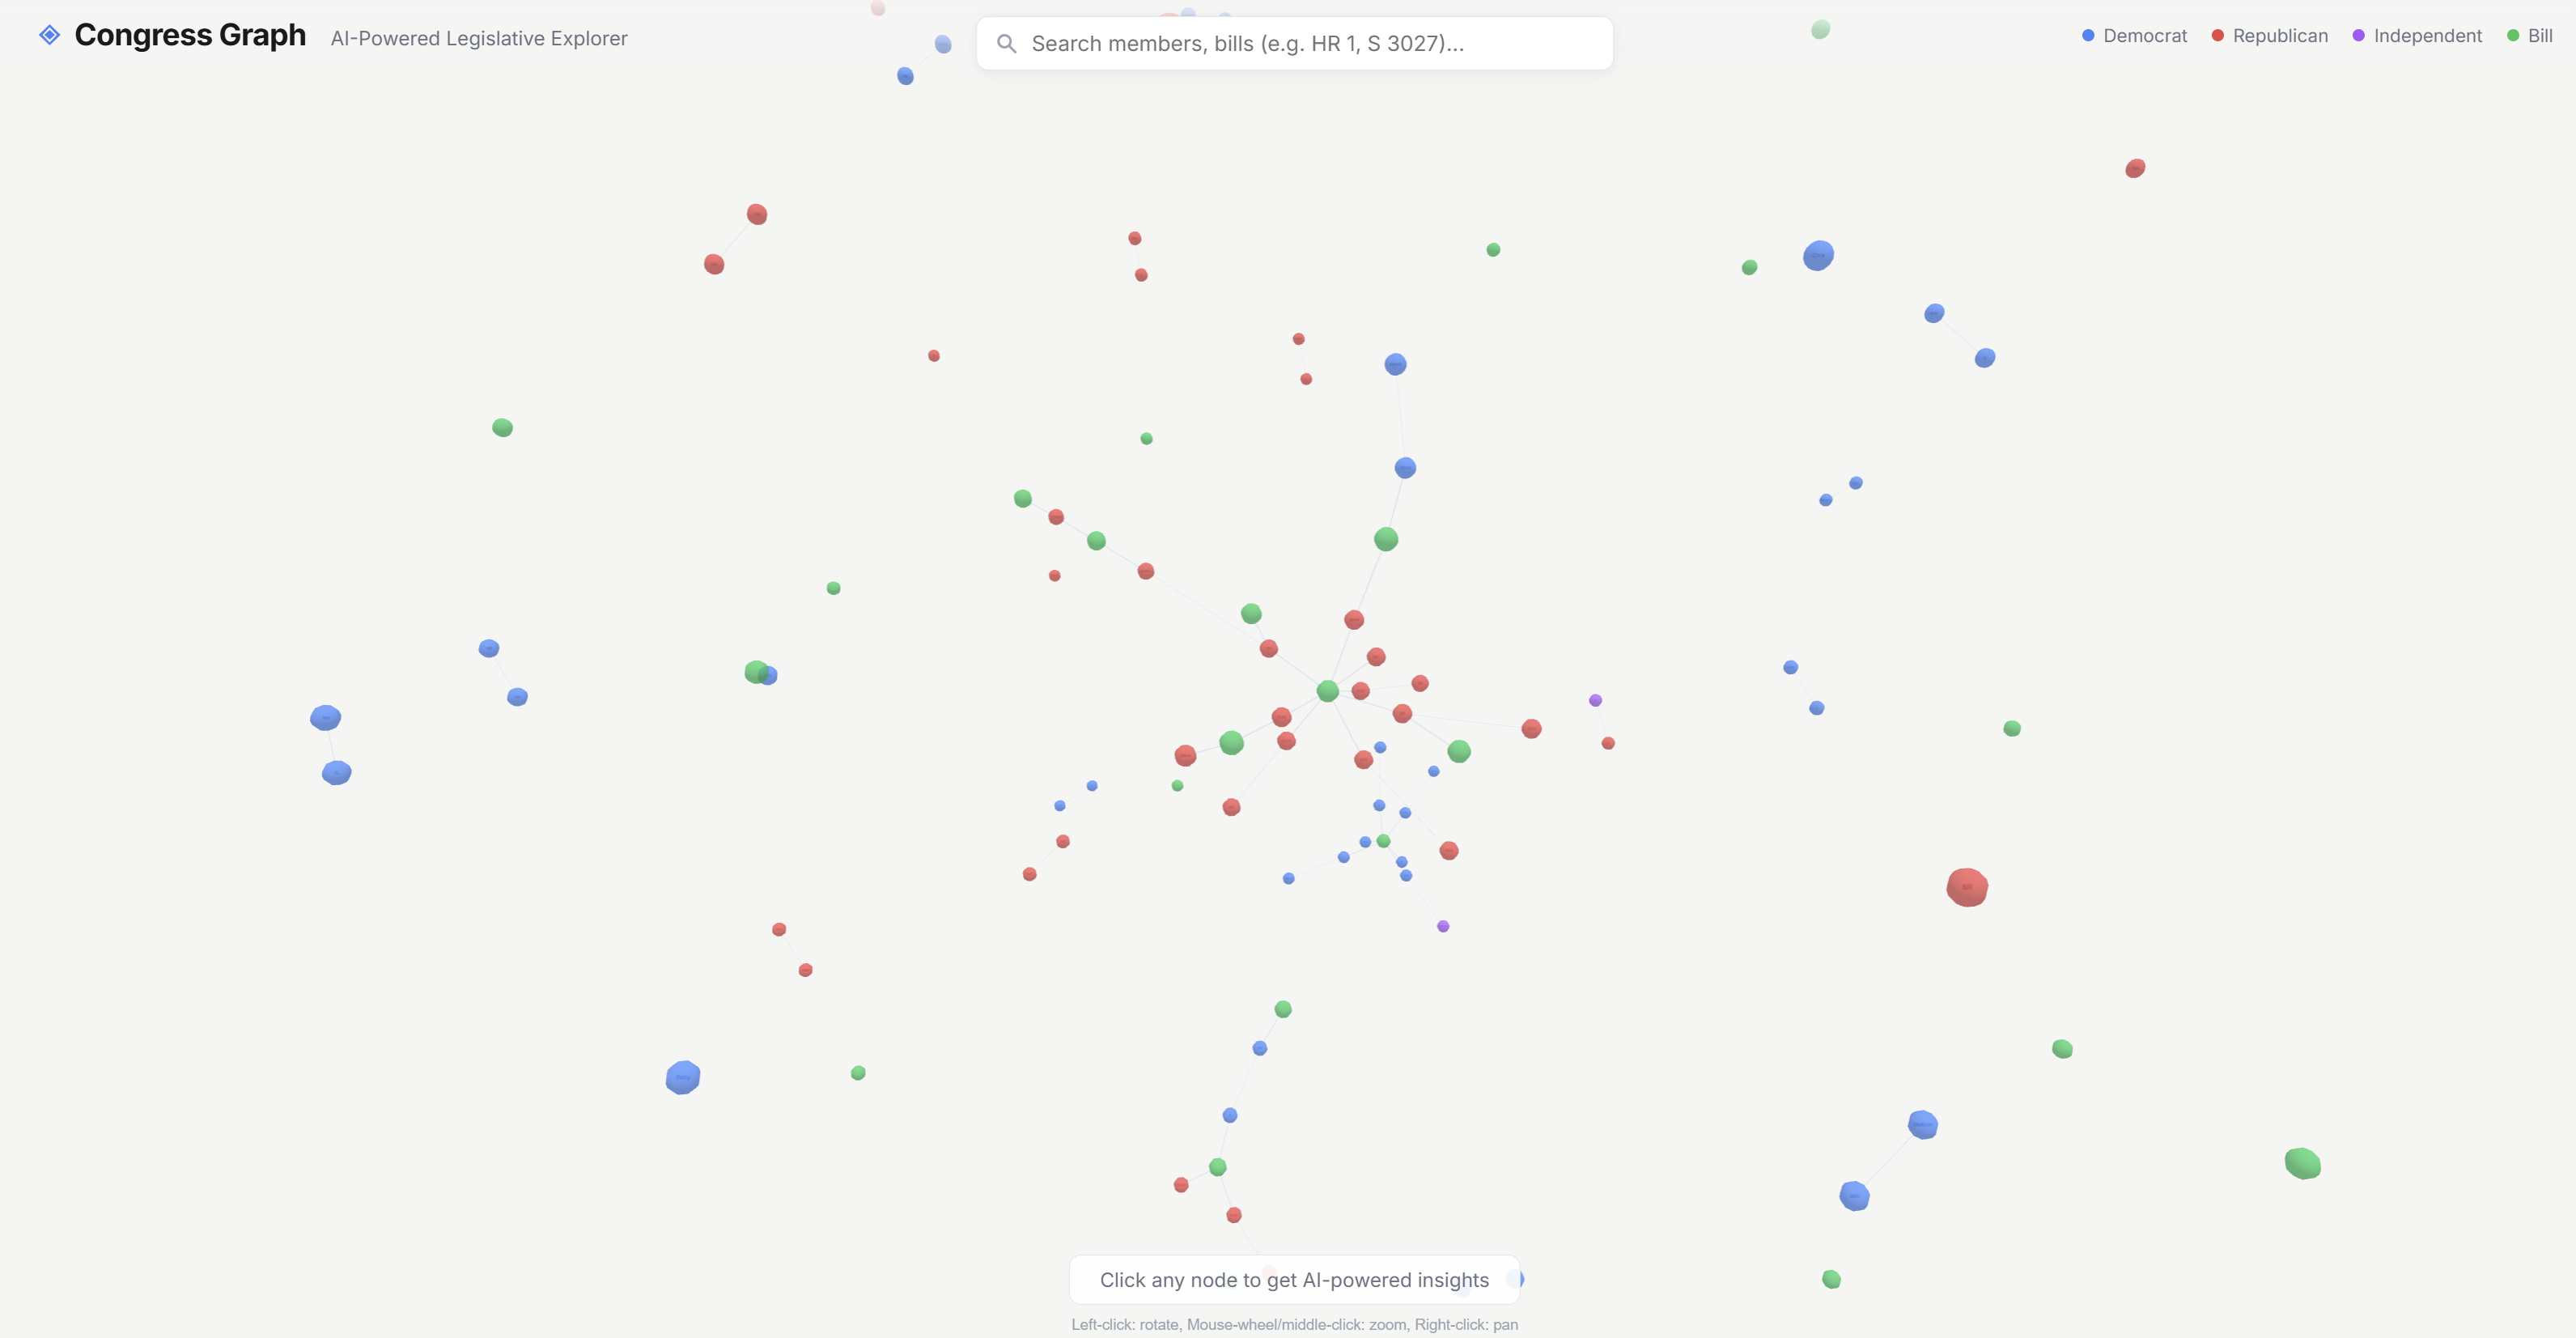
What it does Congress Graph is a 3D interactive visualization of the U.S. Congress. It renders legislators and bills as nodes in a force-directed graph, connected by sponsorship, co-sponsorship, and shared-state relationships. The physics simulation naturally clusters nodes by relationship strength — so bipartisan coalitions, state delegations, and legislative alliances emerge visually without any manual layout.
Key features:
3D Force Graph — Rotate, zoom, and fly through the congressional network. Democrats (blue), Republicans (red), Independents (purple), and Bills (green) are color-coded. Link thickness and opacity encode relationship type. AI Insight Panel — Click any node and GPT-4o-mini streams a concise, nonpartisan analysis explaining who that legislator or bill is, what their graph neighborhood reveals, and — critically — any unusual funding patterns or co-sponsorship clusters in that node's vicinity. Live Search + Dynamic Loading — Search for any member by name or any bill by number (e.g., HR 1, S 3027). If it's already in the graph, the camera smoothly flies to it. If not, it's fetched live from the Congress.gov API, injected into the graph with its connections, and the camera flies to it once the physics settle. Campaign Finance Integration — FEC data enriches each legislator node with fundraising totals, which the AI uses to flag anomalies. How we built it Frontend: React + Vite, with 3d-force-graph (built on Three.js) handling the 3D rendering and physics simulation. We used three-spritetext for in-graph labels and built a custom search bar with keyboard navigation and autocomplete that merges local graph matches with remote API results.
Backend: Node.js + Express, acting as a proxy/aggregation layer. It pulls data from two public APIs:
Congress.gov API — member lists, bill metadata, co-sponsor relationships FEC API — campaign finance totals, candidate search The server assembles a { nodes, links } graph structure with three link types:
Link Type Strength Meaning sponsored $1.0$ Legislator introduced the bill cosponsored $0.6$ Legislator co-sponsored the bill same_state $0.2$ Legislators represent the same state These strengths feed directly into the d3-force simulation: $F_{\text{link}} = k \cdot d$, where $k$ is the strength value. This means sponsor links pull nodes tightly together while same-state links create loose clusters — the graph layout is a direct function of the data.
AI Layer: When a node is clicked, the server constructs a structured prompt containing the node's metadata, its graph neighborhood, and any available FEC funding data, then streams it to GPT-4o-mini via the OpenAI API using Server-Sent Events. The AI is specifically instructed to call out unusual patterns rather than give generic summaries.
Caching: All API responses are cached server-side (15-minute TTL) to stay within free-tier rate limits.
Challenges we ran into ProPublica Congress API shutdown — We originally planned to use ProPublica's Congress API, but it no longer issues new API keys. We pivoted mid-build to the official Congress.gov API, which has a different data shape (e.g., partyName as a full string instead of a single-letter code, nested terms.item arrays instead of flat fields). Normalizing this into our graph format required writing a custom parser. 3D graph stability — 3d-force-graph creates its own Three.js canvas. React's re-render cycle was destroying and recreating the entire graph whenever state changed (like selecting a node), causing a flash-to-blank. We solved this by isolating the graph creation in a single useEffect keyed only on graphData, and using refs for callbacks so selection changes just update node colors without tearing down the scene. Force chain bug — fg.d3Force("charge").strength(-80) returns the force object, not the graph instance, so chaining .d3Force("link") after it silently failed. Cost us a debugging session before we realized the link forces weren't being applied at all. Accomplishments that we're proud of The graph genuinely reveals structure you can't see in tabular data. Bipartisan clusters, state delegations, and legislative loners all emerge naturally from the physics. The AI doesn't just summarize — it reasons about the graph neighborhood, making it feel like it actually understands the visualization. Dynamic node loading means the graph grows as you explore. It's not a static snapshot; it's a living, expanding map of Congress. What we learned Force-directed layouts are remarkably good at surfacing hidden structure in relational data — the key is tuning the force strengths to match the semantic weight of each relationship type. Streaming AI responses via SSE makes the UX feel dramatically faster than waiting for a complete response. Government APIs are powerful but inconsistent — field naming conventions, pagination behavior, and data shapes vary wildly between Congress.gov and FEC. Built with React Vite Three.js 3d-force-graph Node.js Express OpenAI GPT-4o-mini Congress.gov API FEC API
Built With
- chatgpt
- claude
- congressapi
- cursor


Log in or sign up for Devpost to join the conversation.