-
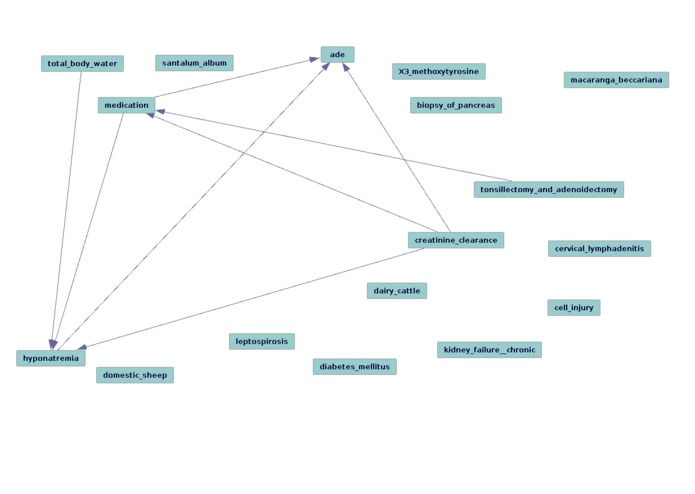
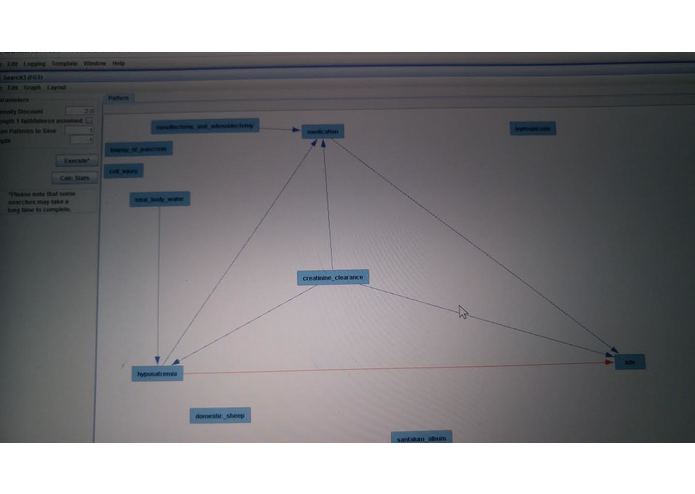
Graph (using FGS) for Urea and Acute Kidney Injury from Mayo Clinic dat-arrow direction suggest Type I error, still unknown latent variables
-
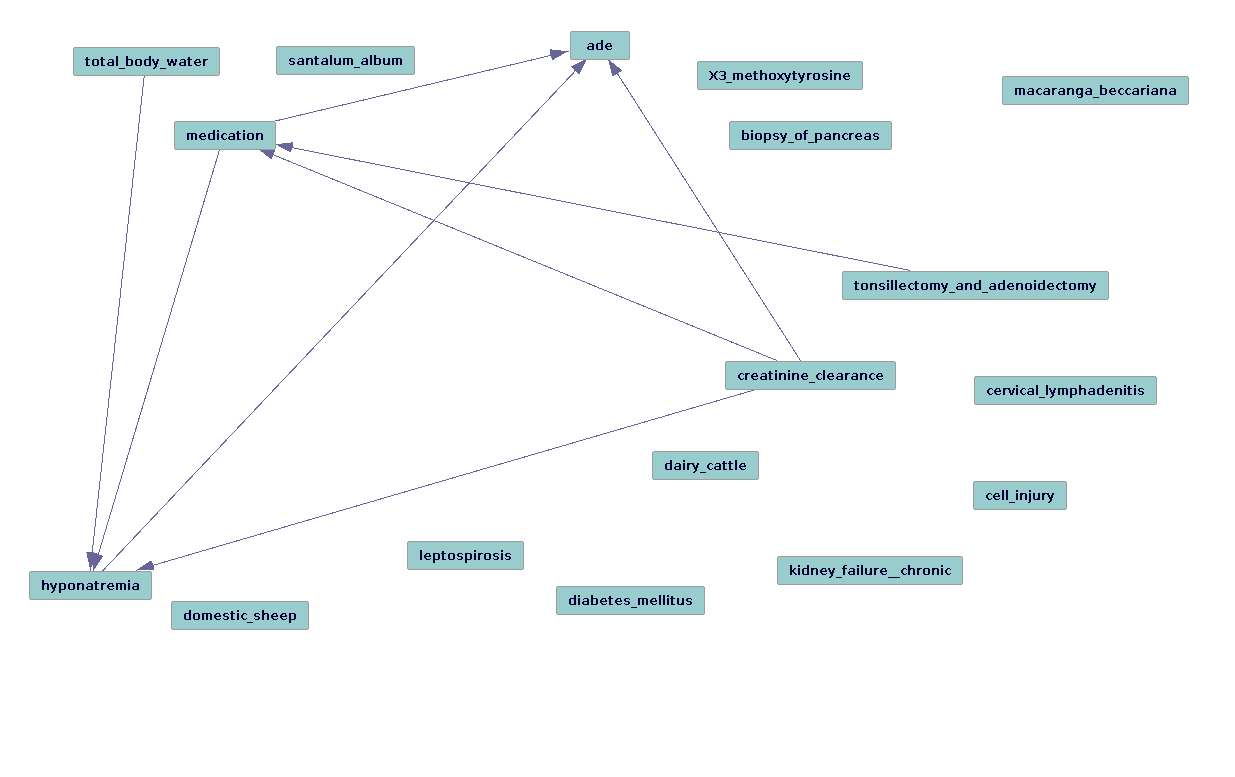
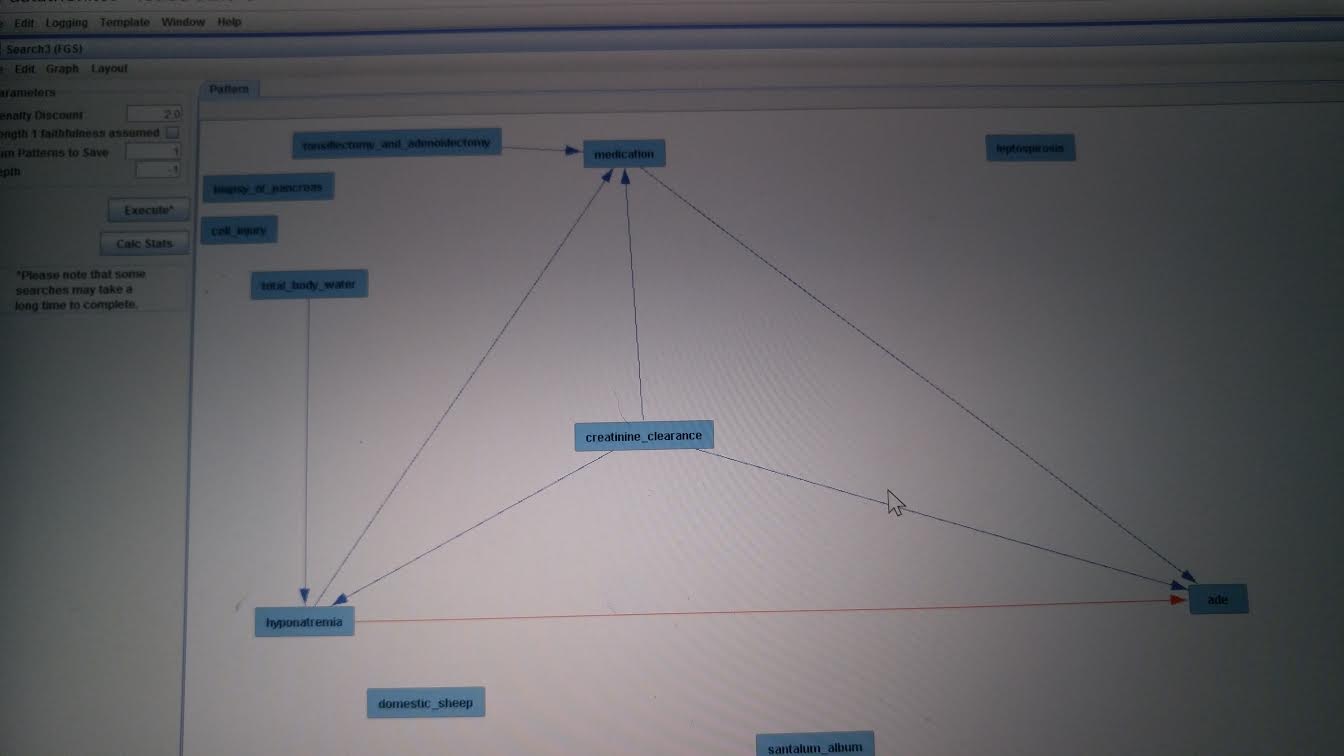
Graph (using FGS) for Urea and Acute Kidney Injury from UT repository using the TREATS==COEXISTS_WITH-INV Discovery Pattern
Inspiration
Observational data recorded in the Electronic Health Record (EHR) can help us better understand the effects of therapeutic agents in routine clinical practice. As such data were not collected for research purposes, their reuse for research must compensate for additional information that may bias analyses and ultimately lead to faulty conclusions. Confounding is present when factors aside from the given predictor(s) affect the response of interest. However, these additional factors may not be known at the outset. We present a scalable literature-based confounding variable discovery method for biomedical research applications, using pharmacovigilance (insofar as it applies to the post-marketing surveillance of pharmaceuticals for drug-adverse drug event associations) as a use case. We hypothesized that statistical models, adjusted with literature-derived confounders, will more accurately identify causative drug/adverse drug event (ADE) relationships. Going further, we propose to use causal models to assist the process of characterizing the assorted species of confounding relationships (e.g., "true confounders": where the variable is associated with both a predictor of interest [drug in this case] and the outcome, confounding effects without true confounders [association only with outcome], mediation, and latent confounding, i.e. when we need to return to the literature and discovery novel confounding variable candidates for testing on the observational data.
In short, we anticipate that causal methods will enhance our process of using knowledge to identify latent confounding variables in messy observational data and improve accuracy in biomedicine that require such data distillation (e.g., pharmacovigilance, pharmacogenomics, biosurveillance, and epidemiology).
See AMIA 2016 paper in link.
How I built it
literature-based discovery methods from http://epiphanet.uth.tmc.edu using Java, Lucene, semanticvectors package (github), tetrad, R, bash, MedLEE, MySQL, python, many others (see AMIA 2016 paper)
For more on literature-based discovery, see:
Cohen,T, Widdows,D, Schvaneveldt,RW, Rindflesch,T. Logical leaps and quantum connectives: forging paths through predication space. Quantum Informatics for Cognitive, Social, and Semantic Processes: Papers from the AAAI Fall Symposium. 2012
and
Bruza P. Literature-based Discovery (Ed by Bruza P. and Weeber M). 2008
and
Swanson DR. Fish oil,Raynaud's syndrome, and undiscovered public knowledge.Perspect Biol Med.1986;30(1):7–18.
Data:
1.) University of Texas Health Science Center at Houston's School of Biomedical Informatics Clinical Data Warehouse observational data from ~ 2.2M clinical notes (thanks to Dr. Elmer Bernstam et al.)
2.) Mayo Clinical in Rochester, MN data ~3.5M clinical notes (thanks to Dr. Liu Hongfong and Majid Restegar) for assisting us with their NLP work and in providing requests for extremely voluminous contingency tables
Reference set developed from OMOPS/OHDSI Project at Columbia University
SemMedDB.http://skr3.nlm.nih.gov/SemMedDB/
Challenges I ran into
Was not prepared for the volume of the data. We will be learning how to interpret causal graphs in the time to come. Different causal algorithms seem to have different strengths for this task. FCI (and its siblings: GFCI and RFCI) for instance can be useful for the task of characterizing different types of confounding (e.g., if a variable is a "true confounder"), since it generates patterns rather than instantiated graphs, and which edges are stable in their directionality, if any. FGS is incredibly useful for gathering an overview of how the variables that have been identified are performing, i.e that the literature-based methods are identifying latent variables in such a way that they accurately infer and recapitulate the known and verified causal structure from observational data.
In the cases that we looked at, many of the true positives were identified well enough (in terms of the direction of the edge arrows pointing in the expected direction from drug that is known to cause a given side effect [test group]). However, the success of literature-based discovery methods presumes to account for a murkier problem, the identification of "known unknown unknowns" available in the literature in such a way that the confounding variable candidates thus generated should "explain away" egregious causal associations.
However, for the control group (for which any drug-adverse drug event is lacking in the literature), there were many false positives/Type I errors. This indicates that more work in required to "dig deeper" with our literature-based discovery tools and iteratively test for "causal completeness" (or some simulacrum thereof). This insight from Tetrad/the causal methods, most significantly, clarifies the steps that must be taken.
Accomplishments that I'm proud of and what I learned
I managed to attain a reasonably firm grasp of how causal methods will fit into my dissertation work which is in essence using a biomedical knowledge base to derive testable hypotheses from observational data in the form of clinical notes.
What's next for Confounding Variable Discovery and Causal Refinement
We will need to smooth out the data conversion process in the future and make the workflow much more flexible in general. I will be applying for an account at the PSC in the very near future. I look forward to being a very pesky user of Tetrad. While we are at it, let's get rcausal (including its docker instantiation) to be more robust!
More to the point, we (meaning me, Scott Malec) will be developing an iterative method to approach "causal completeness" by synthesizing Tetrad/causal discovery and our confounding variable candidate identification methods (thereby identifying latent variables).


Log in or sign up for Devpost to join the conversation.