-

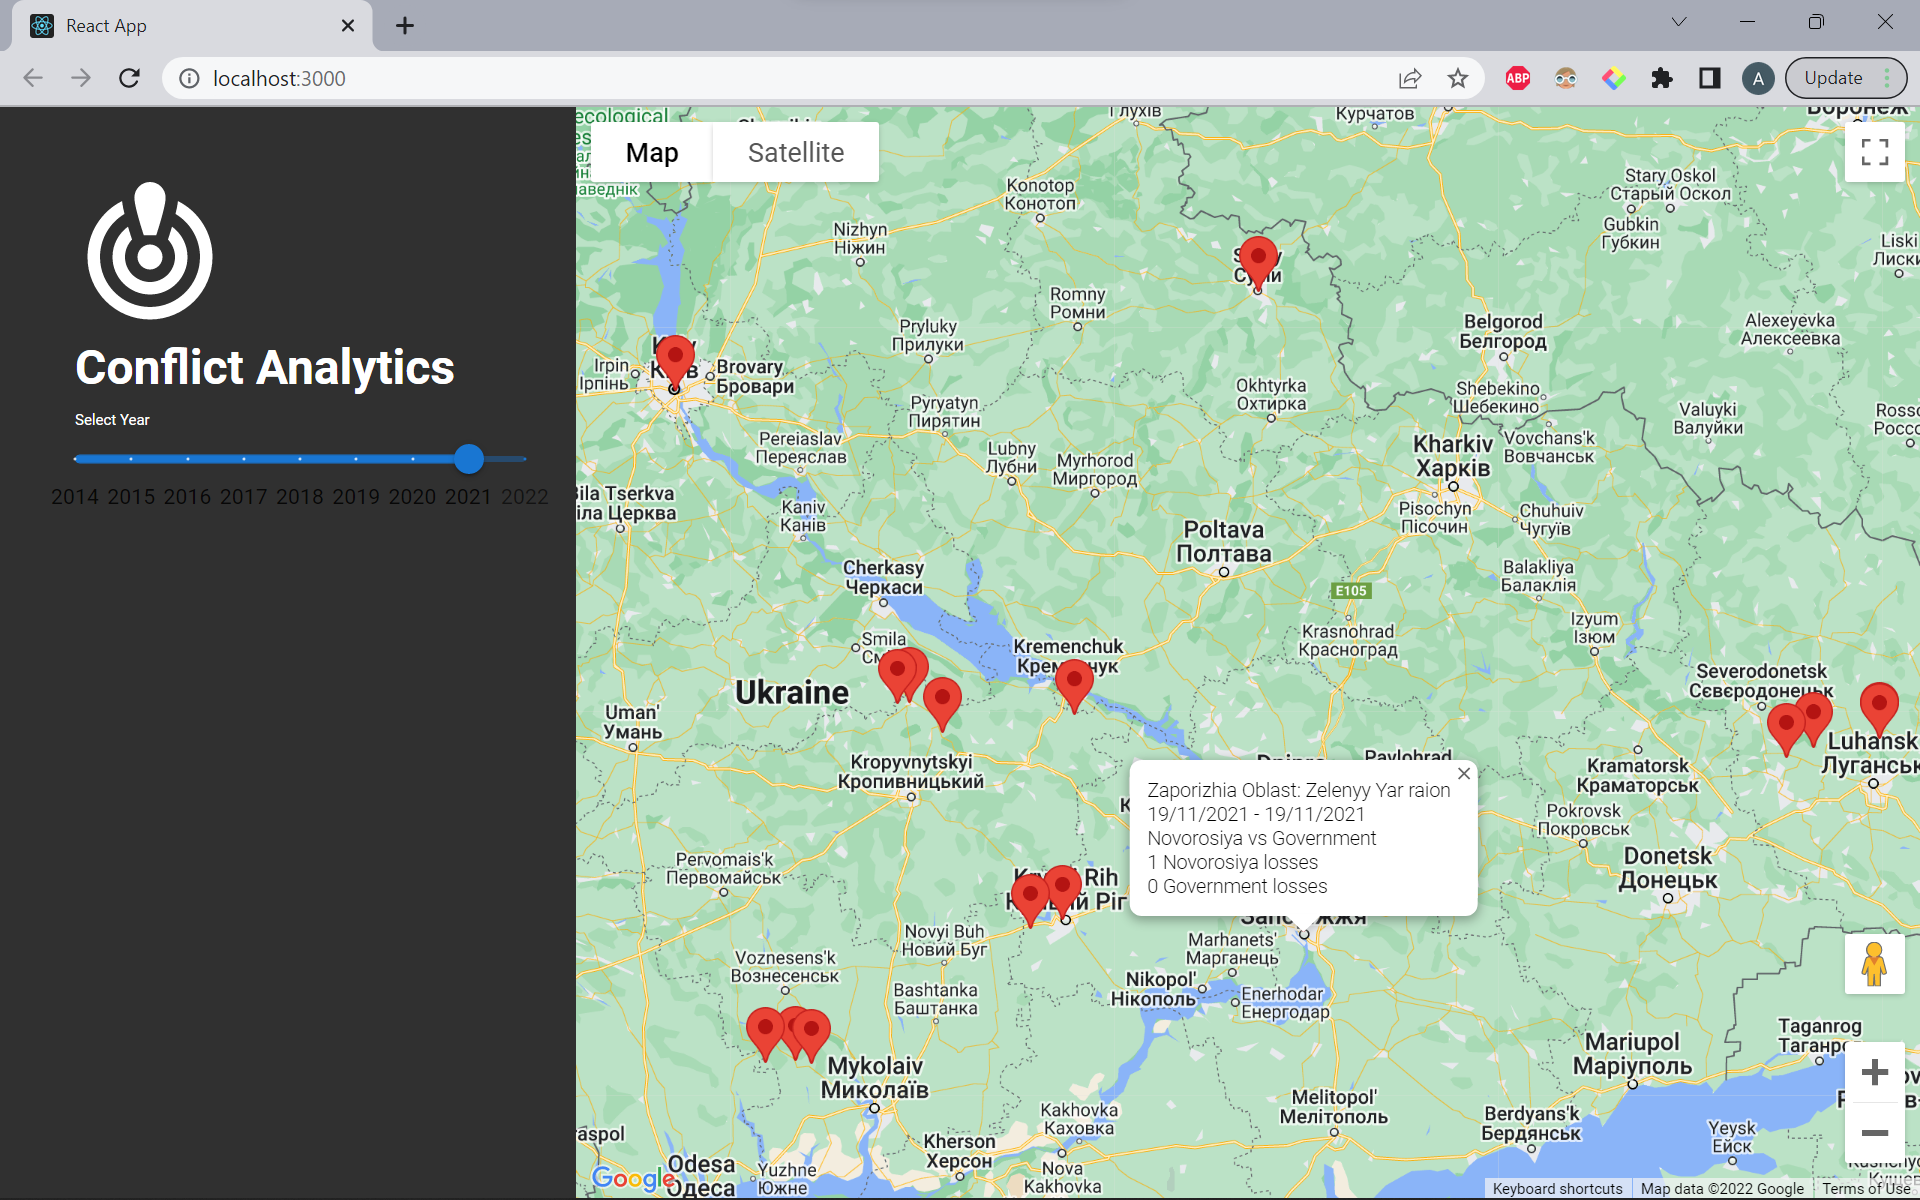
2021 datapoints
-
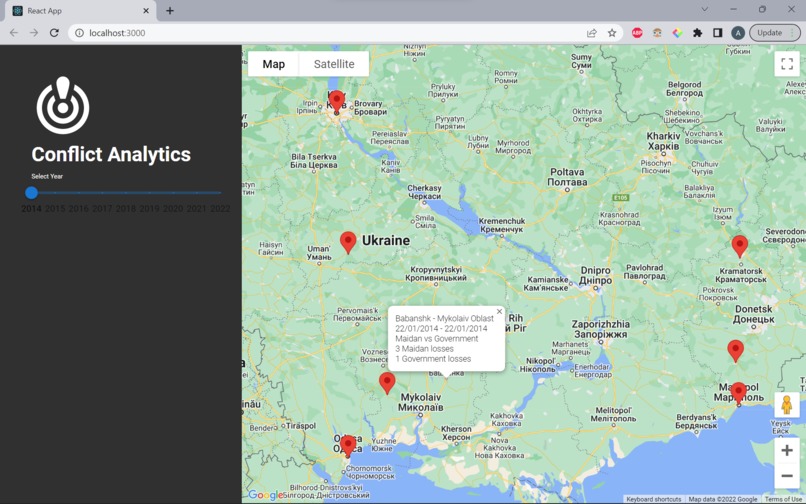
2014 datapoints

Inspiration
Current news on the conflict.
What it does
The tool visually represents data on the Ukraine war.
How we built it
We began by using the amplitude SDK to import a CSV file containing data, sources from trusted media sources, on the Ukraine war. This data was segmented using Amplitude and represented visually using charts to show t. Our tool plots historic data to show the development of the war and areas that have been affected each year.
Challenges we ran into
Accomplishments that we're proud of
What we learned
What's next for Conflict Analytics
We will further develop the predictive model, used to predict where the conflict will move to, to make it more accurate by increasing the number of data points and integrating Manifold's API to demonstrate public sentiment.
Built With
- amplitude
- google-maps
- html
- javascript
- python
- react
Log in or sign up for Devpost to join the conversation.