Inspiration
Farmers make daily decisions — irrigate, spray, work in the field — based on regional forecasts that cover 100+ km and miss what's actually happening on their plot. We kept seeing the same failure modes: fields irrigated hours before an unforecast downpour, pesticide washed off by rain or drifting in high wind, and labourers working through dangerous afternoon heat.
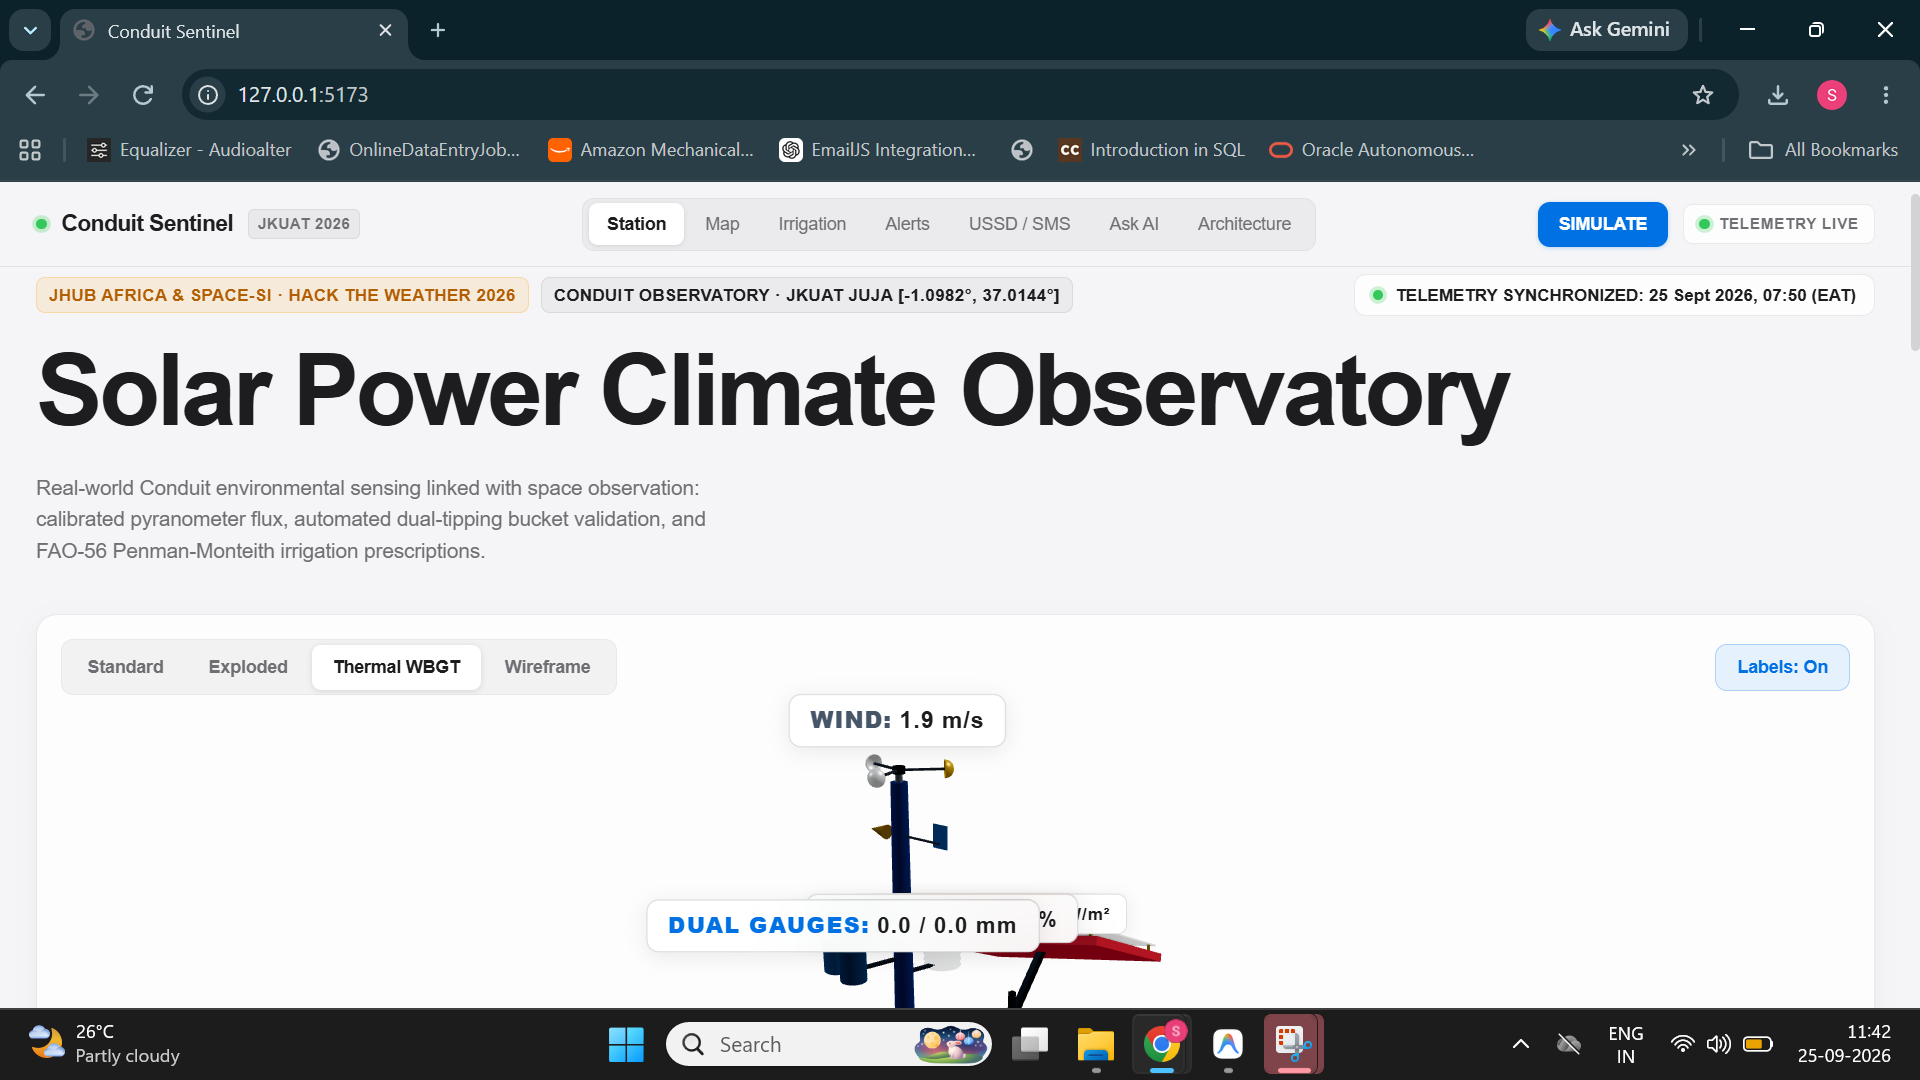
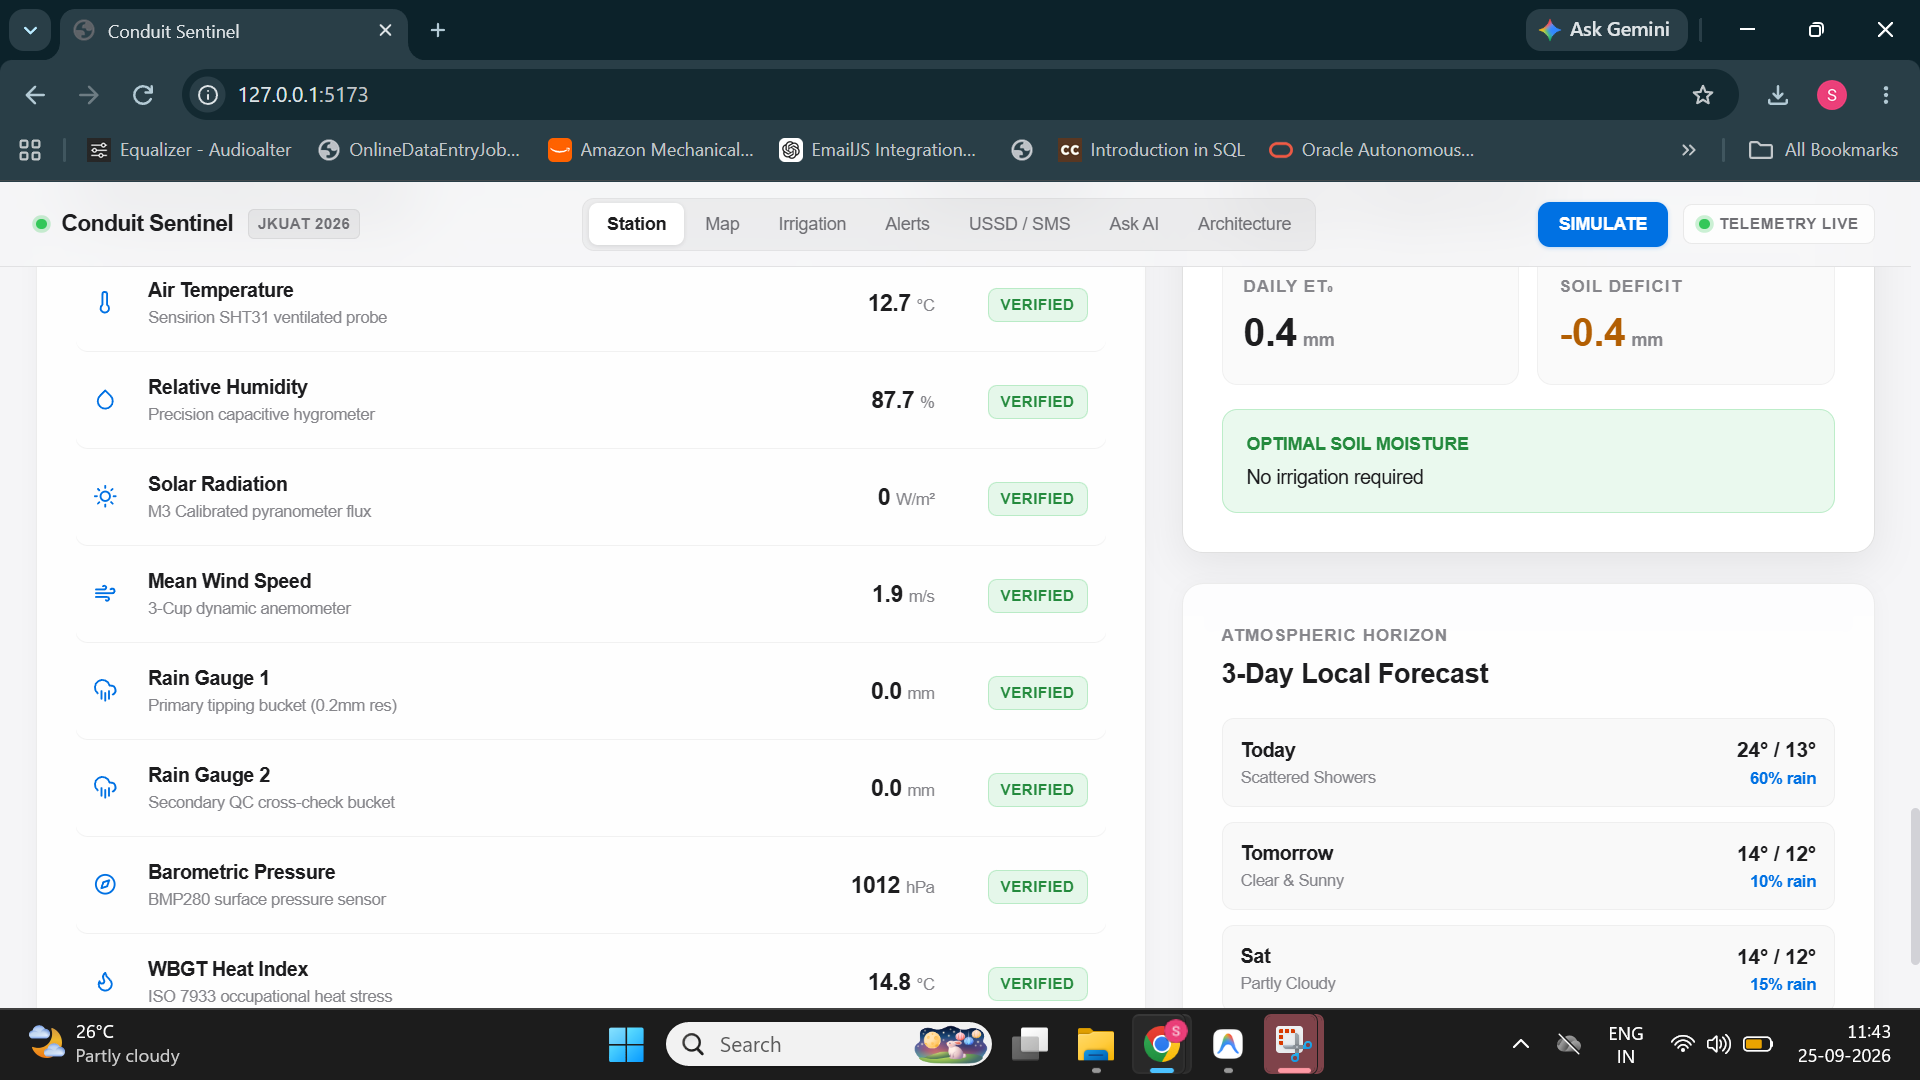
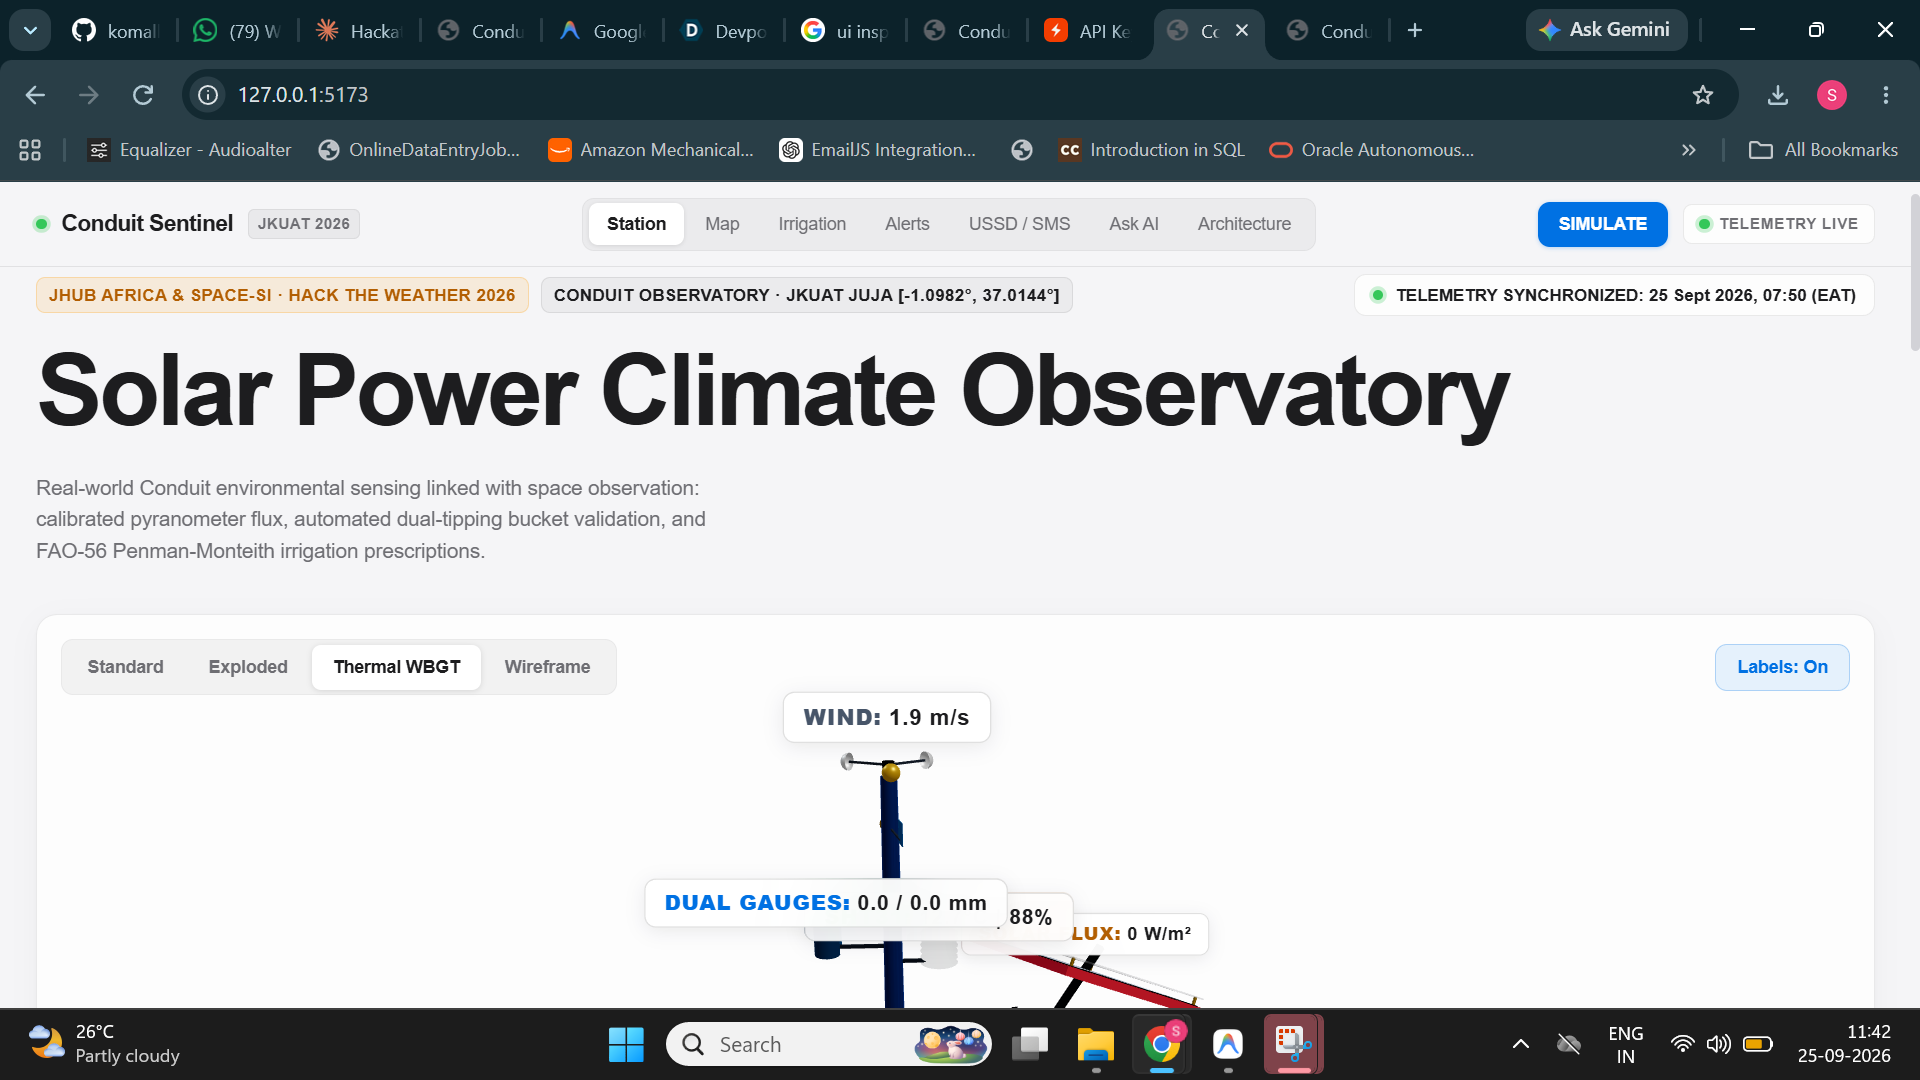
The data to prevent this already exists. The Conduit@Empathy research station at JKUAT measures 15 microclimate parameters every few minutes, but raw numbers on a dashboard don't help a farmer with a basic phone. We wanted to close that gap: from sensor reading to a decision someone can act on.
What it does
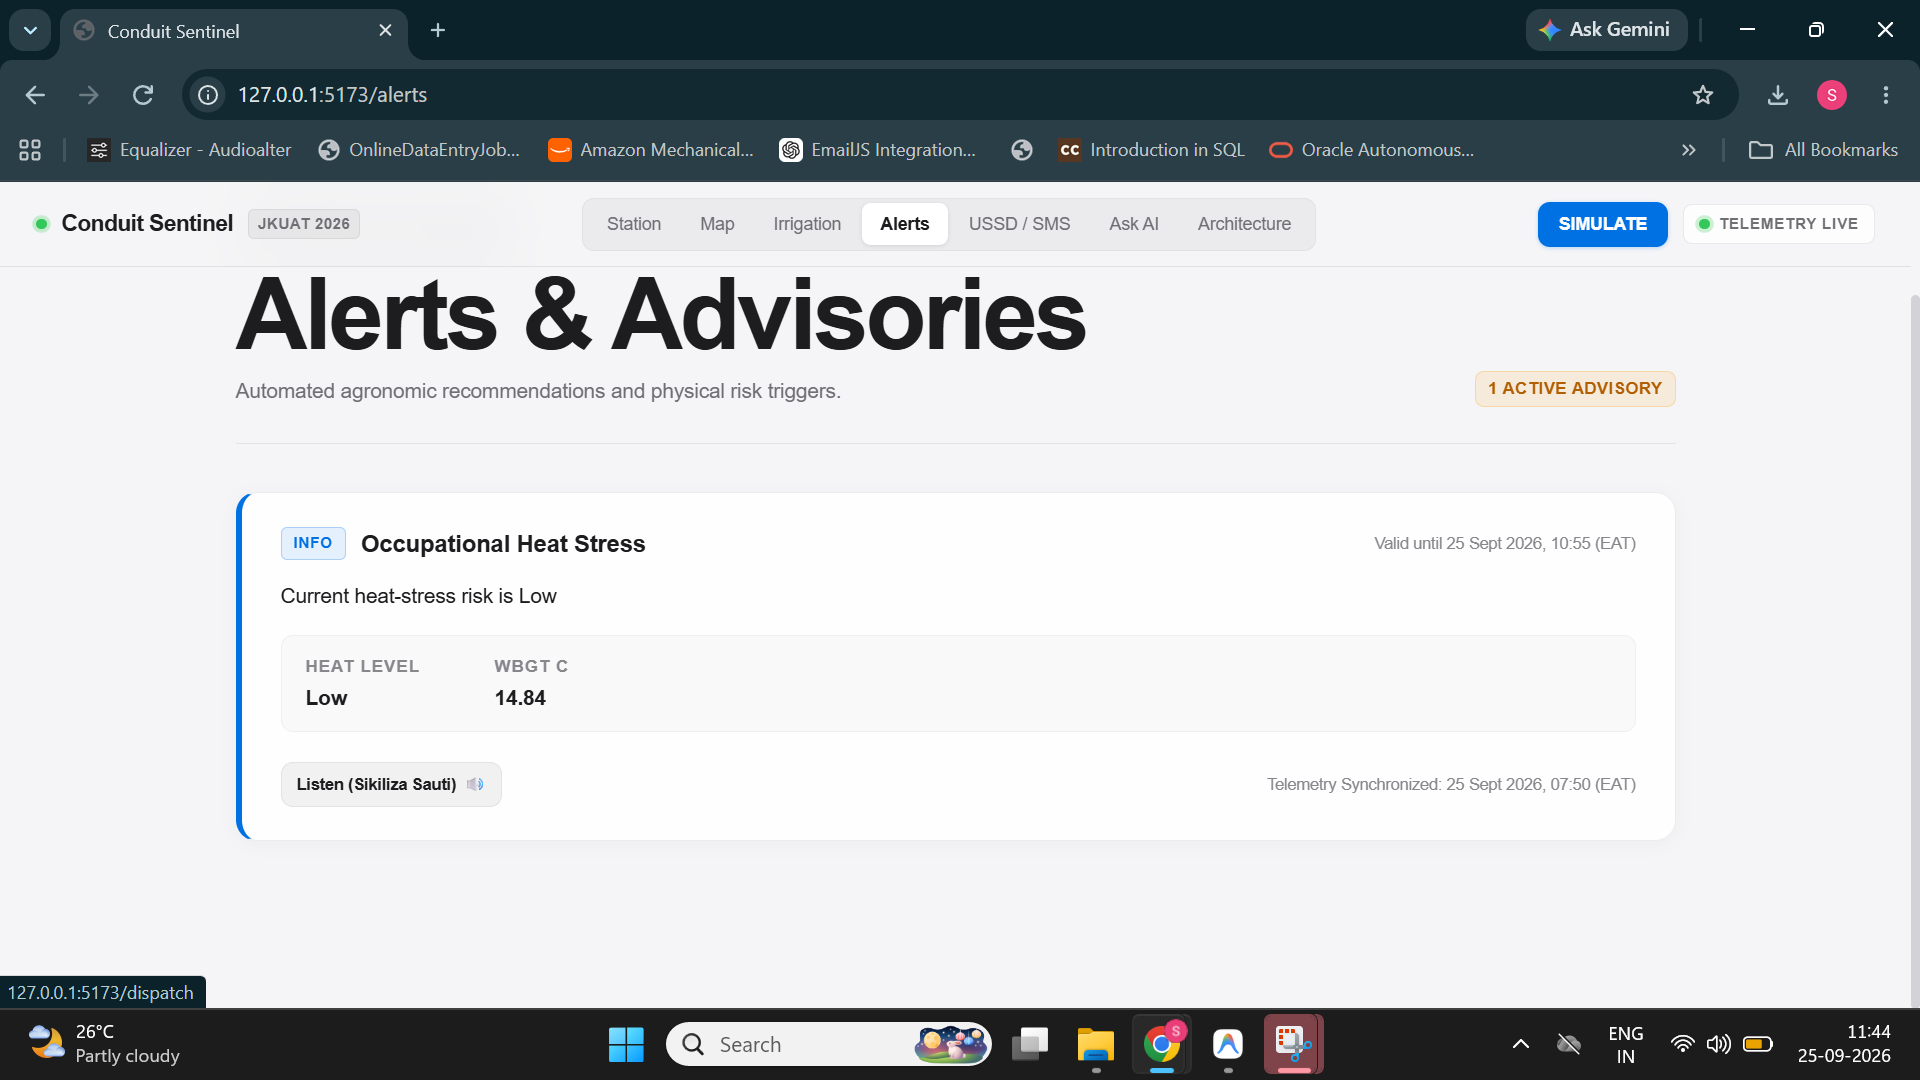
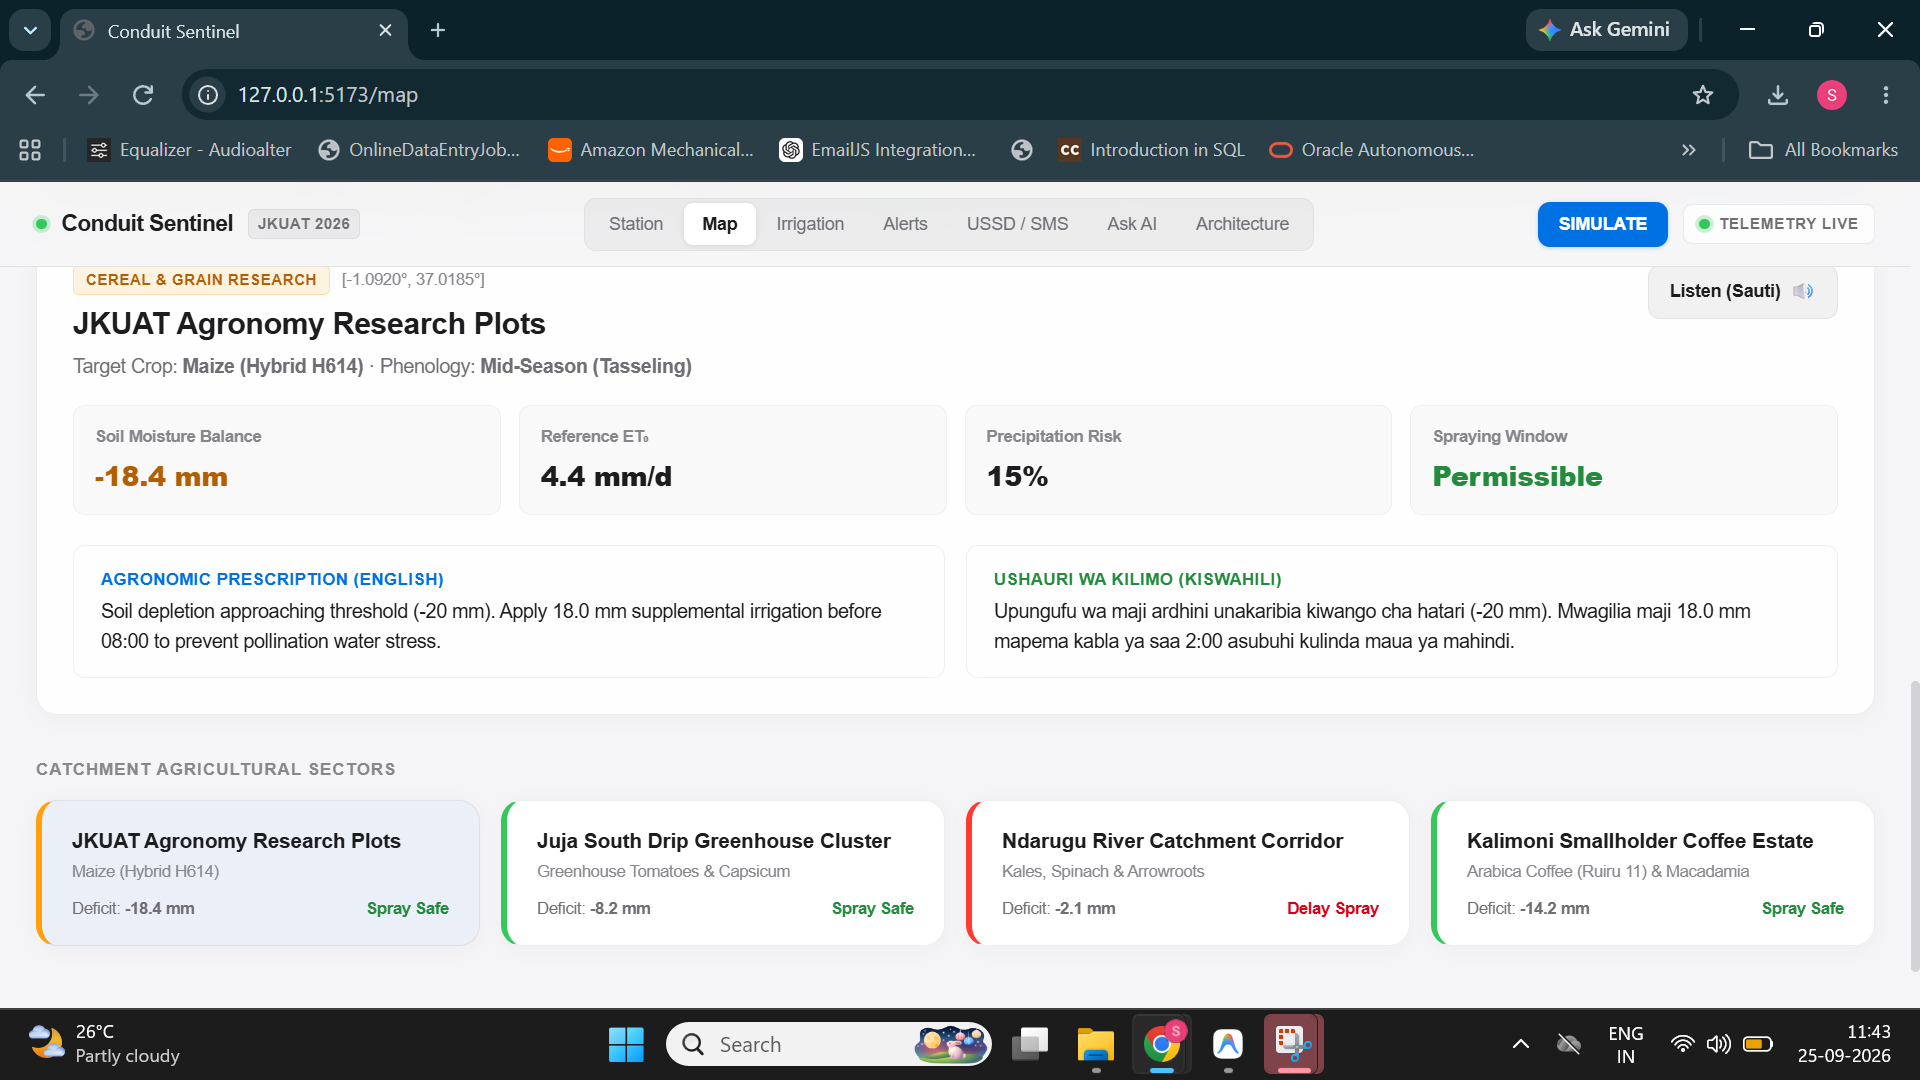
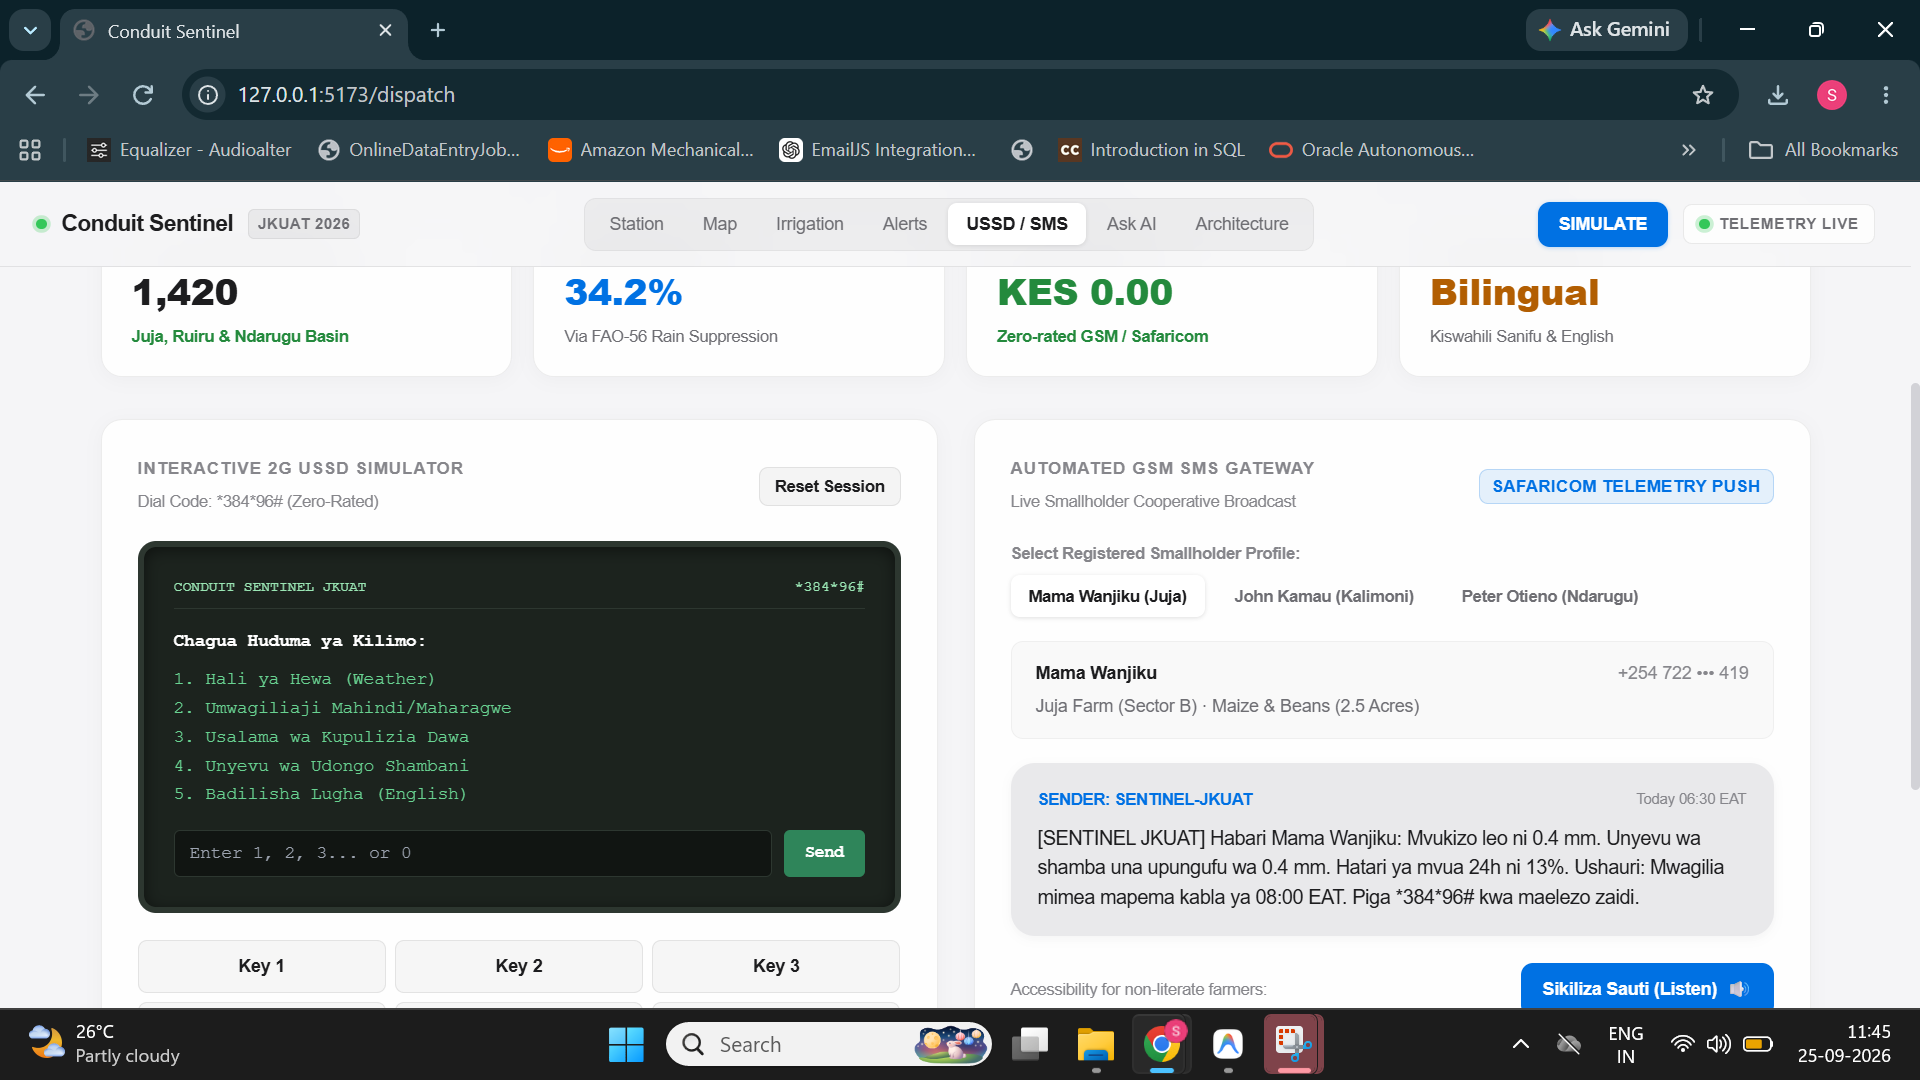
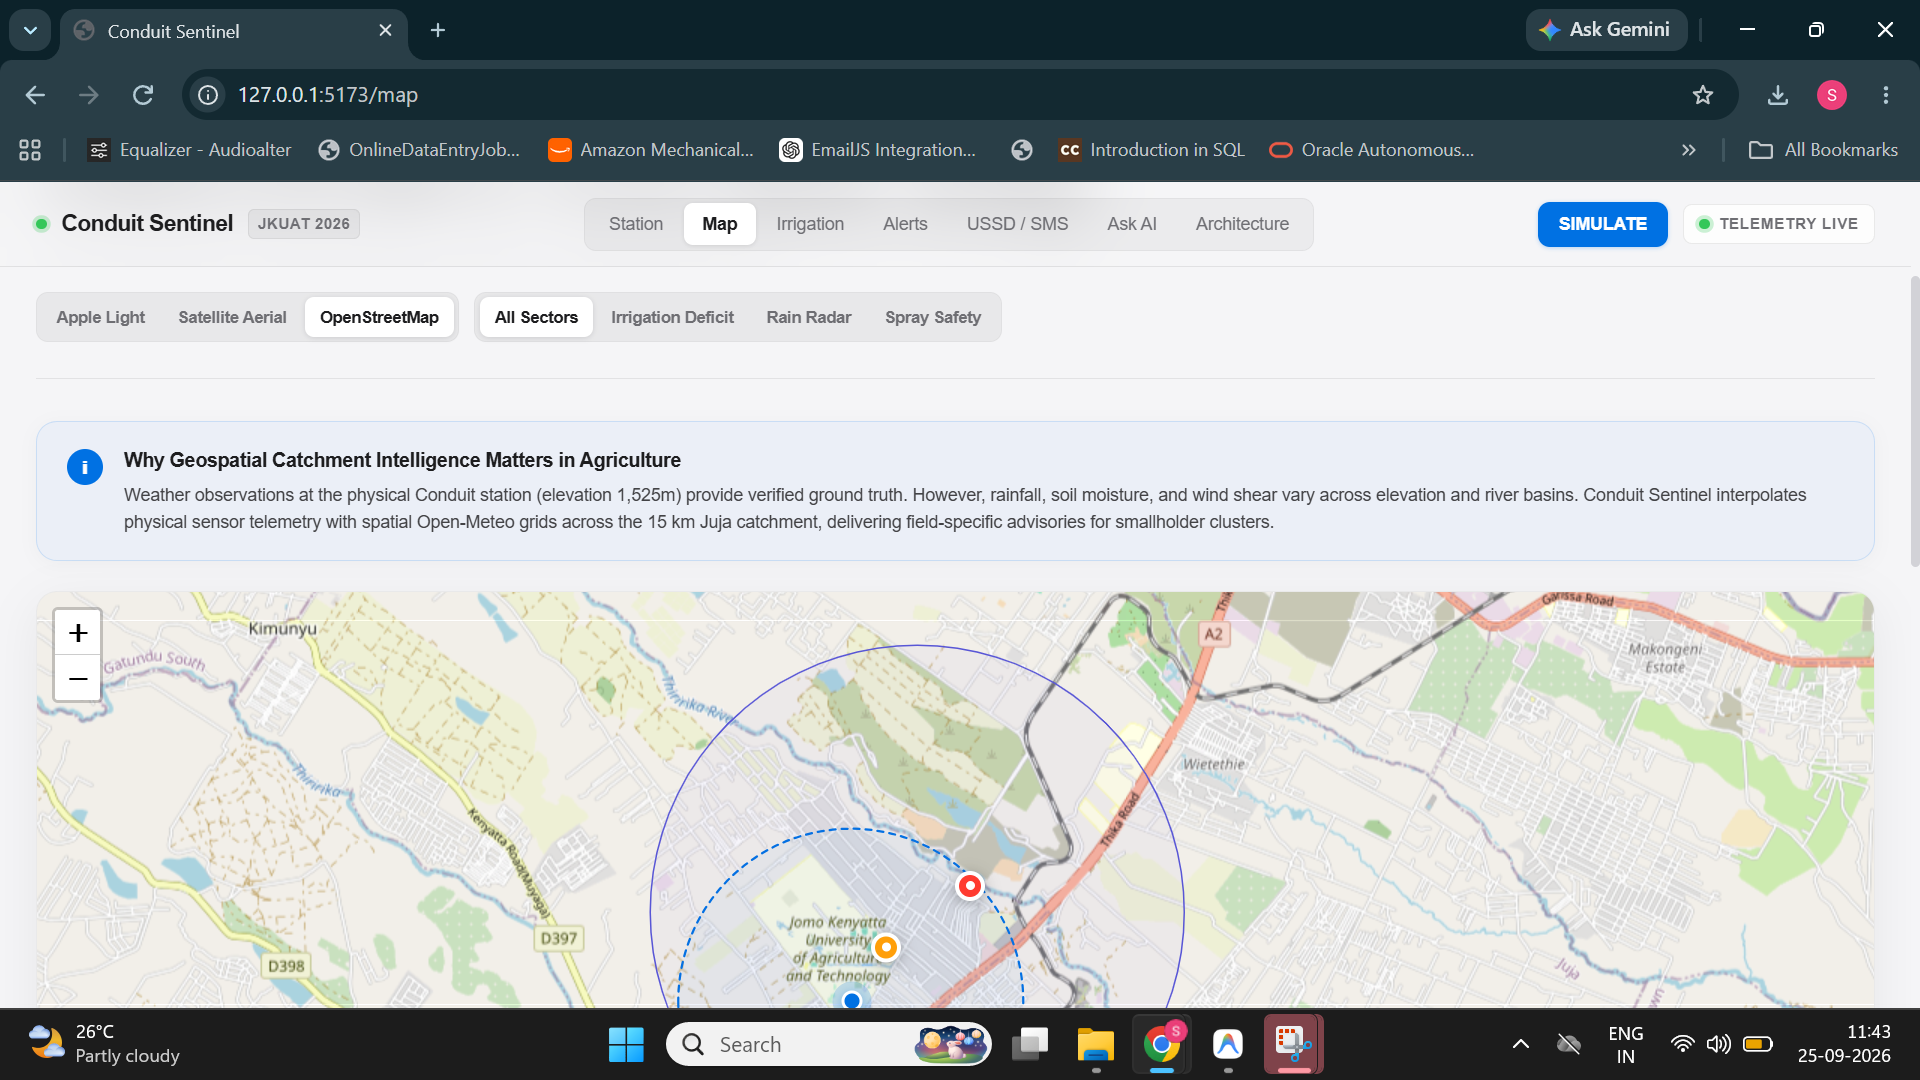
Conduit Sentinel ingests live station telemetry, checks its quality, runs physics and ML models on it, and turns the results into three concrete advisories: when and how much to irrigate, whether it's safe to spray, and when to rest from heat. These are delivered through a web dashboard, Telegram alerts, an SMS/USSD simulator for 2G phones, and voice readouts in English and Kiswahili.
How we built it
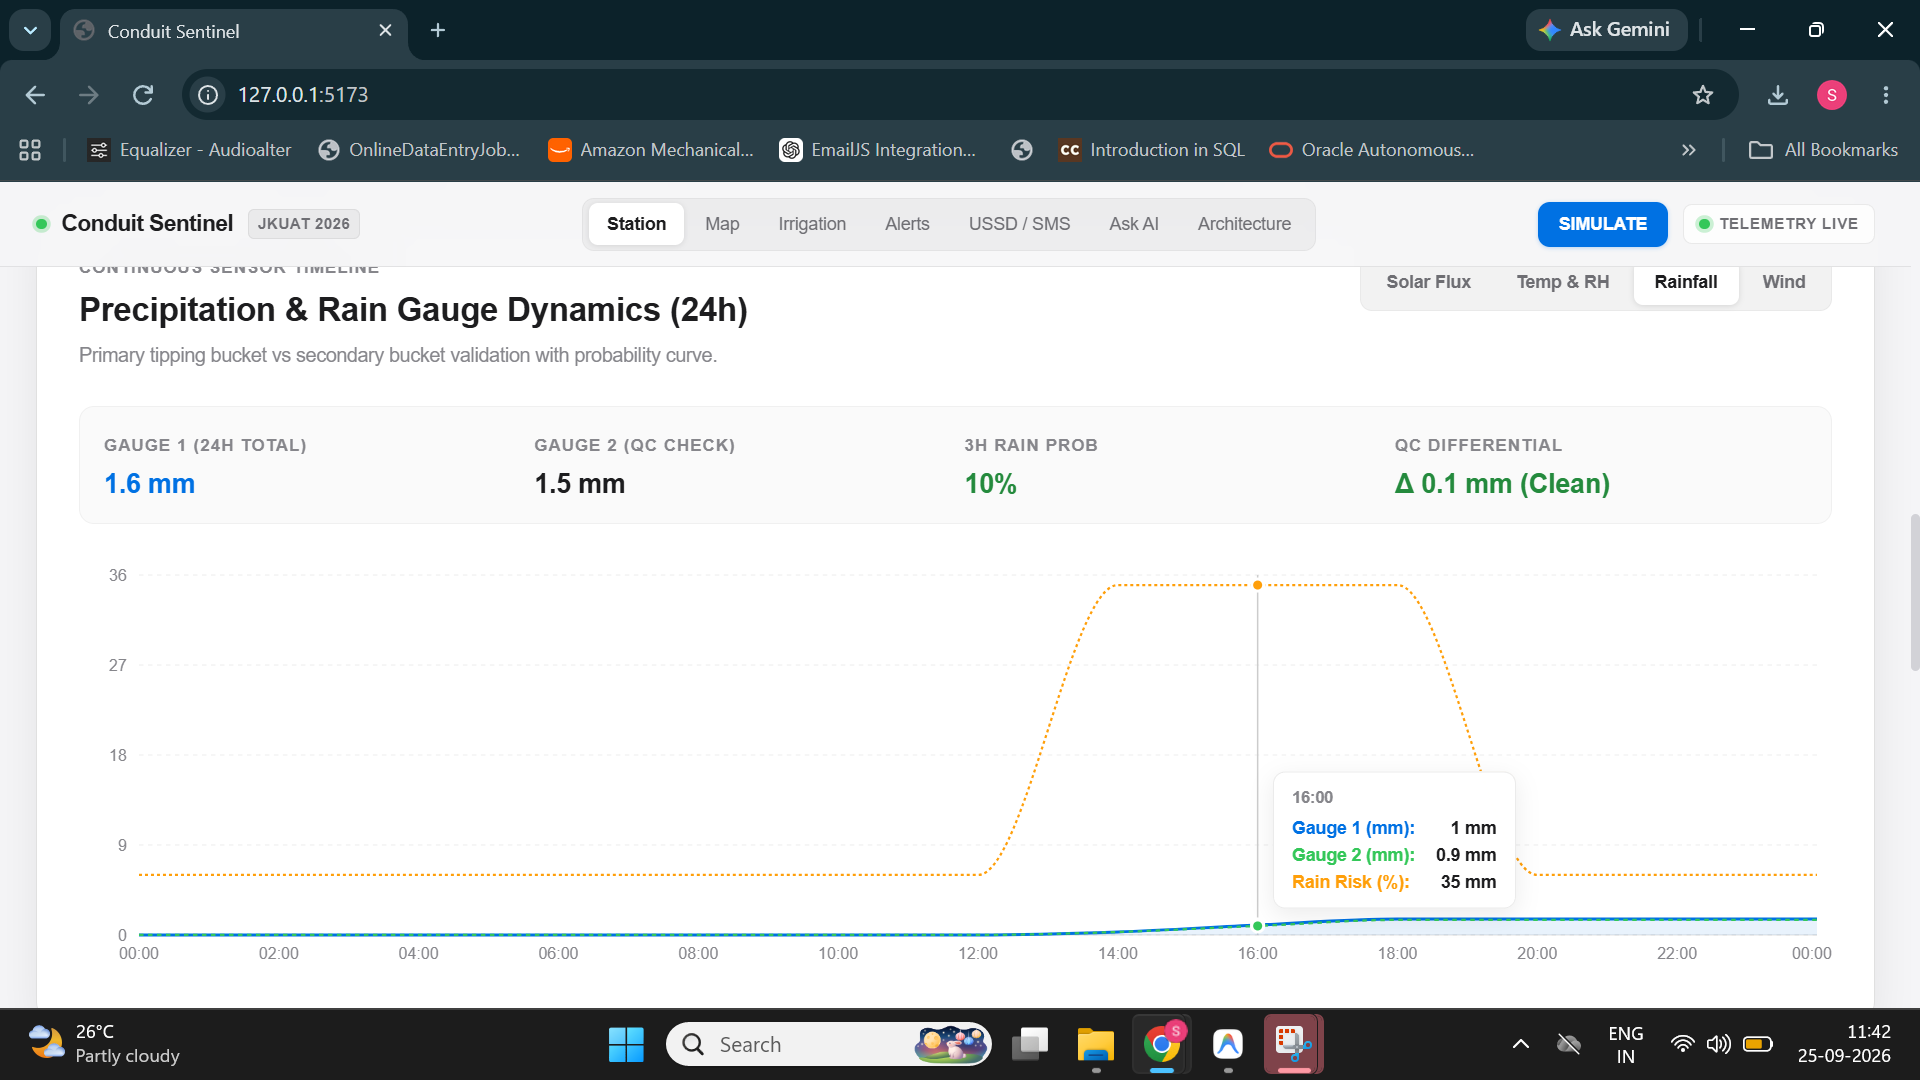
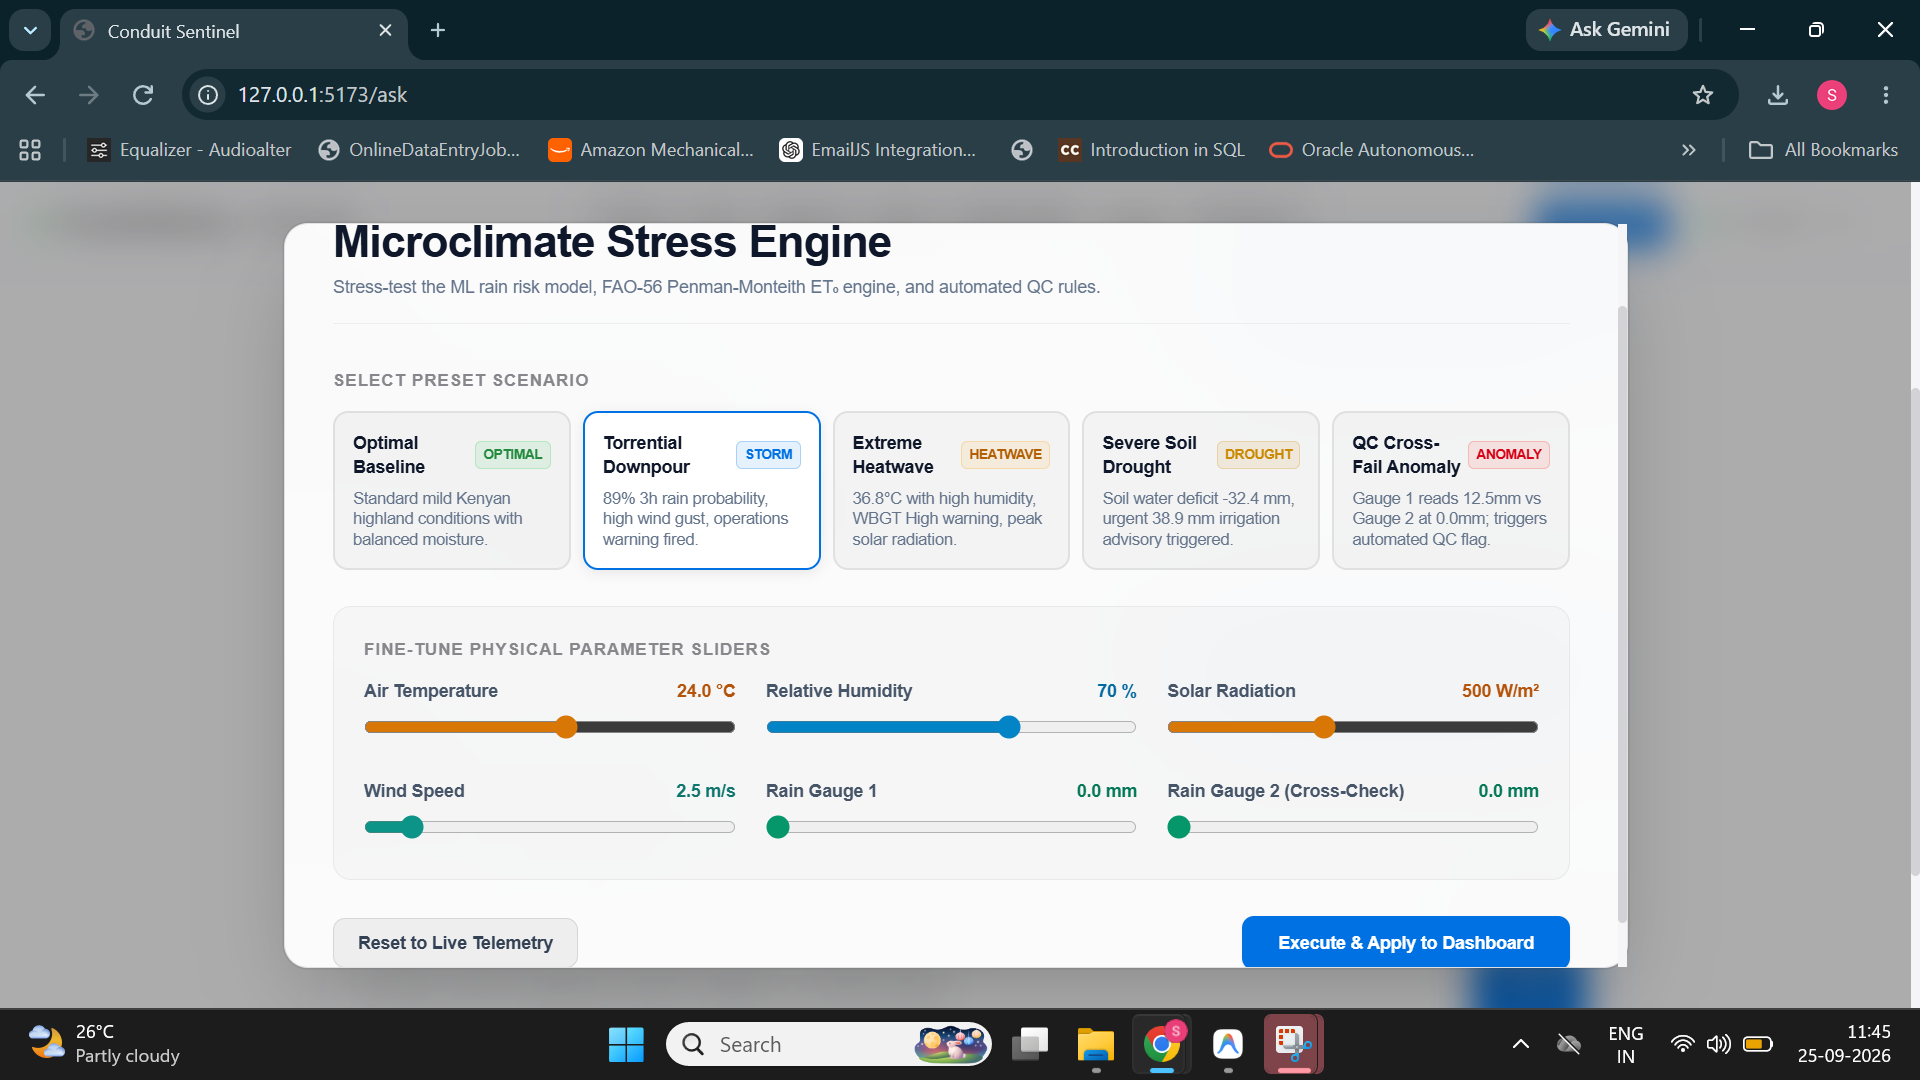
Data pipeline. A Bronze → Silver → Gold medallion architecture in Python (Pandas, PyArrow/Parquet). Silver applies QC flags instead of silently dropping bad readings. One check cross-validates the station's two rain gauges:
$$|R_1 - R_2| \le \epsilon$$
When they diverge, Sentinel raises a HARDWARE_FAULT and falls back to a single gauge.
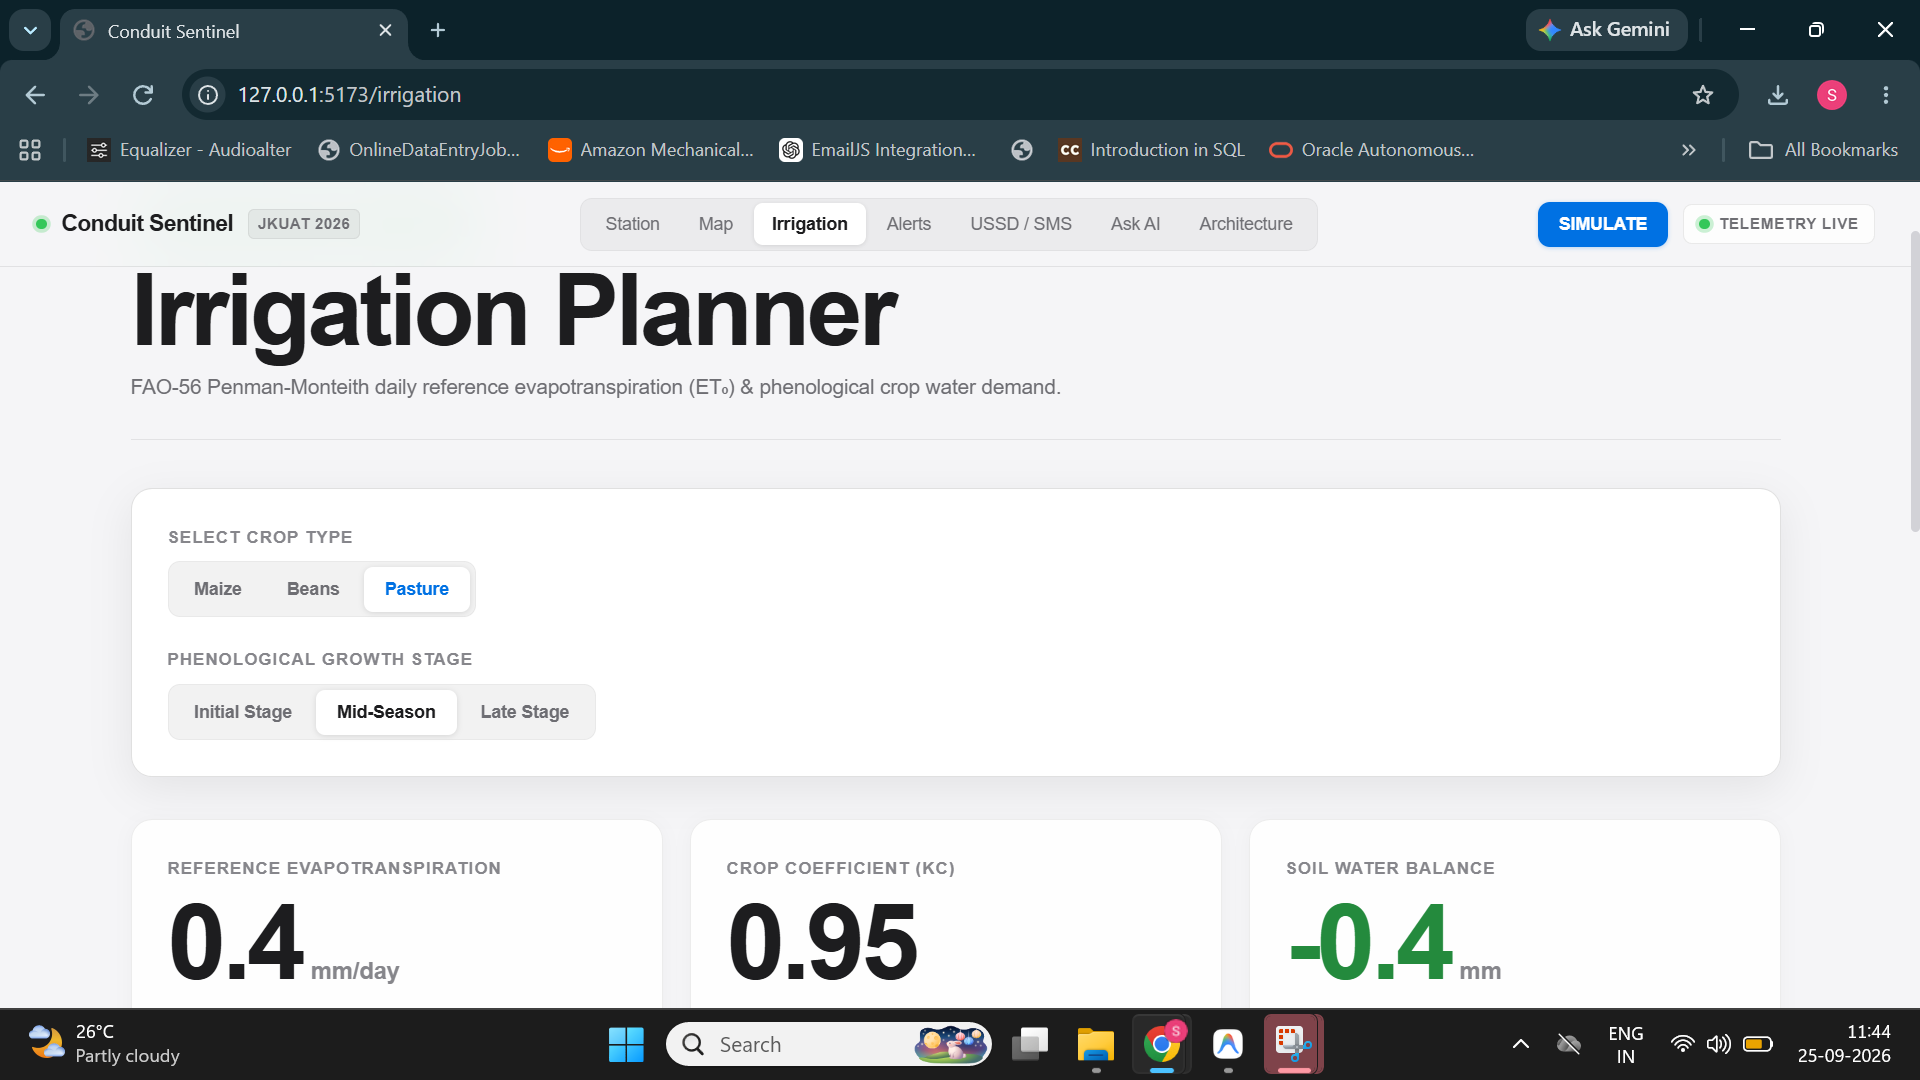
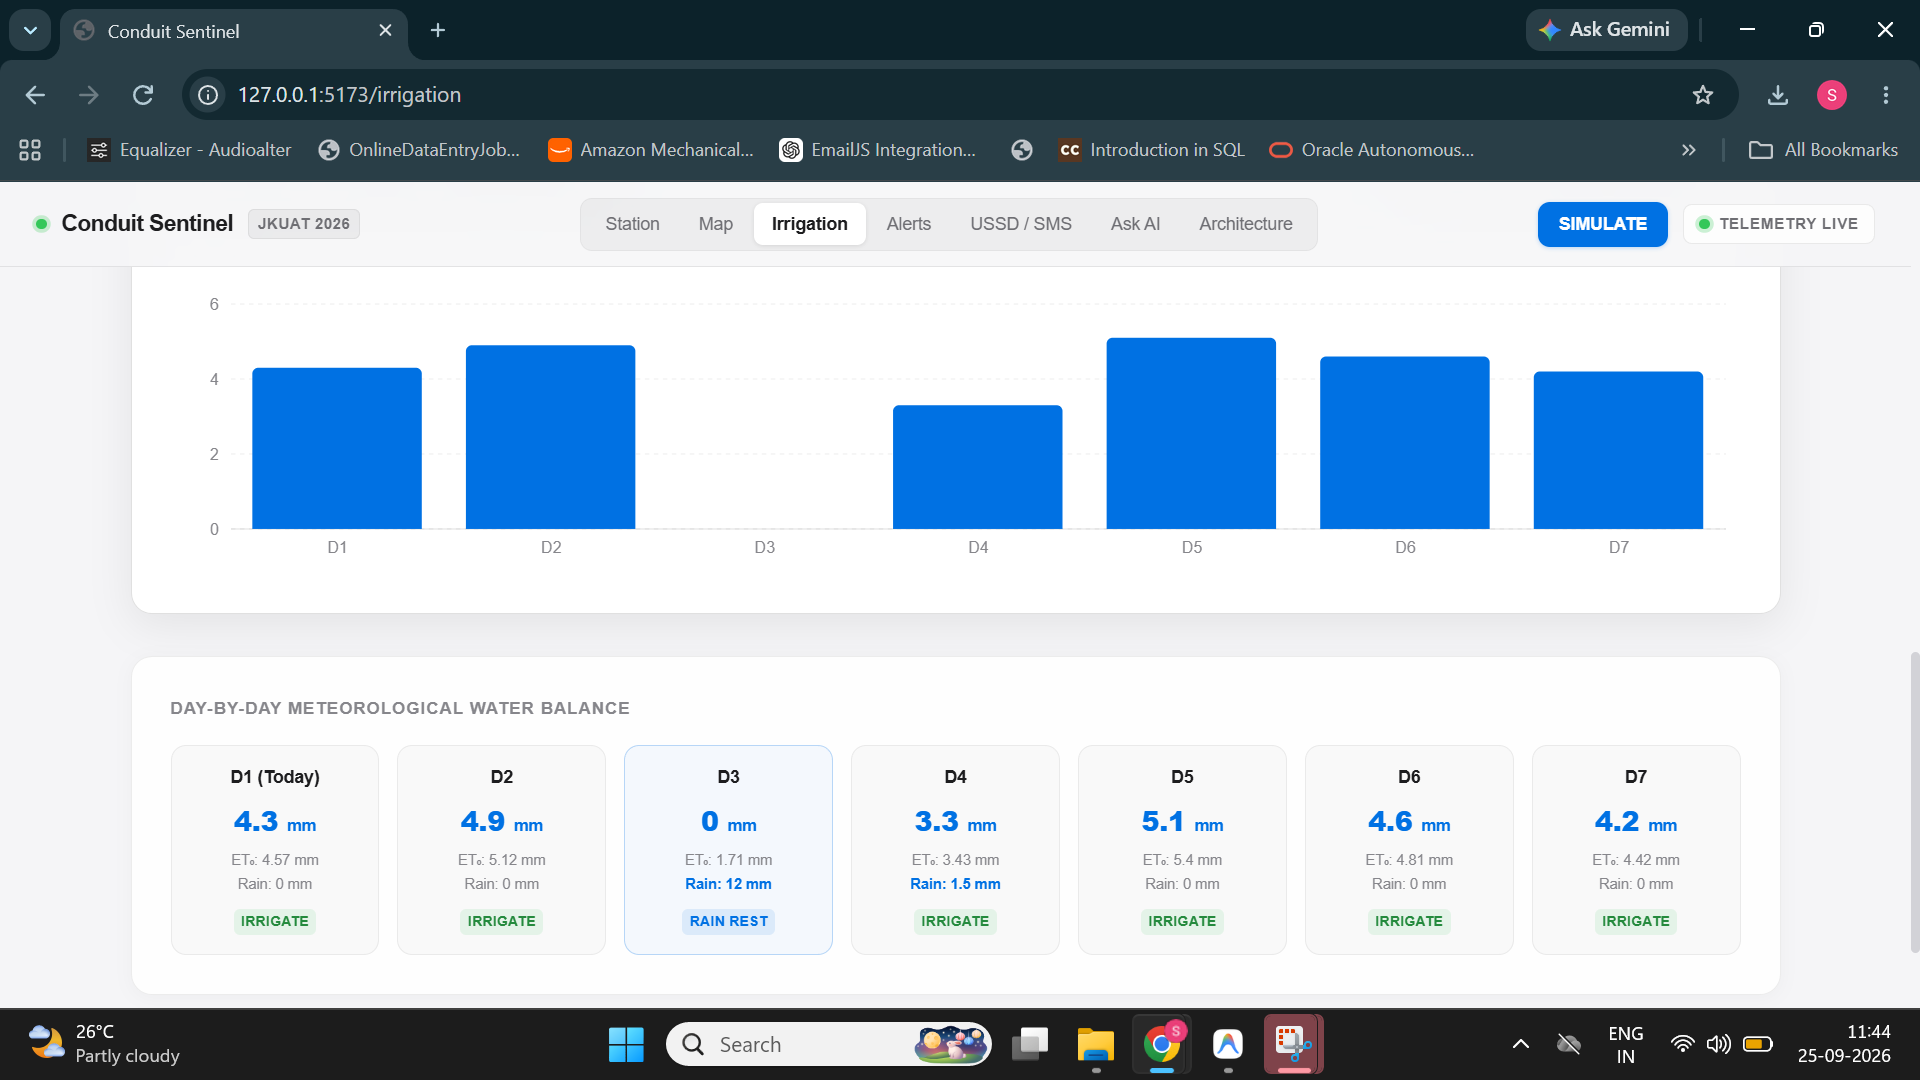
Physics first. Crop water demand comes from the FAO-56 Penman-Monteith equation, solved on every update:
$$ET_0 = \frac{0.408\,\Delta (R_n - G) + \gamma \frac{900}{T + 273} u_2 (e_s - e_a)}{\Delta + \gamma (1 + 0.34\,u_2)}$$
Crop-specific demand is $ET_c = K_c \times ET_0$, and a root-zone water balance tracks the soil reservoir:
$$S_t = S_{t-1} + P_t - ET_{c,t}$$
If rainfall covers the deficit, the planner issues a Rain Hold and skips irrigation.
Models and decisions. Five modules (rain risk, sensor anomaly detection, radiation calibration, ET₀, and heat/WBGT) feed a rule-based decision engine. Open-Meteo forecasts are bias-corrected against the station's ground truth, and NASA POWER data fills in historical climatology.
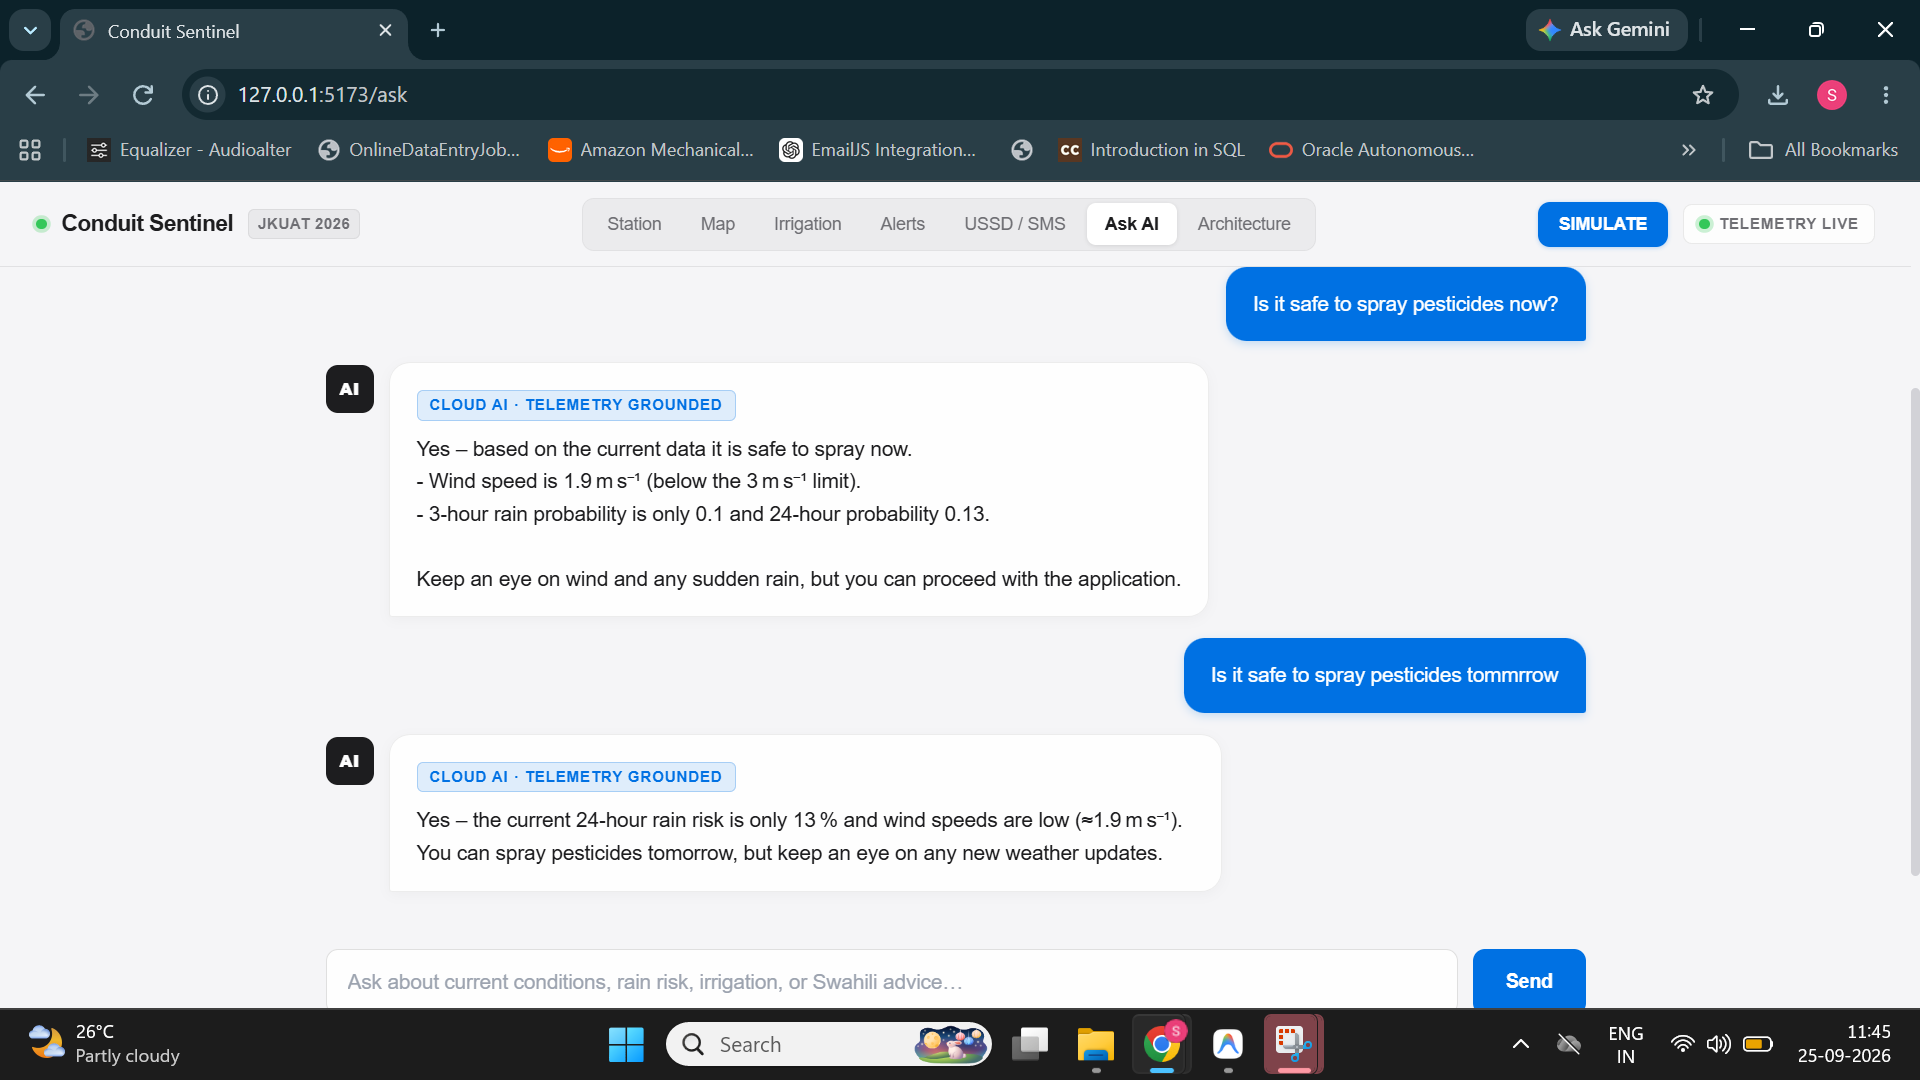
Serving and interface. A FastAPI backend serves the frontend (React 18 + TypeScript + Vite, with Leaflet maps and a Three.js globe). Ask Sentinel, our AI agent, uses Groq/Gemini LLMs but may only narrate numbers returned by the API. An offline rule-based engine takes over when there's no internet or the quota runs out.
Challenges we faced
- No live history yet. We couldn't get portal credentials during development, so we built and tested on labelled demo climatology and surrogate data. The rain nowcast currently ships with a persistence baseline, $p_{\text{rain},3h} = \text{clip}(R_{3h}/5,\ 0,\ 1)$, and is designed to switch to LightGBM once real events are ingested. We chose to say that plainly rather than report metrics we don't have.
- Stopping the LLM from hallucinating. Farm advice has to be trustworthy, so we grounded the agent strictly in API outputs, attached evidence to every advisory, and built a deterministic fallback.
- The last mile. Most climate tools assume a smartphone. Designing for USSD menus and short SMS forced us to compress complex analysis into one clear instruction.
- Messy sensors. Real stations drift, clog and drop readings, so QC had to flag problems visibly rather than hide them.
What we learned
We learned how much agronomy sits behind a single irrigation number, from psychrometric constants to crop coefficients by growth stage. We learned that physics models make ML and LLMs more trustworthy, not less. And we learned that the hardest part of "data to impact" is the last step: saying one clear thing to the person who has to act on it.
What's next
The pipeline is station-agnostic, so the next step is plugging in weather stations closer to home in India. We also want to retrain the rain model on live events and publish honest back-test metrics.
Built With
- fastapi
- google-gemini
- groq
- leaflet.js
- lightgbm
- nasa-power
- numpy
- open-meteo
- pandas
- pvlib
- pyarrow
- pydantic
- pytest
- python
- python-telegram-bot
- react
- react-three-fiber
- recharts
- scikit-learn
- supabase
- tailwindcss
- three.js
- typescript
- uvicorn
- vite


Log in or sign up for Devpost to join the conversation.