-
-
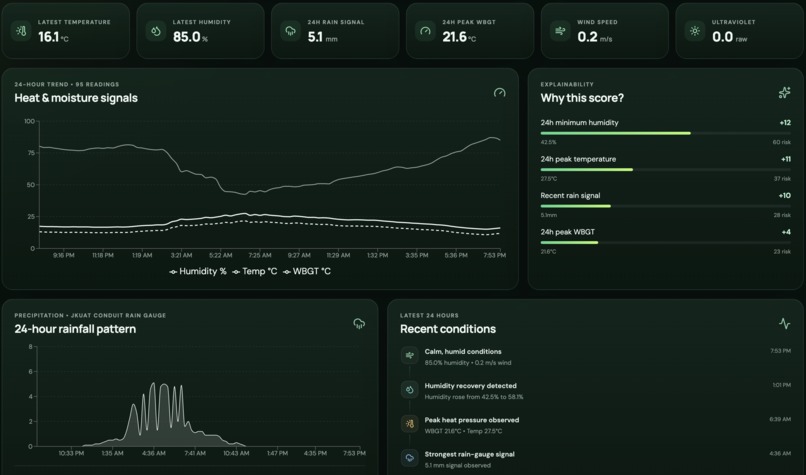
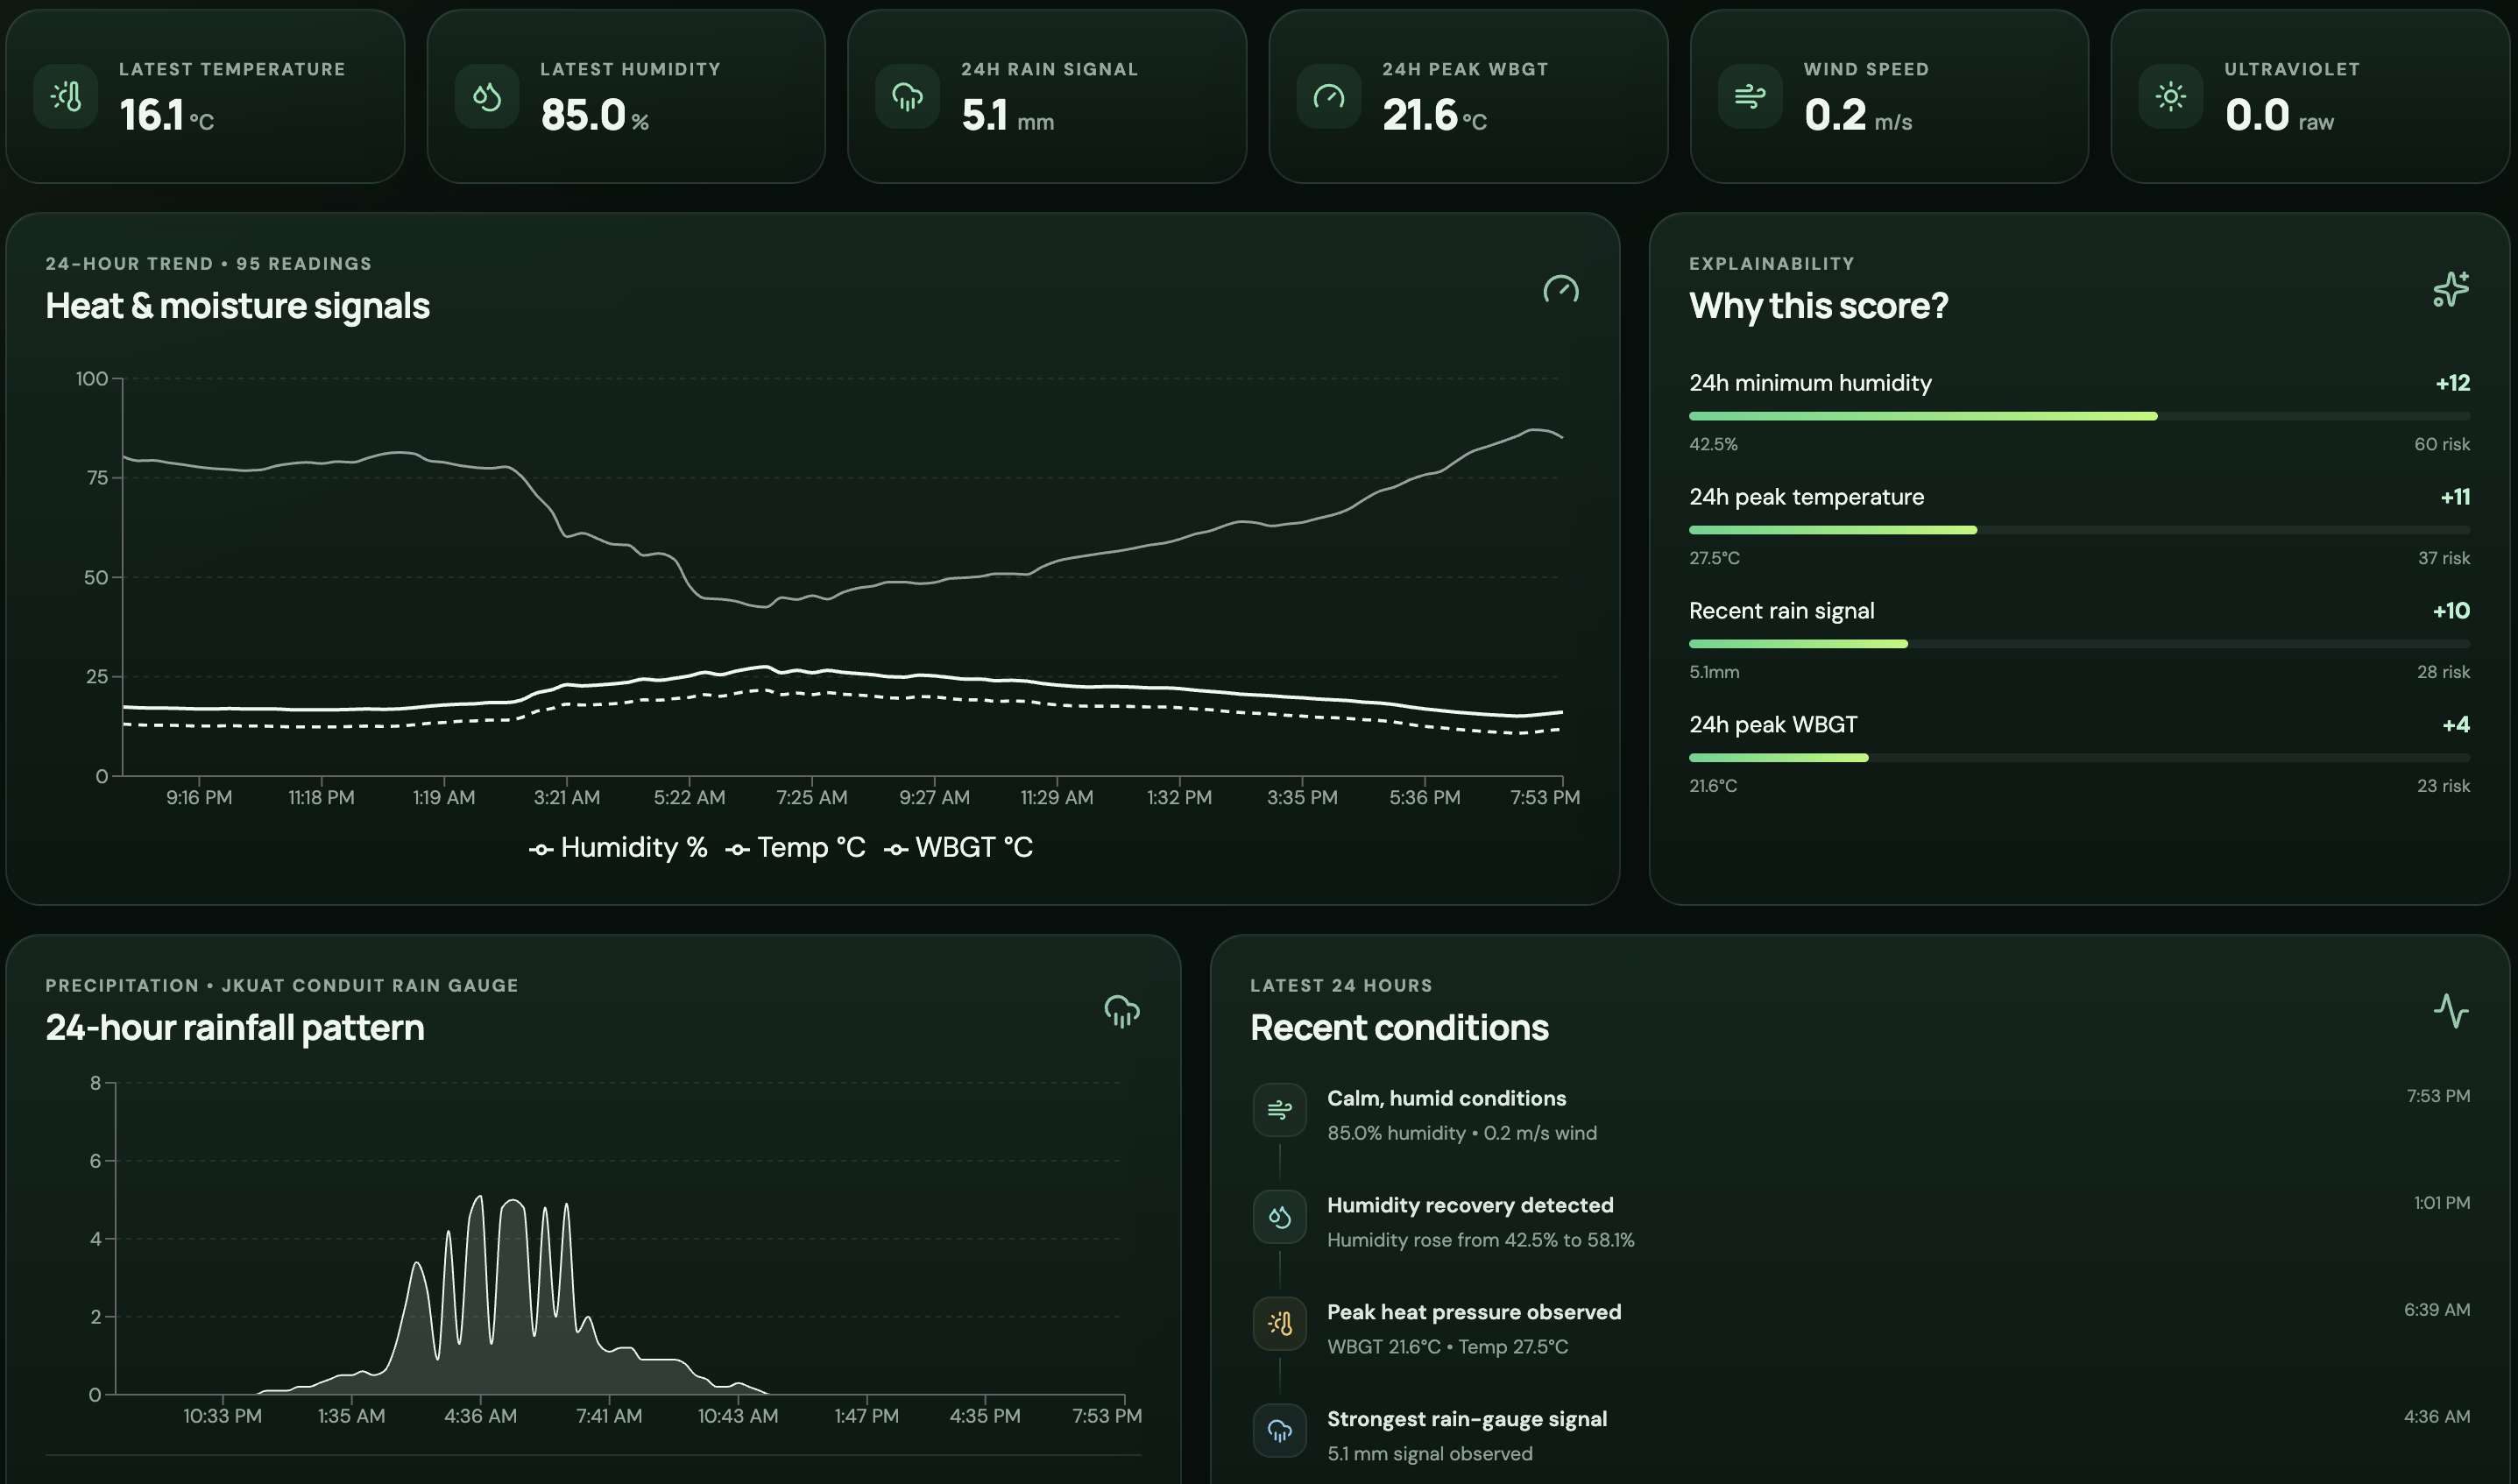
Conduit FarmGuard dashboard in action
-
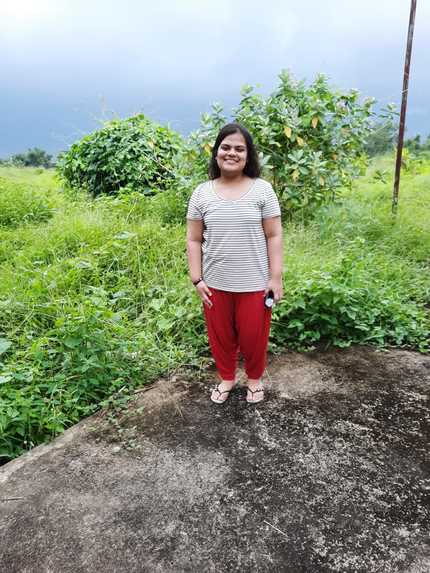
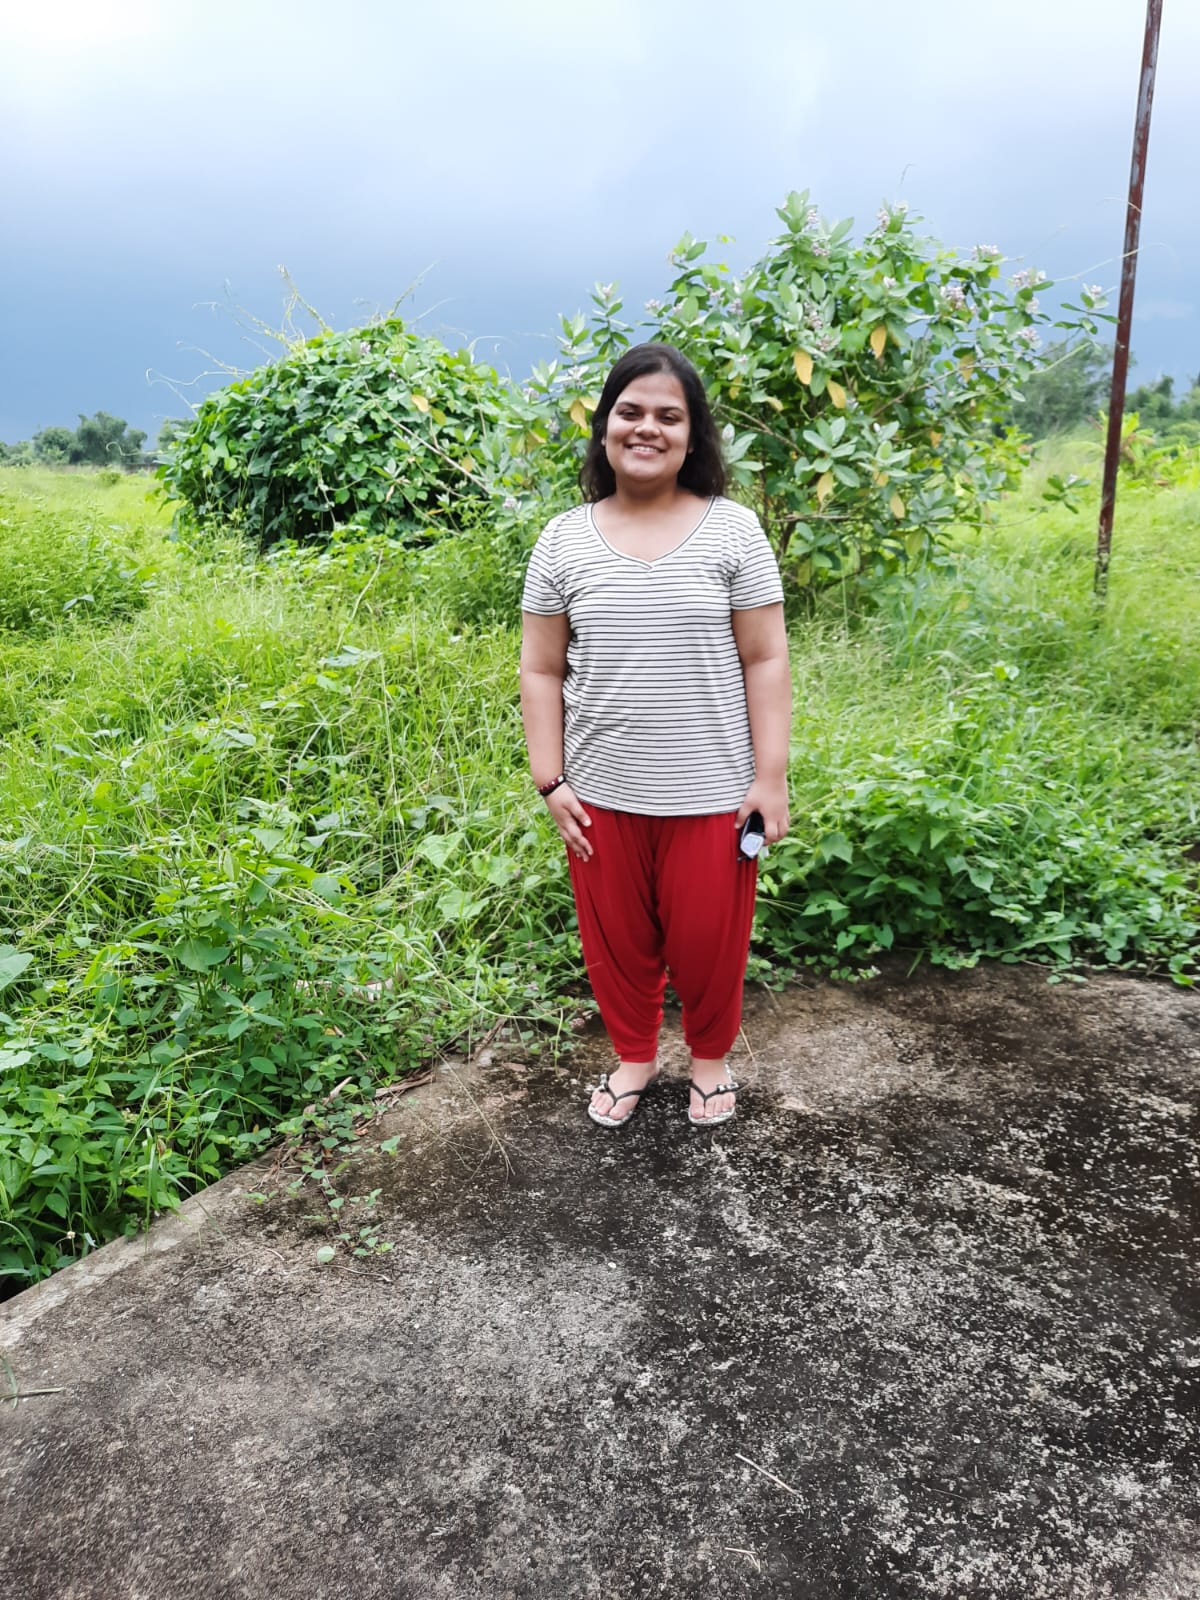
The inspiration behind FarmGuard: bringing practical agricultural intelligence back home.
Inspiration
Environmental monitoring systems collect large volumes of weather data, but raw readings alone do not always help people decide what to do next.
I built Conduit FarmGuard around a simple question:
How can I turn JKUAT Conduit weather observations into practical agricultural intelligence?
Instead of creating another dashboard that only displays temperature, rainfall, humidity, and wind, I wanted to build a tool that interprets those signals, identifies agricultural weather stress, explains why conditions matter, and suggests what should be checked in the field.
My guiding idea became:
Data → Insight → Decision → Action
What it does
Conduit FarmGuard transforms real JKUAT Conduit weather-station data into an explainable Agricultural Weather Stress Score from 0–100.
The current prototype analyzes 2,184 real Conduit observations across variables including temperature, relative humidity, rainfall signals, wind speed, heat index, wet-bulb measurements, WBGT, atmospheric pressure, and UV/solar readings.
FarmGuard provides:
A Low, Moderate, High, or Critical agricultural weather-stress assessment A transparent “Why this score?” breakdown A 24-hour environmental trend visualization A 24-hour rainfall pattern A Recent Conditions timeline A Recommended Field Action card with practical next steps An Ask FarmGuard assistant powered by Google Gemini
Importantly, Gemini does not calculate the risk score. The deterministic FarmGuard analytics engine creates the assessment first, and Gemini explains the result in natural language.
How I built it
I built FarmGuard as a modular data-to-decision pipeline:
JKUAT Conduit Data ↓ Python + Pandas ↓ Cleaning + 24-Hour Analytics ↓ Agricultural Weather Stress Engine ↓ FastAPI ↙ ↘ React Gemini Dashboard Explanation ↘ ↙ FarmGuard
I downloaded the environmental dataset directly from the JKUAT Conduit platform and used Python and Pandas to clean the readings, parse timestamps, calculate 24-hour environmental statistics, and prepare trend data.
The backend was built with FastAPI, while the frontend uses React, Vite, JavaScript, and Recharts.
For the AI layer, I integrated the Google Gemini API using the Google GenAI SDK. Gemini receives structured outputs from FarmGuard, such as the risk score and strongest contributing signals, and converts them into a clearer explanation for the user.
I also added a local fallback explanation so FarmGuard can continue working if Gemini is temporarily unavailable.
Challenges I ran into
One of my biggest challenges was adapting the initial concept to the actual data available in the Conduit export.
My early prototype assumed soil-moisture measurements would be available. After inspecting the real dataset, I discovered that the export I was using contained extensive weather observations but did not include soil moisture.
Rather than simulate or invent that information, I redesigned FarmGuard around agricultural weather stress and made field verification part of the recommendation.
Another challenge was deciding how to use generative AI responsibly. I did not want an LLM to become an unexplained decision engine, so I separated the system into two layers:
Deterministic analytics → AI explanation
I also encountered temporary Gemini API capacity errors during development, which led me to implement a local explanation fallback instead of allowing the feature to fail completely.
Accomplishments that I'm proud of
I'm especially proud that the final prototype uses real JKUAT Conduit data rather than synthetic data.
I also built an explainable risk engine where users can see exactly which environmental signals contributed to the final score instead of receiving a black-box prediction.
Another accomplishment was evolving the project from a simple analytics dashboard into a more complete decision-support experience:
Environmental observations → Risk assessment → Explanation → Field action
I'm also proud that the system remains useful even when Gemini is unavailable because the core analytics and local explanation still work independently.
What I learned
The biggest lesson was that more data does not automatically create better decisions. The valuable part is the layer between measurement and action: identifying which signals matter, communicating uncertainty, and translating analytics into something understandable. I also learned the importance of designing around the data that actually exists rather than forcing the data to fit an initial product idea. Finally, I learned that generative AI can be especially useful as an explanation layer. Instead of replacing the analytical engine, Gemini helps communicate what the system already found.
What's next for Conduit FarmGuard
The next step is moving from an exported dataset to a live Conduit data integration, allowing FarmGuard to continuously analyze new environmental observations.
I would also like to expand FarmGuard to support:
•Multiple farms and weather stations •Soil-moisture sensors when available •Crop-specific and growth-stage-specific thresholds •Automated early-warning alerts •Historical comparisons and longer-term trend analysis •SMS or mobile notifications for farmers and extension workers
Longer term, I see FarmGuard becoming a reusable agricultural decision-intelligence layer built on top of environmental sensing infrastructure like the JKUAT Conduit.

Log in or sign up for Devpost to join the conversation.