Inspiration
I was pricing a small concrete pad and kept running into the same kind of online calculator: multiply the square footage by one price per square foot, then put the visitor's city name on the page. When I changed the city, the name changed and the price stayed the same.
Real quotes don't behave like that. A crew, a truck and the forms cost about the same to bring to a 40 sq ft pad as to a 400 sq ft slab, so small jobs cost far more per square foot. Labor rates also vary a lot from one metro area to the next. The U.S. government publishes good data on both wages and material prices, so I wanted a calculator that actually uses it and shows its work.
What it does
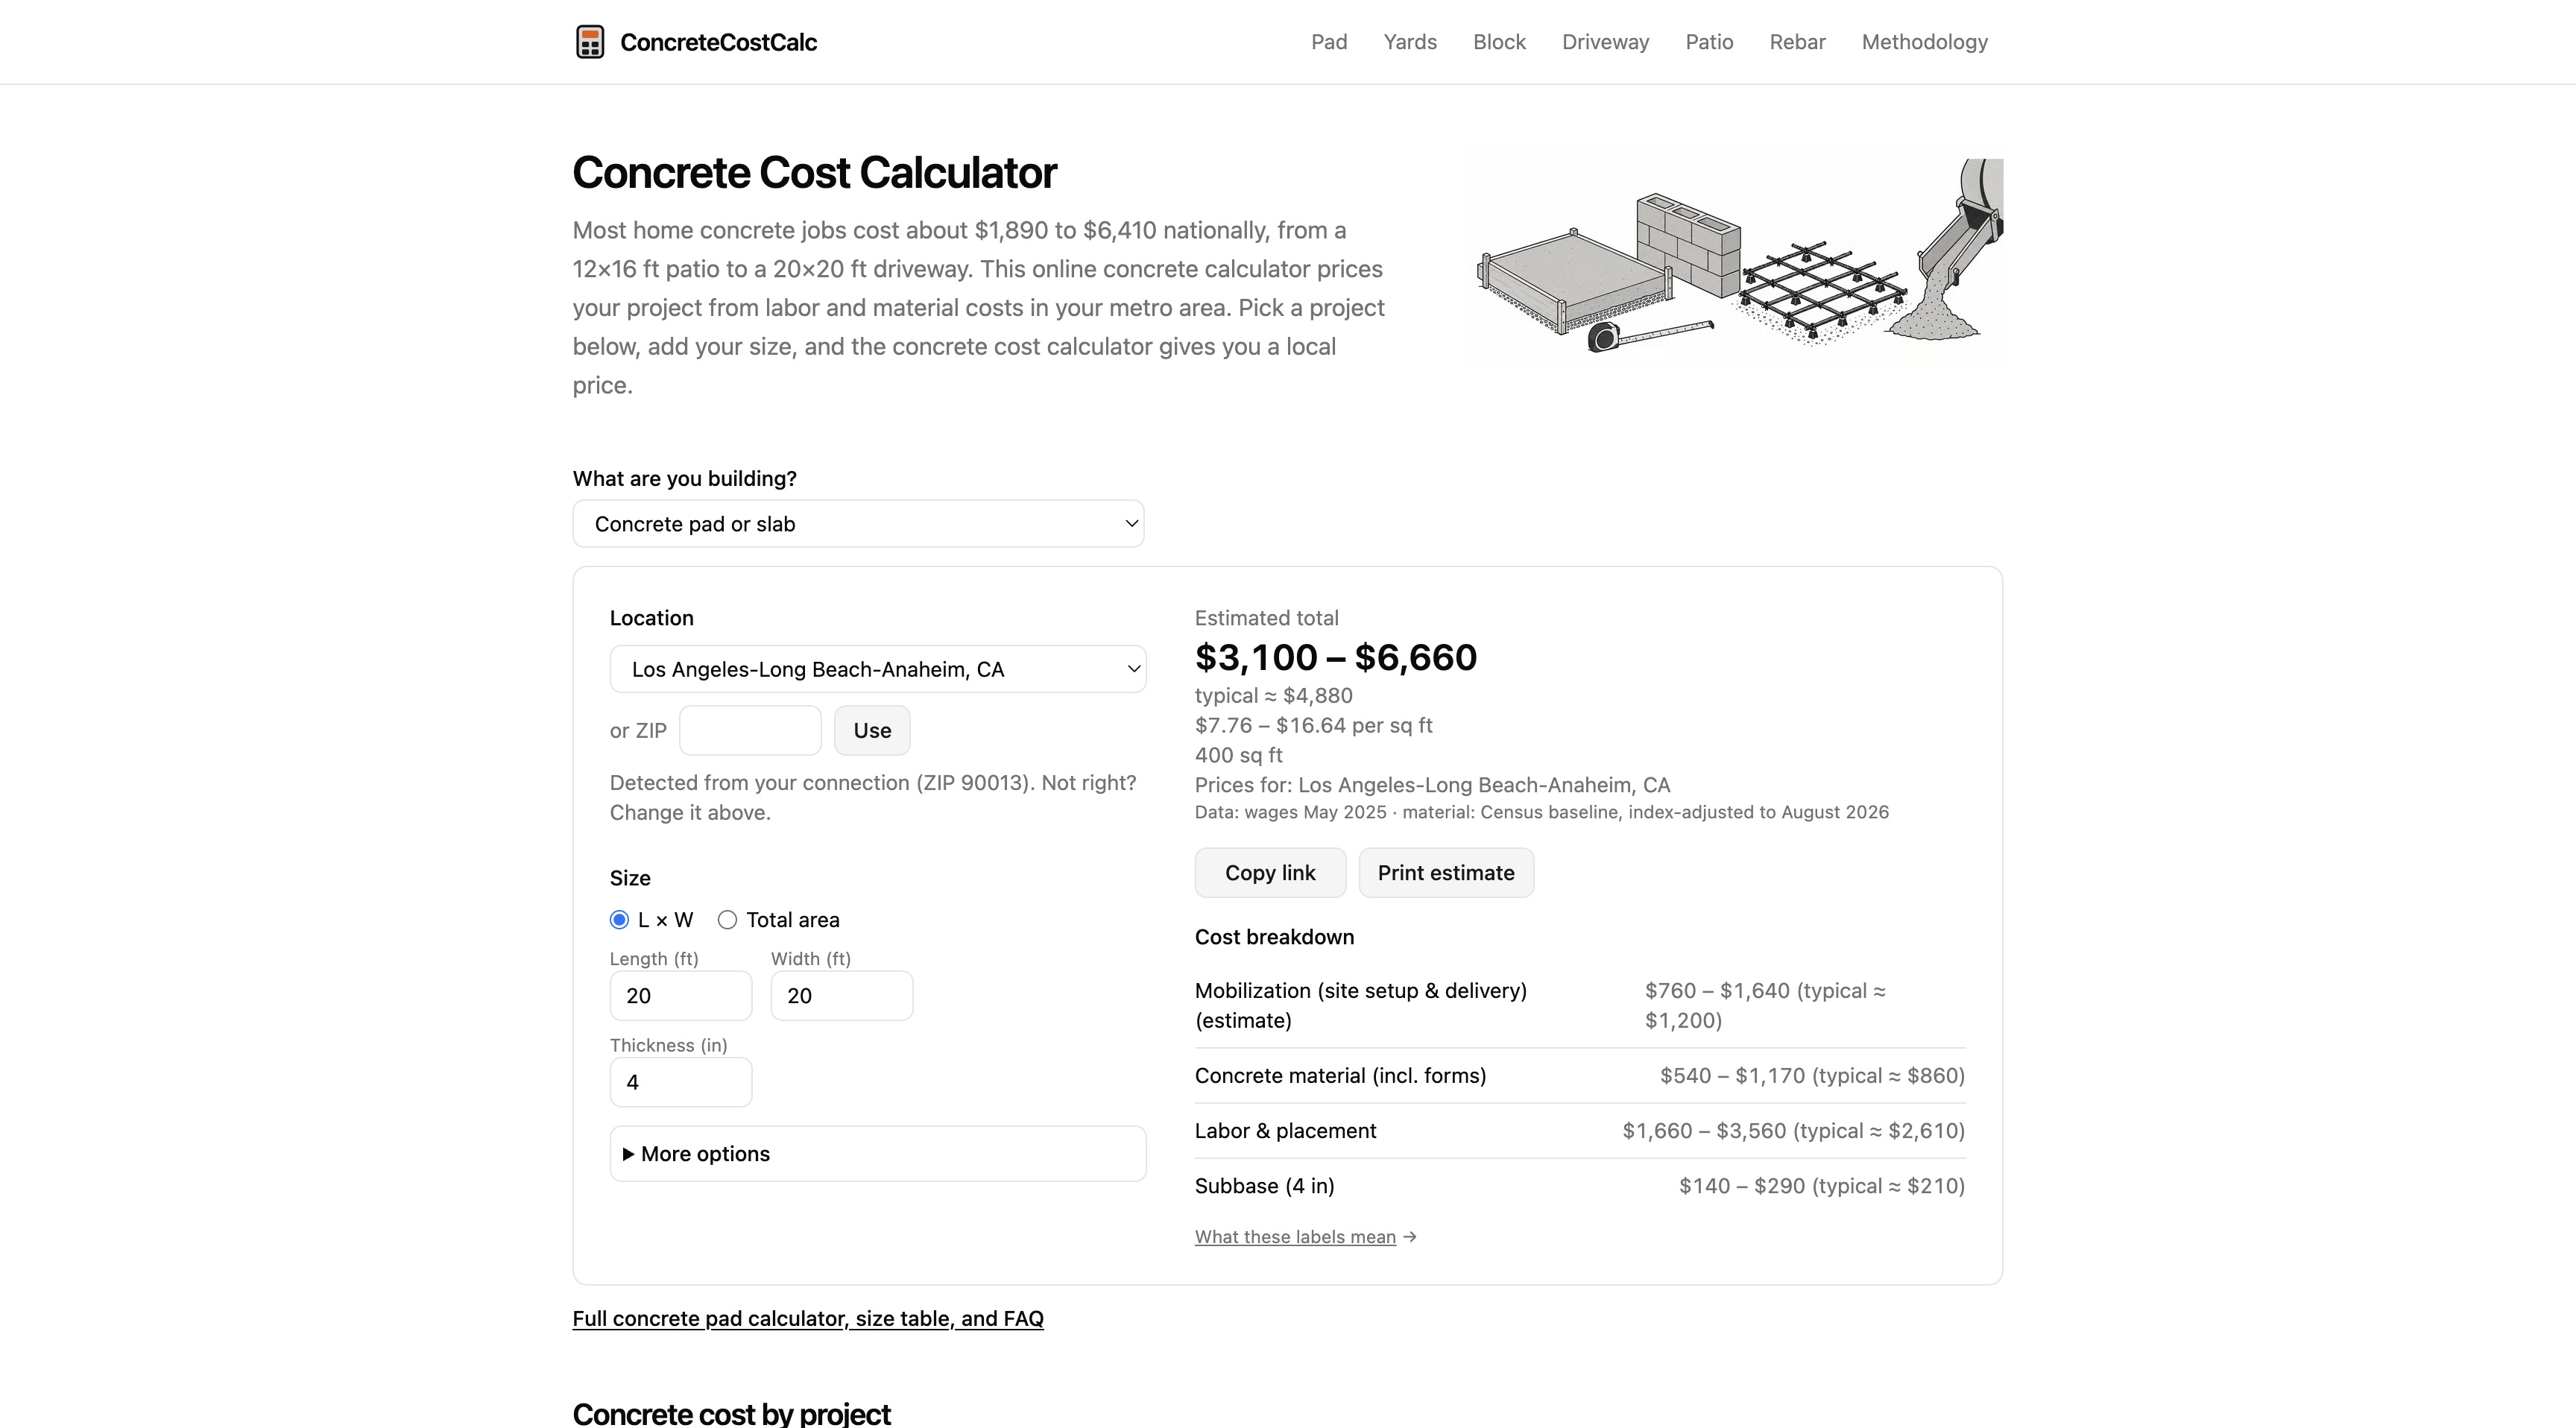
Concrete Cost Calculator (concretecostcalc.com) estimates what a home concrete job costs where you live. It covers six jobs: a concrete pad or slab, ready-mix by the yard, a concrete block wall, a driveway, a patio, and rebar.
You pick a job, enter the size, and enter a ZIP code. The calculator returns a price range for your metro area with a line-by-line breakdown. For the same 20×20 ft, 4 in slab:
- Houston: $2,750 to $5,500
- U.S. national average: $3,010 to $5,990
- San Francisco: $3,370 to $7,430
Every line in the breakdown is labeled SOURCED, CALIBRATED or ESTIMATE and shows its data source and date. You can share an estimate as a link or print it to take to a contractor.
How I built it
The cost model. Each estimate is a fixed setup cost plus the area times a marginal rate for material, labor and add-ons. That one change is what makes small jobs come out right. Nationally, an 8×5 ft pad runs $1,120 to $2,230, about $28 to $56 per sq ft, while a 20×20 ft slab runs $7.53 to $14.97 per sq ft. Applying the big slab's rate to the small pad would give $301 to $599, roughly a quarter of the model's estimate.
Labor by metro. Wages come from the Bureau of Labor Statistics Occupational Employment and Wage Statistics for cement masons and concrete finishers, covering 393 metro areas. A calibrated multiplier turns the wage into an installed labor rate. ZIP codes map to metros through HUD's ZIP-to-CBSA crosswalk.
Materials. Ready-mix prices start from the 2022 Economic Census and are brought forward each month with the BLS Producer Price Index. Census only publishes these figures nationally, so materials vary across the country plus four broad regions.
The site. It's built with Astro, React islands, TypeScript and Tailwind, and deployed on Cloudflare. Every page is prerendered and shows the national numbers first, so search engines and visitors see the same page. The calculator runs in the browser from a static rate file. The only server route is a small lookup that turns a ZIP code into a metro area, backed by Cloudflare D1.
Open source. The cost model and its tests are published under the MIT license at github.com/concretecostcalc/concrete-cost-model.
Challenges I ran into
- Data that fails without an error. Wage tables mix flags like
*and#into numeric columns, so a careless parser produces wrong numbers instead of crashing. I store those values as nullable numbers with a separate flag. - Gaps in coverage. Cement mason wages exist for 336 of the 393 metros. The rest fall back to the state level or a related occupation, and the breakdown says when that happened. About 4 in 10 ZIP codes aren't in any metro, so those get the national average, clearly labeled.
- Price indexes without prices. The Producer Price Index has no dollar units, and national and regional series use different base periods. I also had to check for series that stopped updating: two regional series once stayed at exactly the same value for five months.
- Line items that didn't add up. Rounding each line to the nearest $10 made the breakdown disagree with the total. I switched to the largest remainder method so the rounded lines always sum to the rounded total.
- A build that reported success with empty pages. One Astro and Cloudflare configuration built prerendered pages as 15-byte files reading
[object Object]. The build now fails if any page comes out suspiciously small.
Accomplishments that I'm proud of
- Changing the ZIP code really changes the price, and the breakdown explains why.
- Every input is traceable to a source and date, or openly marked as my own estimate.
- The known limits are published on the site next to the numbers.
- The cost model is open source, with tests anyone can run.
What I learned
Public data is good enough to build on, but every dataset has its own way of being wrong: flags inside numbers, suppressed cells, base periods, release dates that move. Most of the work went into finding those traps and making the fallbacks visible to the user.
I also learned that being upfront about uncertainty makes an estimate more useful. A range with its sources and limits gives a homeowner something concrete to discuss with a contractor, and a single precise-looking number hides how much real quotes vary.
What's next for Concrete Cost Calculator
- Better setup-cost evidence. The fixed setup cost is still my own calibrated figure, because there's no public dataset for it. I'm collecting real quotes to check it.
- Yearly data refresh. New wage data comes out once a year, and each release gets pulled in and checked.
- Large jobs. Estimates past about 1,000 sq ft likely run low, and I want to fix that once there's enough evidence.
- More job types. Steps, footings and walls are candidates, added only where enough people search for them to justify a dedicated page.
Every number on the site is a planning range. Get a written quote from a licensed contractor before you build.
Built With
- astro
- typescript

Log in or sign up for Devpost to join the conversation.