Inspiration
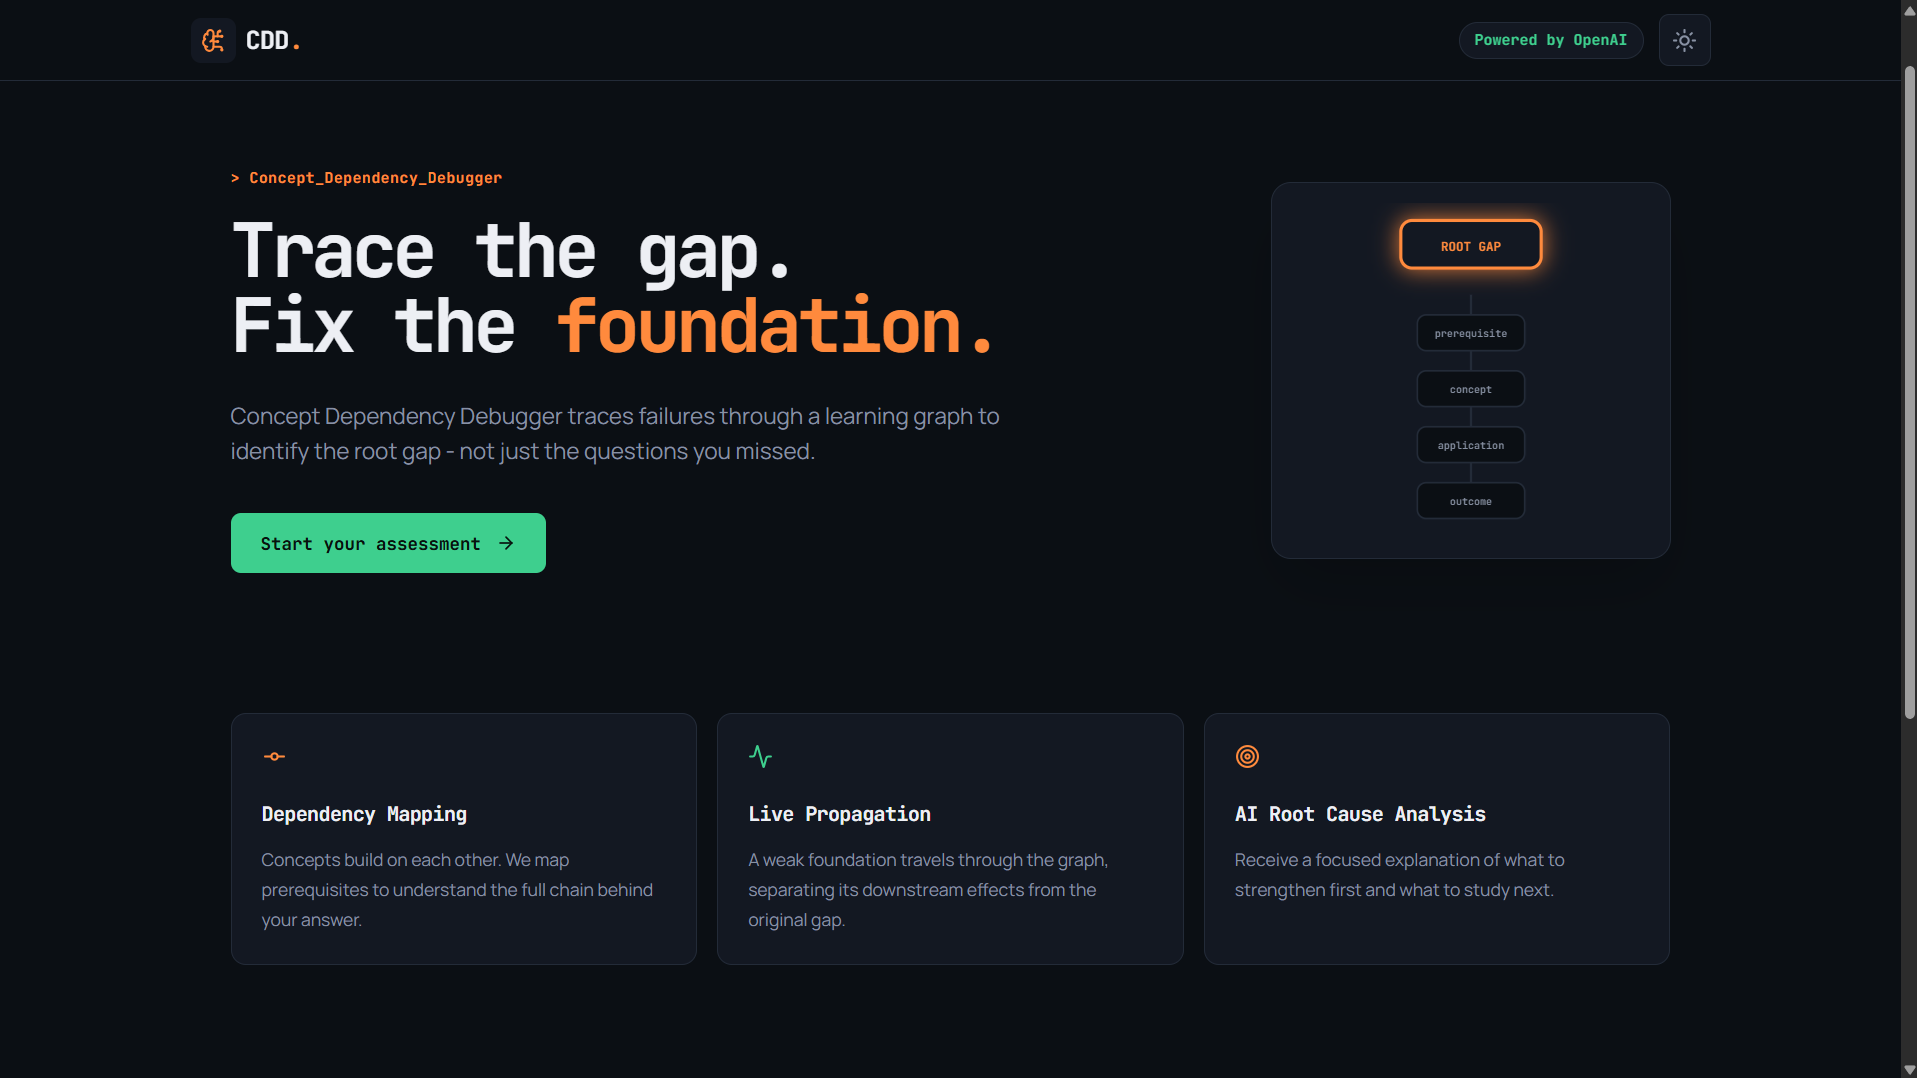
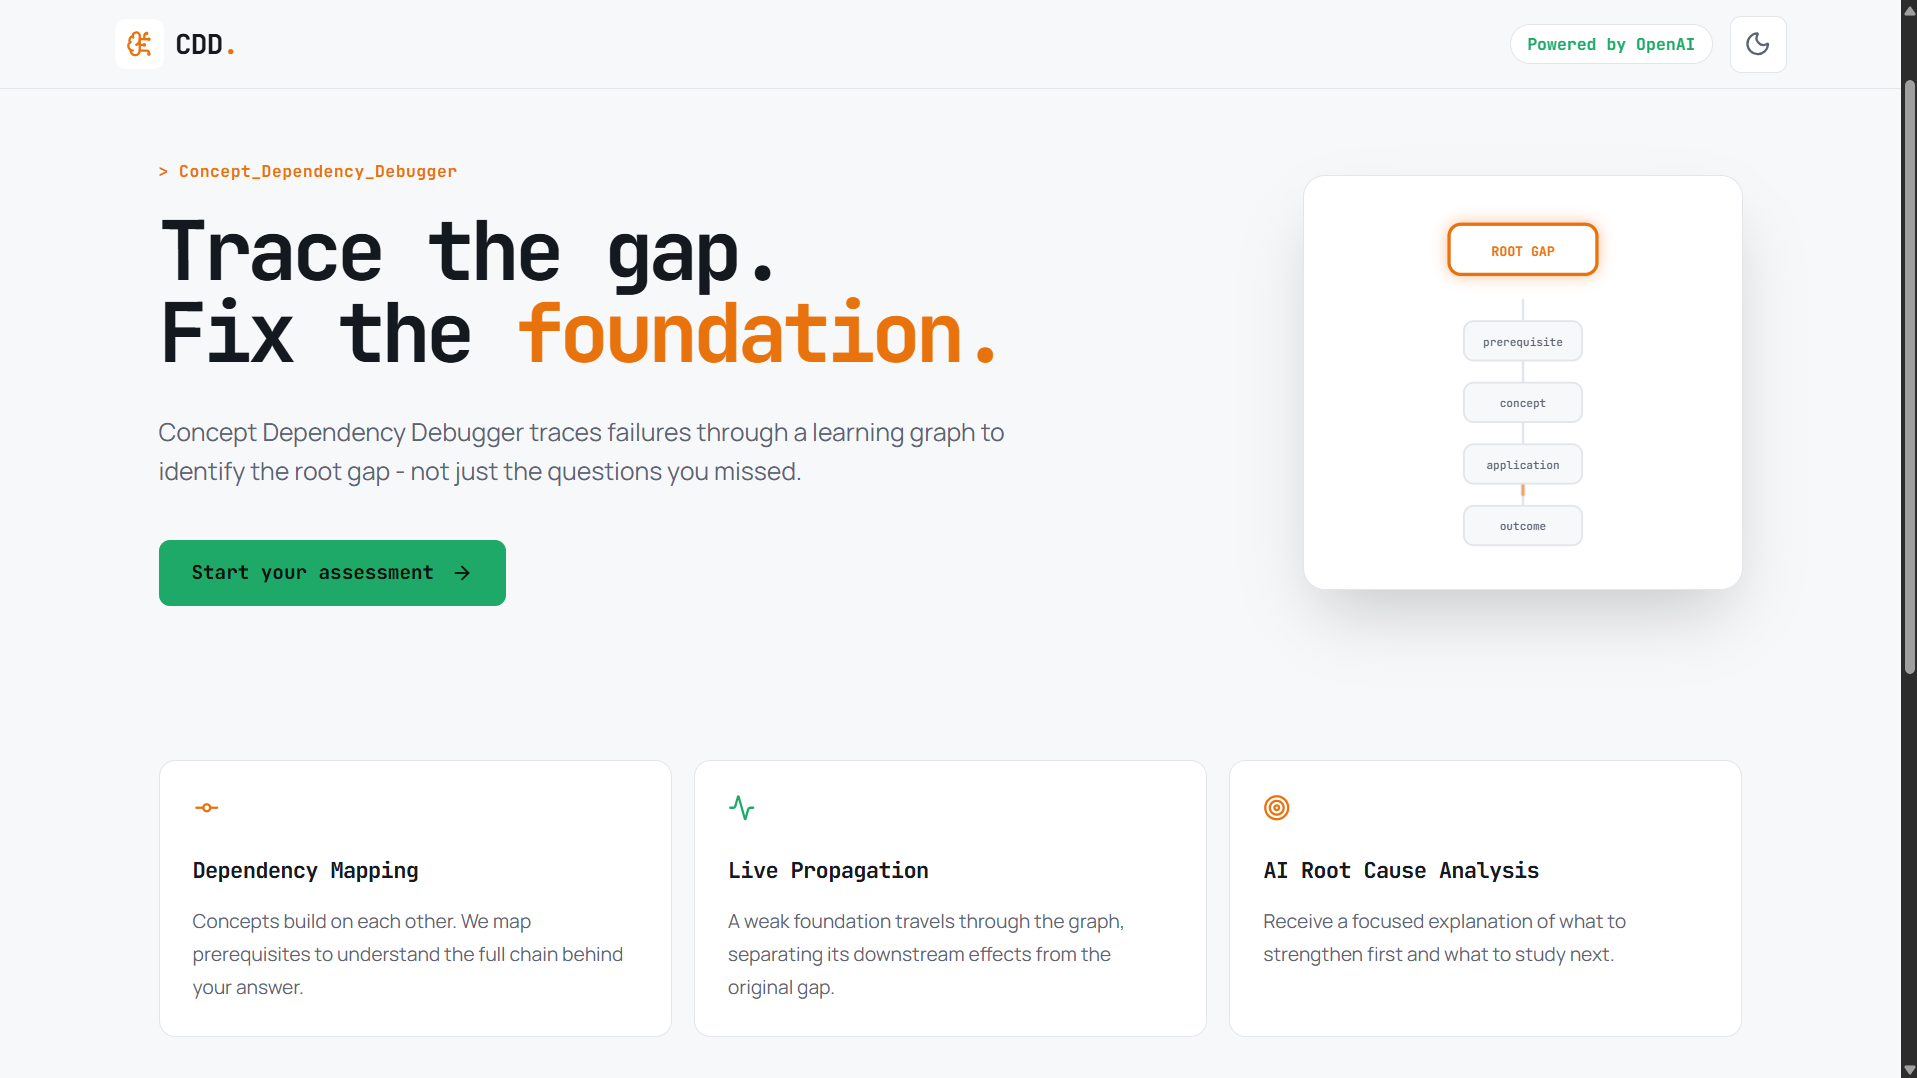
Every student has felt this: you fail a topic , the test tells you what you got wrong, and you go ' study that more'. But often the real problem isn't the topic you failed — it's something two or three concepts back that was never solid, quietly breaking everything built on top of it. Traditional tests score topics in isolation and can't see that. We wanted to build something that diagnoses the actual gap , not just the symptom on top of it.
What it does
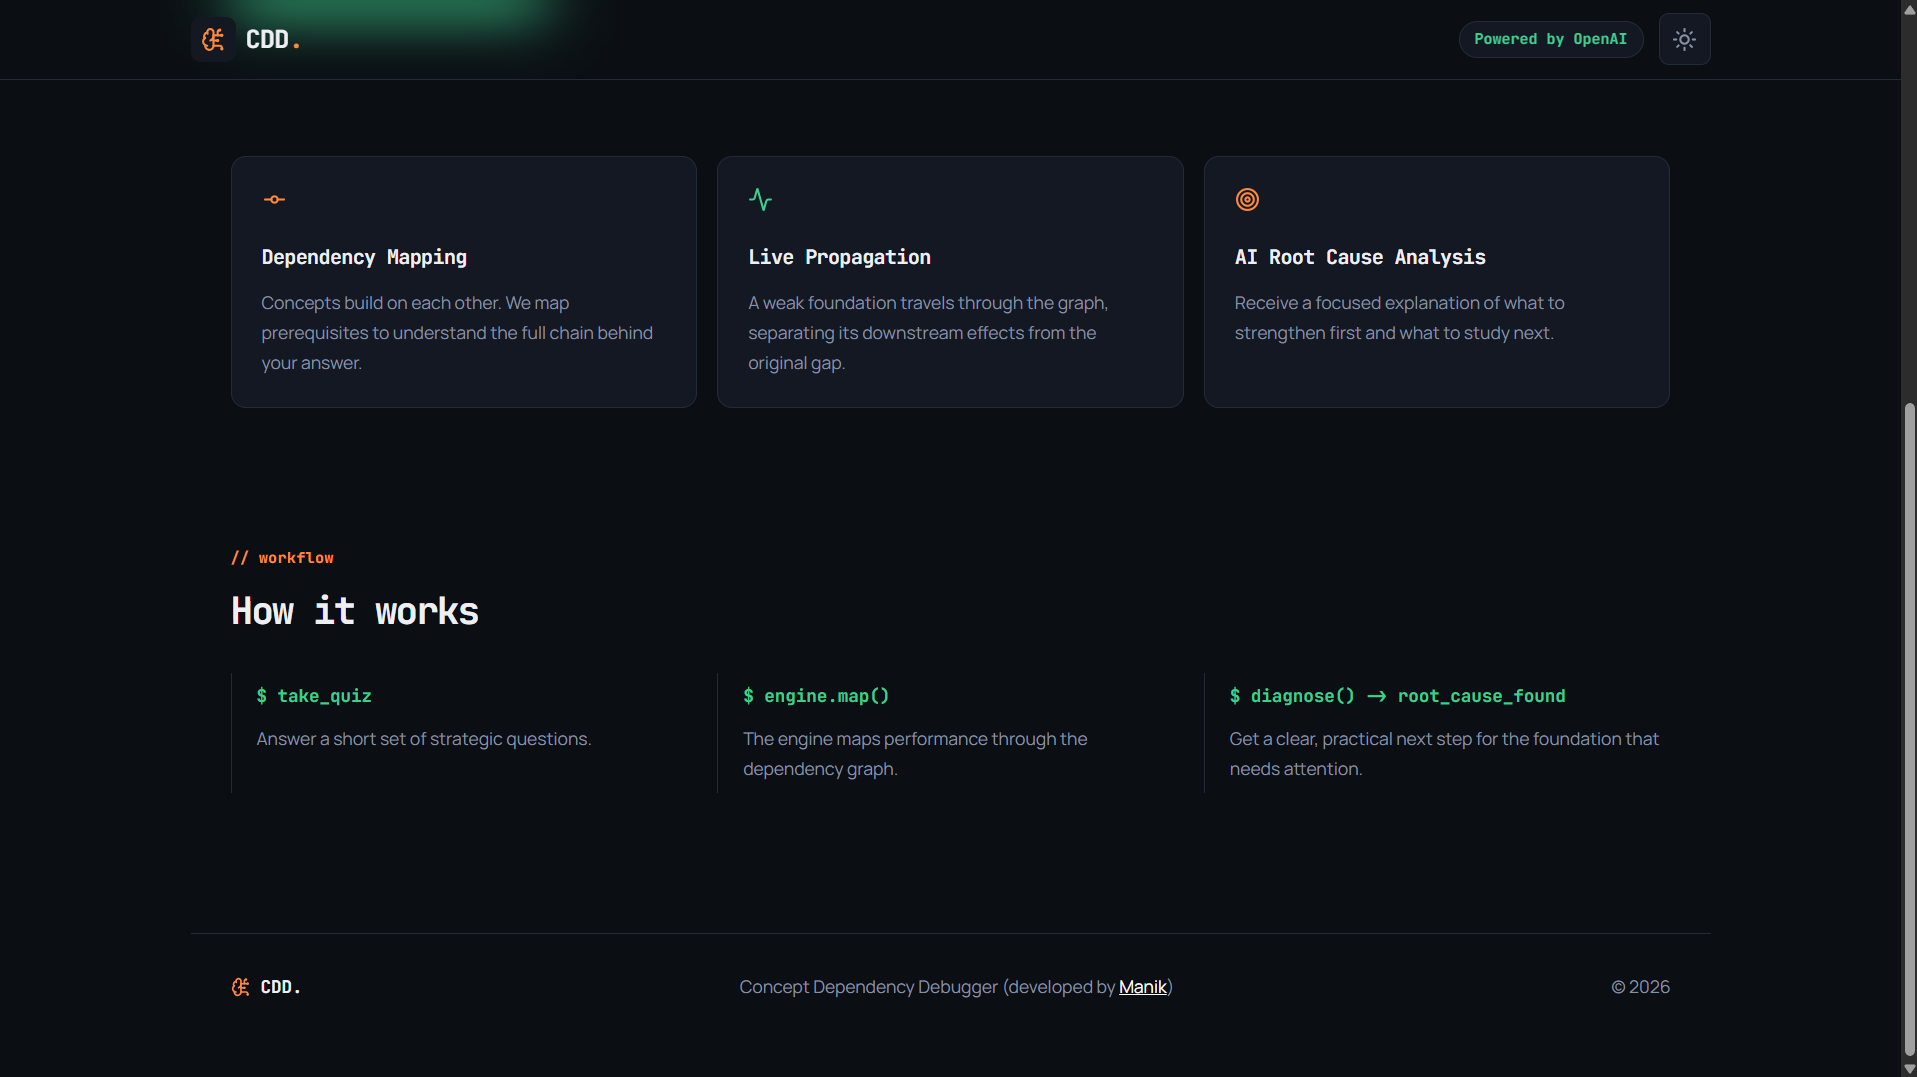
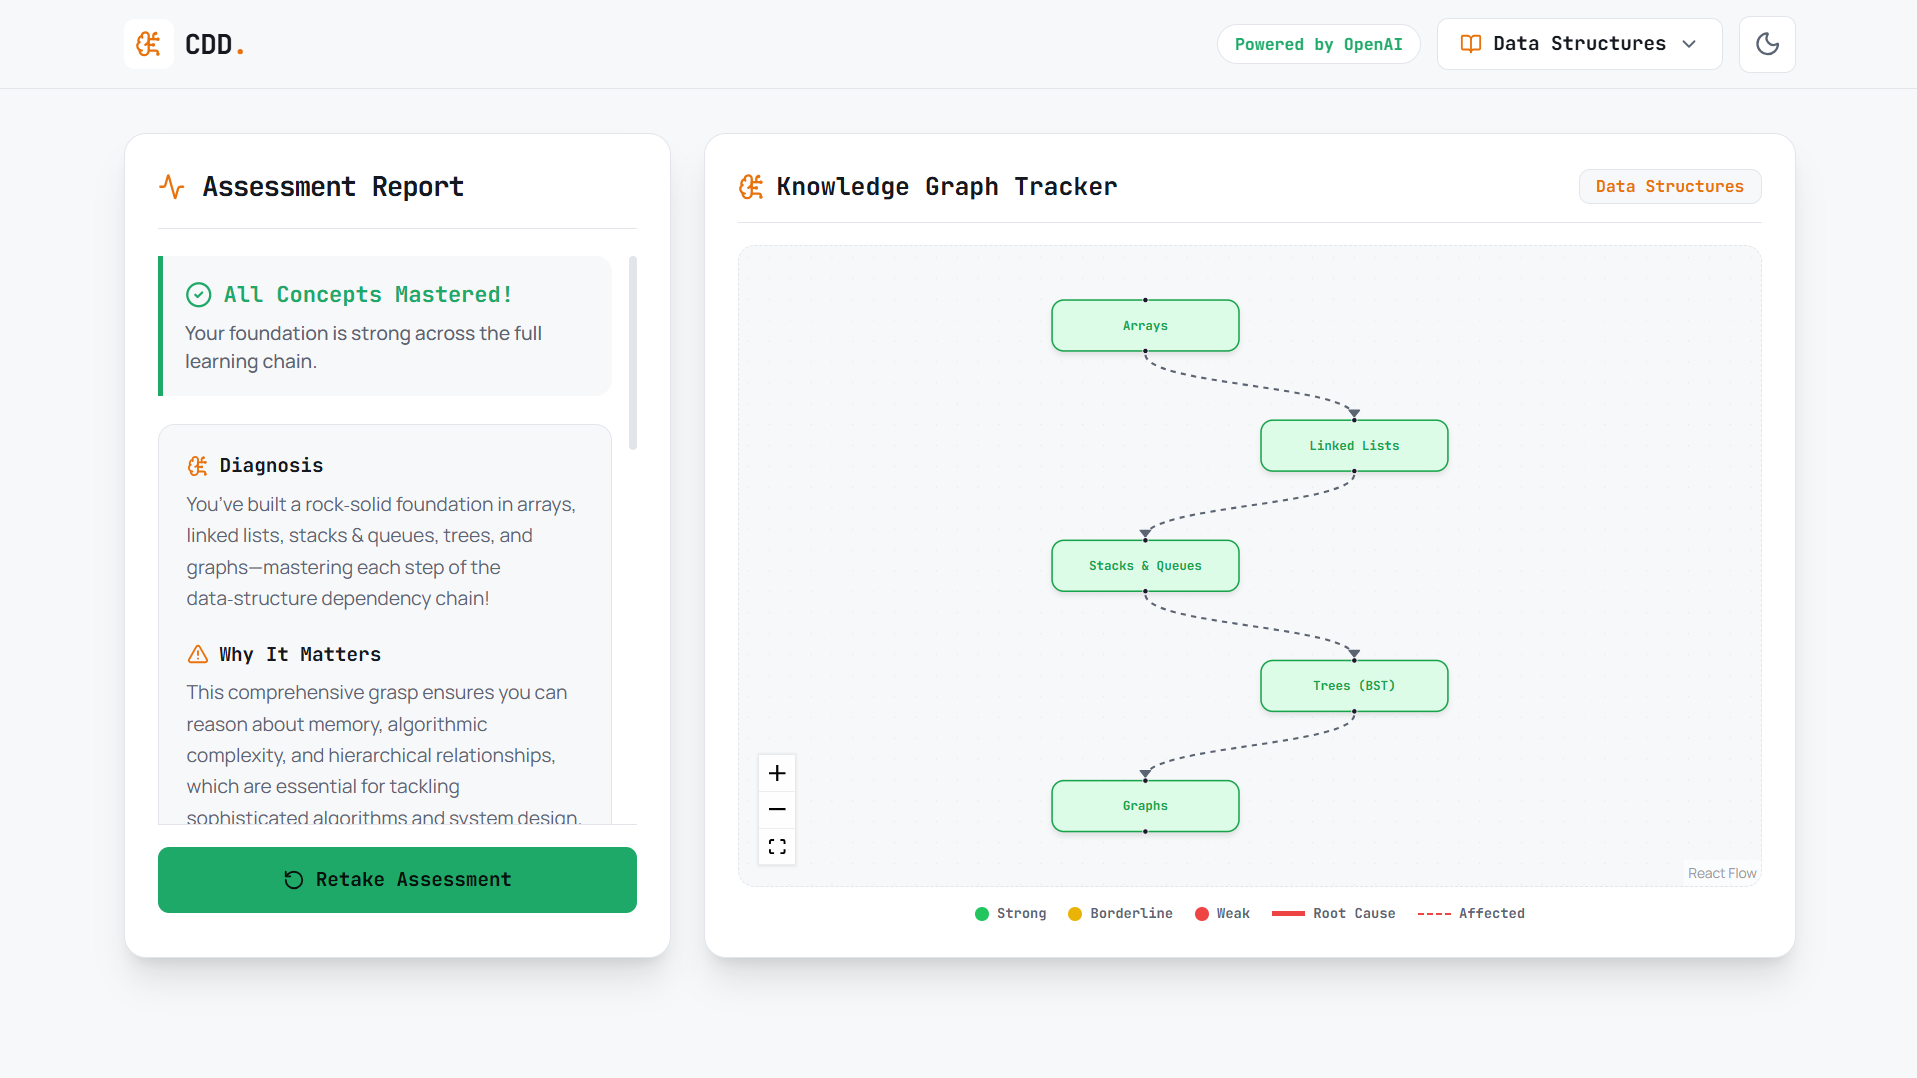
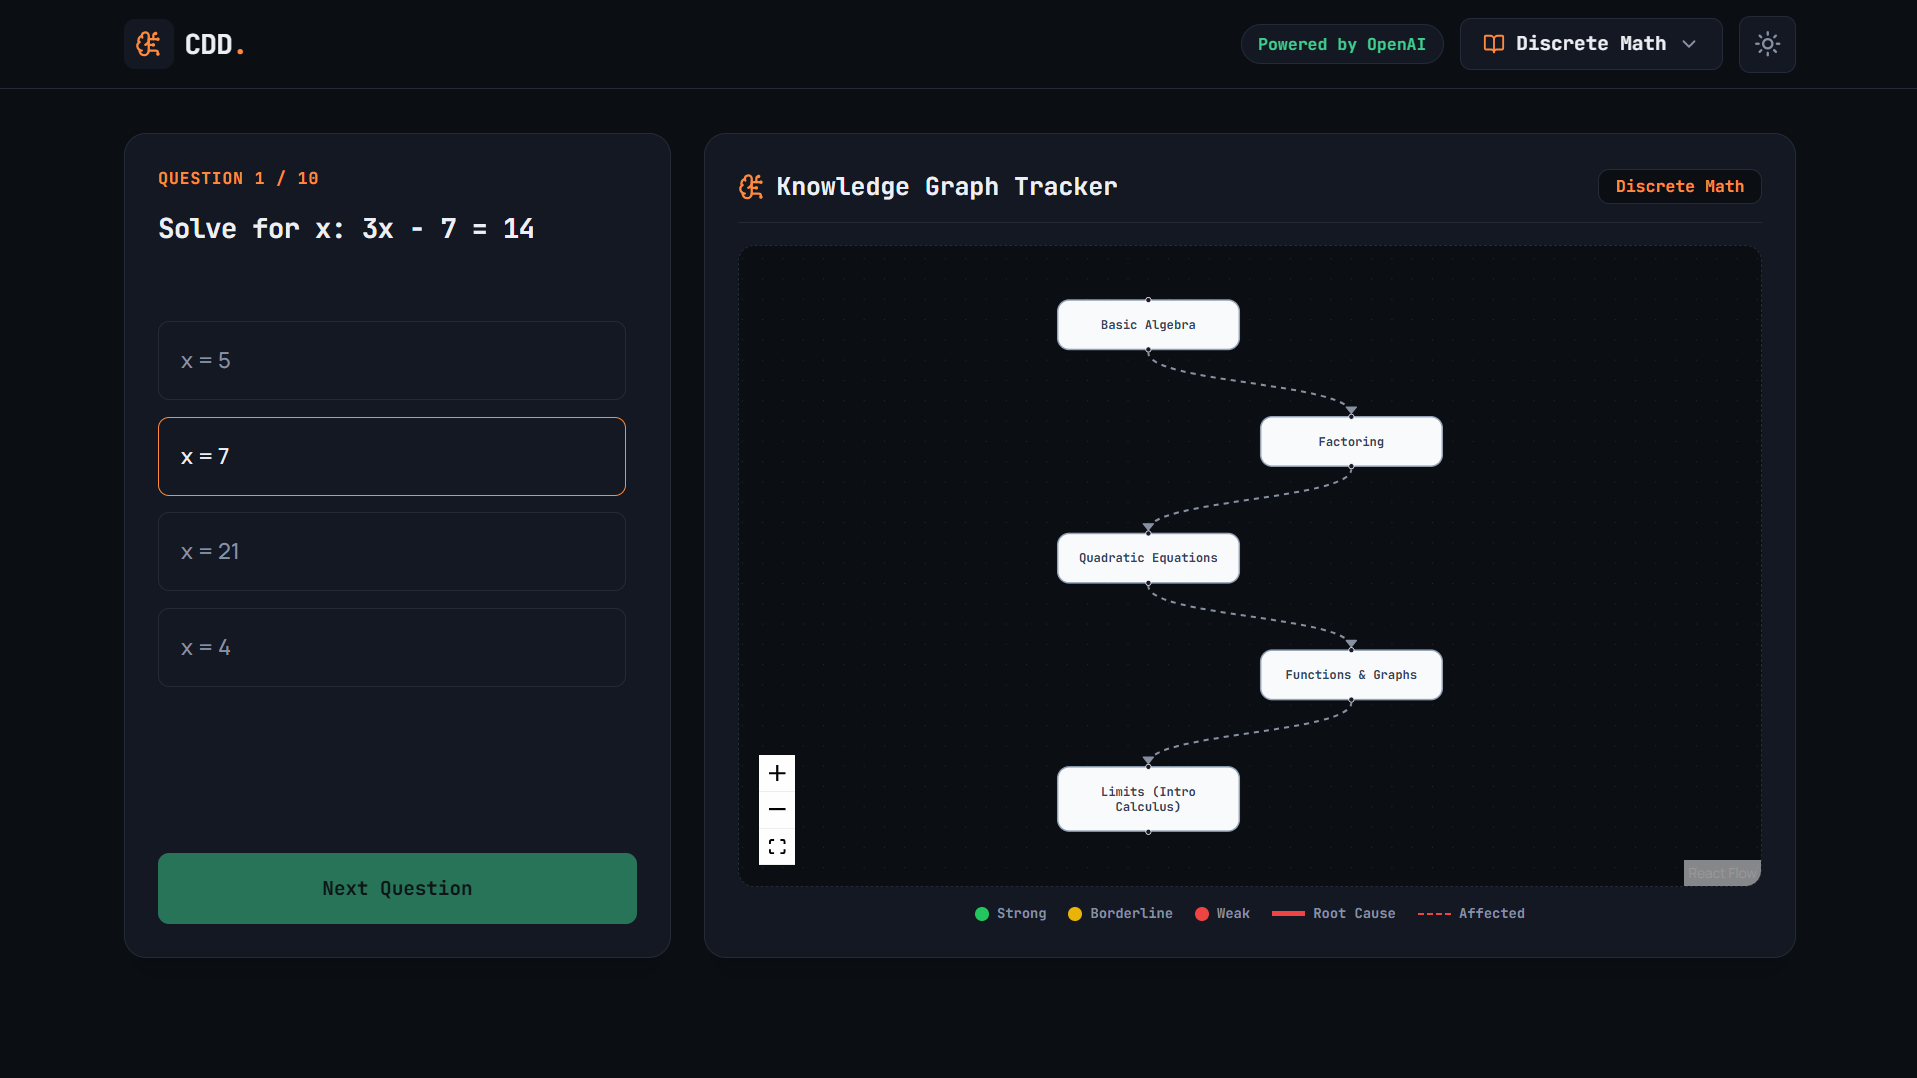
Concept Dependency Debugger (cdd ) treats a subject as a dependency graph — for example, Arrays → Linked Lists → Stacks & Queues → Trees → Graphs — where each concept builds on the ones before it. A student takes a short diagnostic quiz across the chain, and instead of scoring each topic independently, our propagation engine traces weaknesses Upstream.
If a student scores well on a downstream topic but the prerequisite underneath it is weak, CDD doesn't take that score at face value — it flags it as unreliable and traces back to find the true root cause. The result is shown on a live dependency graph, with the root cause visually distinguished from its downstream, cascading effects, plus a transparency panel showing the exact raw-vs-adjusted score and reasoning behind every adjustment.
GPT-5.6 then converts that structured diagnosis into a clear, encouraging explanation with a concrete next step. The engine currently works across six subjects: Data Structures, Math, DBMS, Computer Networks, OOP, and Web Development.
How we built it
Frontend: React + Vite , TailwindCSS, React Flow for the interactive dependency graph visualization Backend: Node.js + Express, hosting a custom propagation engine that traverses the concept graph in dependency order and computes adjusted mastery scores
AI layer : GPT-OSS-120b - used specifically at the explanation layer. The root-cause diagnosis itself is deterministic (computed by our propagation engine), and GPT-OSS-120b's job is turning that structured result into a clear, human-readable explanation
Codex: Used throughout implementation to iterate directly on the existing codebase - building the root-cause visualization system, adding a borderline scoring tier, keeping the design consistent across dark/light mode, and extending the engine to new subjects, while keeping frontend and backend logic in sync
Challenges we ran into
Designing the propagation logic itself. - Deciding exactly how an upstream weakness should "cap" a downstream score - without just zeroing it out - took real iteration. We validated it against deliberately constructed test cases, like a student scoring 100% on Graphs while Trees underneath it was weak, to make sure the engine correctly flagged the score as unreliable rather than trusting it at face value.
Root cause vs. symptom, visually- Early versions showed every weak node in the same red styling, which made the graph look like "everything is broken" instead of clearly showing one root cause and its downstream effects. We had to separate root-cause styling (thick border, badge) from affected-node styling (dashed border) to make the diagnosis legible at a glance.
Threshold granularity - With two questions per concept, raw scores can only land on 0%, 50%, or 100% - we discovered our original borderline range (60–79%) was mathematically unreachable given that scoring granularity, and had to realign our thresholds to the actual possible score values.
Consistent design without breaking function. - Unifying the visual design across the landing page and the in-app product (including a dark/light theme toggle) while making sure the graph's functional status colors (strong/borderline/weak) stayed independent of the general theme — otherwise a theme change would wash out the diagnostic signal that's core to the product.
Handling the "all mastered" case gracefully. - When no root cause exists, the UI initially reused the warning-style layout, which looked like an error. We built a dedicated, distinct success state instead.
Accomplishments that we're proud of
- A propagation engine that's fully deterministic and explainable - every adjustment can be traced back to a specific prerequisite, shown transparently in the "show the math" panel, rather than being a black box
- Generalizing the engine across six genuinely different subjects, proving the dependency-graph approach isn't hardcoded to one domain
What we learned
Building a diagnostic tool taught us that the hardest part isn't the AI layer — it's designing a scoring model that's both simple enough to explain and rigorous enough to trust. We also learned a lot about keeping a design system consistent across an entire app without accidentally breaking functional UI elements that need to stay independent of theming.
What's next for Concept Dependency Debugger
Expanding the question bank per concept for finer-grained scoring, adding a faculty/teacher view for classroom-wide diagnostics, and building an adaptive quiz mode that focuses follow-up questions on suspected weak areas in real time.
Built With
- codex
- express.js
- google-font
- groq
- llm
- node.js
- react
- react-flow
- rest-api
- tailwindcss
- vite

Log in or sign up for Devpost to join the conversation.