LoRaWAN Dataset — SSI Canada Hackathon
A full-stack LoRaWAN monitoring dashboard for the Computer Networks Hackathon in partnership with SSI Canada (January 31st, 2026). Ingest ChirpStack uplink JSON into SQLite, serve it via a FastAPI backend, and explore devices, sites, and time-series in a single-page web app.
What You Can Do
1. Ingest real data
- Run
scripts/ingest.pyto load uplink JSON fromdataset/intodata/uplinks.db. - The ingest normalizes event fields (time, device, gateway, RSSI/SNR, decoded payload, battery) and supports multiple device types and gateways.
2. Add synthetic data (optional)
scripts/generate_synthetic.py— Inserts synthetic devices (level, soil, climate, doors, SW3L) with plausible time-series so you can demo all views even with sparse real data. Run afteringest.py.scripts/append_synthetic_live.py— Appends one new synthetic uplink every 30 seconds. Run alongside the API and use Live / auto-refresh (15 s) on the dashboard to see new points (e.g. Synthetic Soil 1 in Soil view). Stop with Ctrl+C.
3. Run the API and dashboard
- Start the server:
uvicorn scripts.api:app --reload --host 0.0.0.0 --port 8000 - Open http://localhost:8000 in a browser.
- The API serves device lists, time-series, gateways, site events, anomalies, and health; the dashboard is a single-page app (HTML/JS/CSS) with sidebar navigation.
4. Use the dashboard
| Section | What you can do |
|---|---|
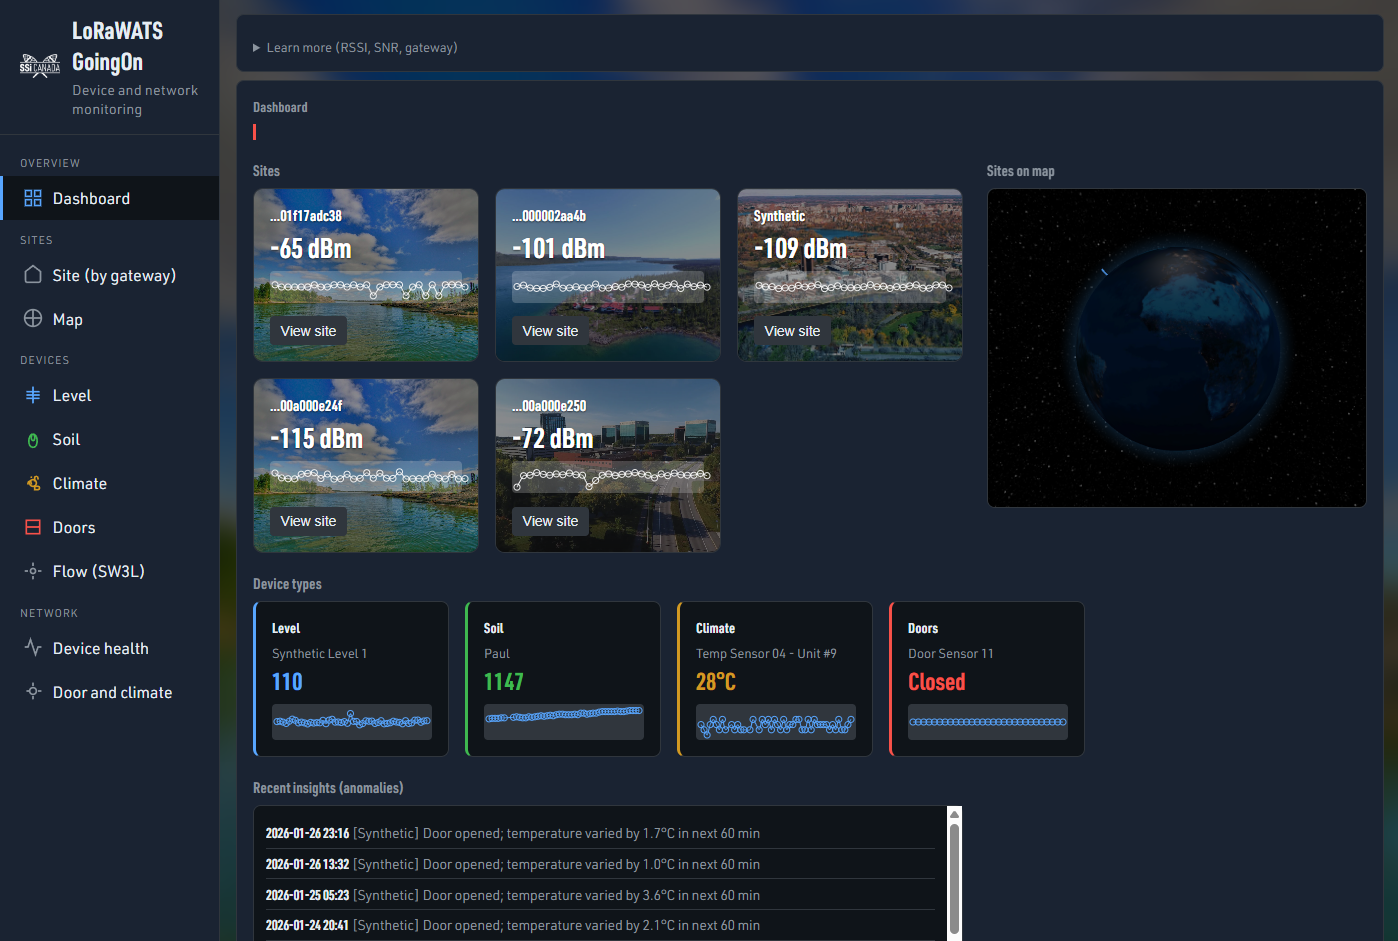
| Dashboard | Overview: site cards (per gateway, with RSSI and banner images), device-type cards (Level, Soil, Climate, Doors) with sparklines and latest value, recent anomalies, and a Sites on map (Leaflet) view. Full-page blurred site background. |
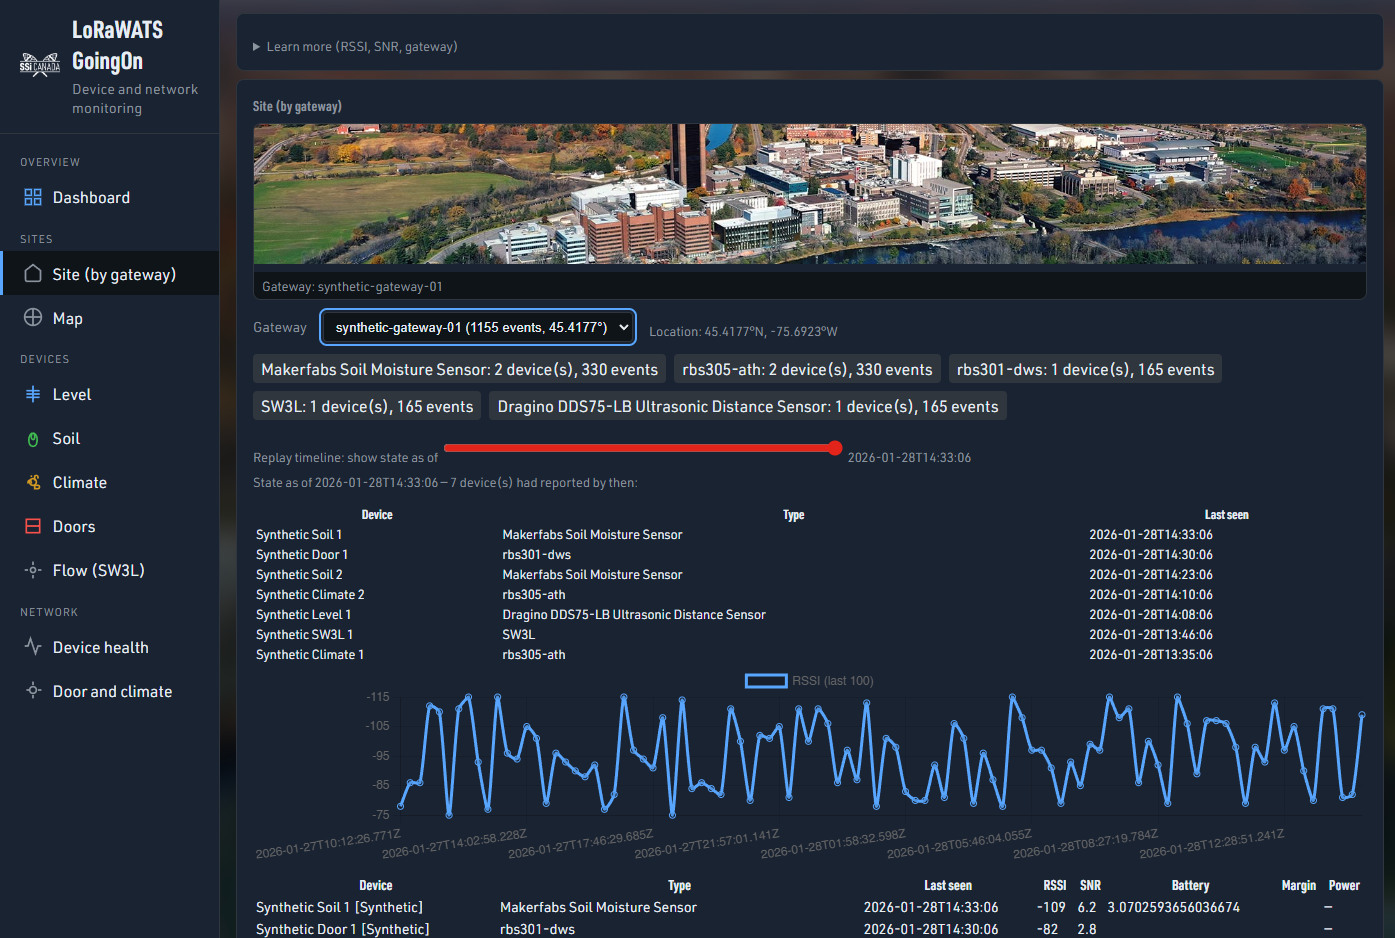
| Site (by gateway) | Pick a gateway; see a site banner, location, device summary, timeline scrubber, RSSI chart, and device health for everything that gateway heard. |
| Map | Gateway map with pins; click a pin to jump to that gateway’s Site view. Weak links (RSSI < -100) listed below. |
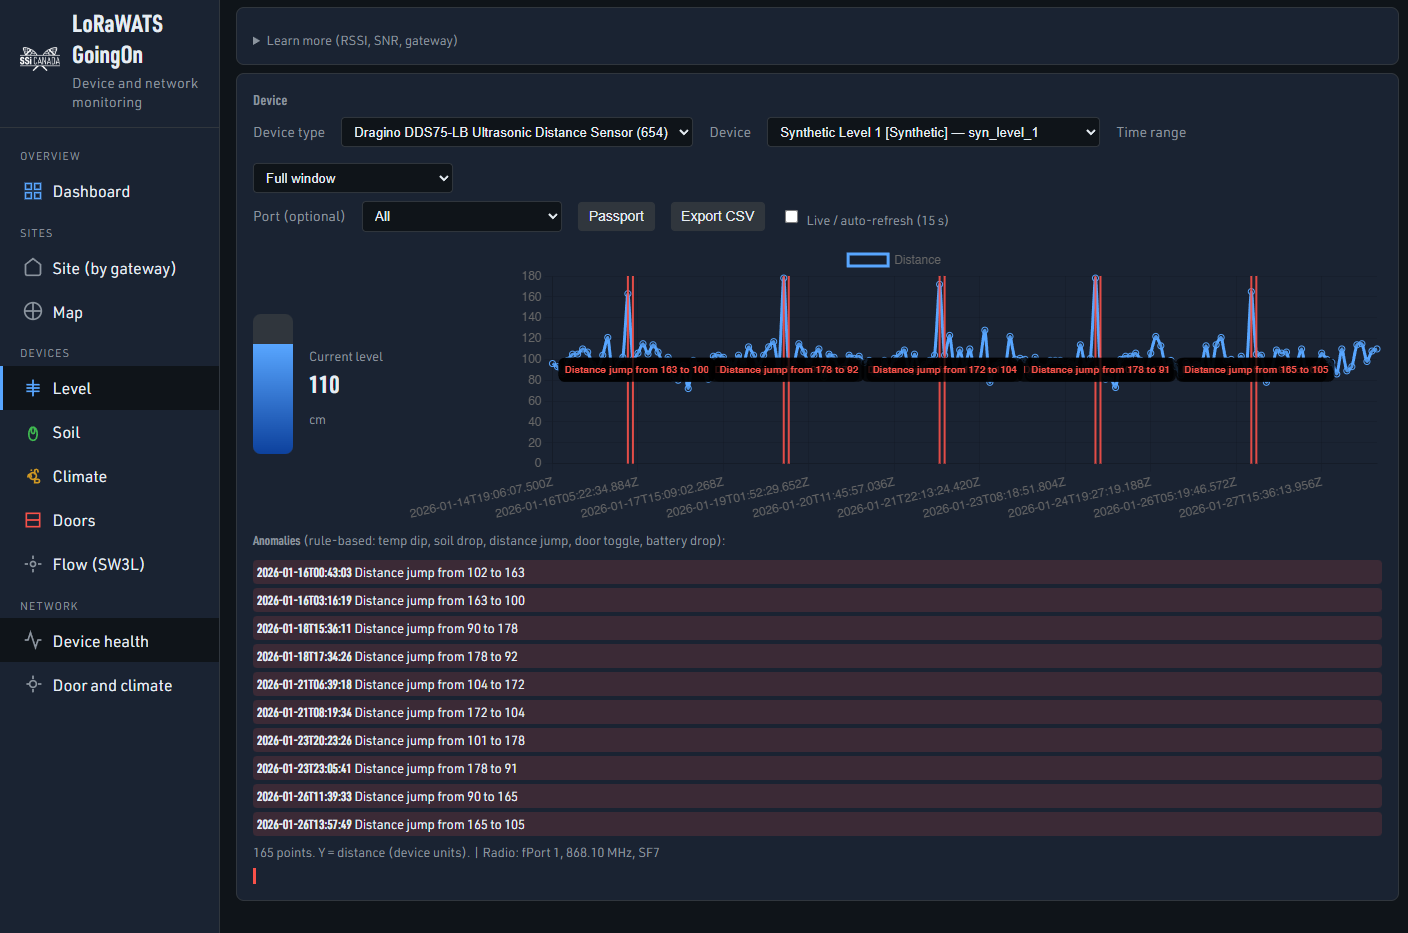
| Level | Pick a level device; see a visual water-level gauge (current level in cm, bar + value) side-by-side with the distance time-series chart. |
| Soil | Soil moisture value and temperature over time. |
| Climate | Temperature and humidity over time. |
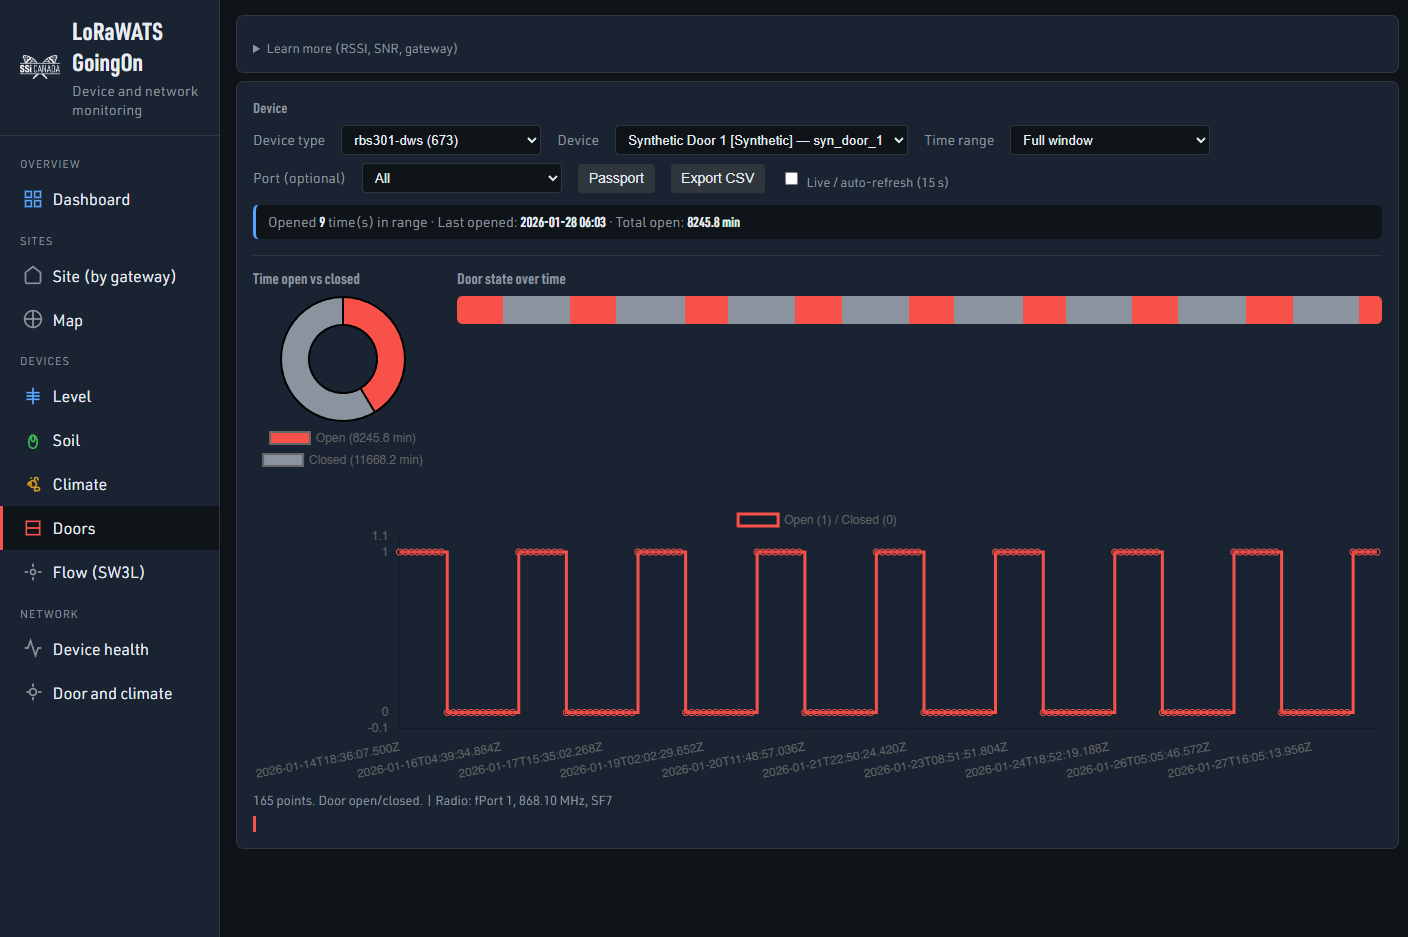
| Doors | Door open/closed over time; pie chart (time open vs closed) and activity bar (gantt) side-by-side. No anomaly list on this view. |
| Flow (SW3L) | Battery (e.g. config/BAT) over time. |
| Device health | Table of all devices: last seen, battery, RSSI, SNR, margin, power; sortable columns. |
| Door and climate | Pick a gateway; one timeline with door open/close and temp/humidity (correlation view). |
Other behaviour: Passport and Export CSV per device; auto-refresh option; URL state for view/profile/device/gateway; anomaly annotations on charts (except Doors); site backdrop images on Dashboard and Site (full-page, blurred, dark overlay).
Repository Structure
| Path | Description |
|---|---|
dataset/ |
Raw ChirpStack uplink JSON (one file per event), organized by device type and devEui. |
data/uplinks.db |
SQLite database of ingested uplinks (created by ingest.py). |
scripts/ingest.py |
Ingestion script: walks dataset/, parses JSON, writes normalized rows to data/uplinks.db. |
scripts/generate_synthetic.py |
Inserts synthetic devices and time-series for demo. |
scripts/append_synthetic_live.py |
Appends synthetic uplinks periodically for live demo. |
scripts/api.py |
FastAPI app: REST API + serves app/static and fonts/. |
app/static/ |
Dashboard UI: index.html, css/style.css, js/ (config, api, charts, views, main, url-state), images/ (logos, site banners, placeholders). |
fonts/ |
URW DIN fonts used by the dashboard. |
requirements.txt |
Python deps: FastAPI, uvicorn. |
LoRaWAN.tgz |
Optional archive of datasets (uncompress to get dataset/). |
Quick Start
Ingest (once):
python scripts/ingest.pyOptional — synthetic data:
python scripts/generate_synthetic.pyStart server:
uvicorn scripts.api:app --reload --host 0.0.0.0 --port 8000Open:
http://localhost:8000Optional — live synthetic points:
In another terminal:python scripts/append_synthetic_live.py
Then in the dashboard, enable Live / auto-refresh and pick a synthetic device (e.g. Synthetic Soil 1 in Soil view).
Python: 3.10+ recommended. Install deps: pip install -r requirements.txt.
Device Coverage
The dataset and dashboard support 7 device types across 5 device views (Level, Soil, Climate, Doors, Flow). Synthetic scripts add more devices for demos.
| View | Device types | What you see |
|---|---|---|
| Level | DDS75-LB, EM500-UDL | Distance (tank/level) over time + visual level gauge |
| Soil | Makerfabs Soil Moisture | Soil value + temp over time |
| Climate | rbs305-ATH, RBS301 Temp | Temperature + humidity over time |
| Doors | rbs301-DWS | Open/closed over time + pie + activity bar |
| Flow (SW3L) | SW3L | Battery over time |
Important LoRaWAN Terminology
- DevEUI — Unique device identifier (64 bit).
- DevAddr — Device address (32 bit).
- AppEUI — Application identifier (64 bit).
- GatewayEUI — Gateway identifier (64 bit).
Device Information
| Name | Link |
|---|---|
| Dragino DDS75-LB Ultrasonic Distance Sensor | https://www.dragino.com/products/distance-level-sensor/item/271-dds75-lb-ls.html |
| Makerfabs Soil Moisture Sensor (LoRaWAN) | https://github.com/Makerfabs/LoraWAN-Soil-Moisture |
| Dragino SW3L | https://www.dragino.com/products/water-meter-flow-sensor/item/222-sw3l.html |
| Milesight EM500-UDL | https://www.milesight.com/iot/product/lorawan-sensor/em500-udl |
| MultiTech RBS301 Temp Sensor | User Guide (PDF) |
| MultiTech RBS305-ATH | User Guide (PDF) |
| MultiTech RBS301-DWS | https://multitech.com/product/lorawan-door-window-sensor-for-indoor-use-north-america/ |


Log in or sign up for Devpost to join the conversation.